Exhibit 99.1
EXECUTIVE SUMMARY
CD12_COVID-19 STUDY
04-Mar-2021
| Confidential | Page 1 of 42 |
Exhibit 99.1
EXECUTIVE SUMMARY
CD12_COVID-19 STUDY
04-Mar-2021
| Confidential | Page 1 of 42 |
|
Leronlimab (PRO 140) CD12_COVID-19 Executive Summary |
TABLE OF CONTENTS
| 1. |
SUMMARY |
7 | ||||
| 1.1 |
SUMMARY FIGURES |
10 | ||||
| 2. |
INTRODUCTION |
16 | ||||
| 2.1 |
Disease Background |
16 | ||||
| 2.2 |
Leronlimab (PRO 140) |
16 | ||||
| 3. |
STUDY OVERVIEW |
16 | ||||
| 3.1 |
Patient Population |
17 | ||||
| 3.2 |
Endpoints |
17 | ||||
| 3.3 |
Analysis Population |
18 | ||||
| 3.3.1 |
Subgroup analysis - Age group | 18 | ||||
| 3.4 |
Results Description |
18 | ||||
| 3.4.1 |
Primary endpoint (All-cause mortality at Day 28) | 19 | ||||
| 3.4.2 |
Primary endpoint (All-cause mortality at Day 28) – Additional Analyses | 19 | ||||
| 3.4.3 |
Patients achieving OS 6 or higher (Discharged alive) | 21 | ||||
| 3.4.4 |
Change in clinical status of subject at Day 28 (on a 7 point ordinal scale) | 22 | ||||
| 3.4.5 |
Length of hospital stay (days) | 23 | ||||
| 3.5 |
Safety Analysis |
24 | ||||
| 4. |
SUMMARY TABLES |
25 | ||||
| Confidential | Page 2 of 42 |
|
|
Leronlimab (PRO 140) CD12_COVID-19 Executive Summary |
List of In-Text Figures
| Figure 1-1: All-Cause Mortality, Day 28 |
10 | |||
| Figure 1-2: All-Cause Mortality (Day 28), Prior and Concomitant COVID-19 Treatment |
11 | |||
| Figure 1-3: All-Cause Mortality (Day 28), Prior and Concomitant Dexamethasone Use |
12 | |||
| Figure 1-4: Ordinal Scale 6 or higher (Discharged alive) |
13 | |||
| Figure 1-5: Change in clinical status of subject at Day 28 (on a 7 point ordinal scale) |
14 | |||
| Figure 1-6: Length of Hospital Stay (Days) |
15 | |||
| Confidential | Page 3 of 42 |
|
|
Leronlimab (PRO 140) CD12_COVID-19 Executive Summary |
List of In-Text Tables
| Table 1-1: |
Effect of Randomization by Age on 28-Day All-Cause Mortality | 7 | ||||
| Table 4-1: |
Analysis Population, All Subjects | 25 | ||||
| Table 4-2: |
Summary of Demographics, mITT Population | 25 | ||||
| Table 4-3: |
Mortality Status at Day 28, mITT Population | 26 | ||||
| Table 4-4: |
Mortality Status at Day 28, > 65 years, mITT Population | 26 | ||||
| Table 4-5: |
Mortality Status at Day 28, £ 65 years, mITT Population | 26 | ||||
| Table 4-6: |
Mortality Status at Day 28 - Ordinal Scale 2 at Baseline, mITT population | 27 | ||||
| Table 4-7: |
Mortality Status at Day 28 - Ordinal Scale 2 at Baseline, > 65 years, mITT population | 27 | ||||
| Table 4-8: |
Mortality Status at Day 28 - Ordinal Scale 2 at Baseline, £ 65 years, mITT population | 27 | ||||
| Table 4-9: |
Mortality Status at Day 28 - with Prior or Concomitant COVID-19 Treatments, mITT Population | 28 | ||||
| Table 4-10: |
Mortality Status at Day 28 - with Prior or Concomitant COVID-19 Treatments, > 65 years, mITT Population | 28 | ||||
| Table 4-11: |
Mortality Status at Day 28 - with Prior or Concomitant COVID-19 Treatments, £ 65 years, mITT Population | 28 | ||||
| Table 4-12: |
Mortality Status at Day 28 - with Prior or Concomitant COVID-19 Treatments - Ordinal Scale 2 at Baseline, mITT Population | 29 | ||||
| Table 4-13: |
Mortality Status at Day 28 - with Prior or Concomitant COVID-19 Treatments - Ordinal Scale 2 at Baseline, > 65 years, mITT Population | 29 | ||||
| Table 4-14: |
Mortality Status at Day 28 - with Prior or Concomitant COVID-19 Treatments - Ordinal Scale 2 at Baseline, £ 65 years, mITT Population | 29 | ||||
| Table 4-15: |
Mortality Status at Day 28 - with Prior or Concomitant Dexamethasone Use, mITT Population | 30 | ||||
| Table 4-16: |
Mortality Status at Day 28 - with Prior or Concomitant Dexamethasone Use, > 65 years, mITT Population | 30 | ||||
| Table 4-17: |
Mortality Status at Day 28 - with Prior or Concomitant Dexamethasone Use, £ 65 years, mITT Population | 30 | ||||
| Table 4-18: |
Mortality Status at Day 28 - with Prior or Concomitant Dexamethasone Use - Ordinal Scale 2 at Baseline, mITT Population | 30 | ||||
| Confidential | Page 4 of 42 |
|
|
Leronlimab (PRO 140) CD12_COVID-19 Executive Summary |
| Table 4-19: |
Proportion of Subjects Achieving a Category of 6 or Higher on the Ordinal Scale at Day 28, mITT Population | 31 | ||||
| Table 4-20: |
Proportion of Subjects Achieving a Category of 6 or Higher on the Ordinal Scale at Day 28, > 65 years, mITT Population | 32 | ||||
| Table 4-21: |
Proportion of Subjects Achieving a Category of 6 or Higher on the Ordinal Scale at Day 28, £ 65 years, mITT Population | 33 | ||||
| Table 4-22: |
Proportion of Subjects Achieving a Category of 6 or Higher on the Ordinal Scale at Day 28 - Ordinal Scale 2 at Baseline, mITT Population | 34 | ||||
| Table 4-23: |
Proportion of Subjects Achieving a Category of 6 or Higher on the Ordinal Scale at Day 28 - Ordinal Scale 2 at Baseline, > 65 years, mITT Population | 34 | ||||
| Table 4-24: |
Proportion of Subjects Achieving a Category of 6 or Higher on the Ordinal Scale at Day 28 - Ordinal Scale 2 at Baseline, £ 65 years, mITT Population | 34 | ||||
| Table 4-25: |
Summary of Change in Clinical Status (on a 7 point ordinal scale) at Day 28 - Rank ANCOVA, mITT Population | 35 | ||||
| Table 4-26: |
Summary of Change in Clinical Status (on a 7 point ordinal scale) at Day 28 - Rank ANCOVA, > 65 years, mITT Population | 36 | ||||
| Table 4-27: |
Summary of Change in Clinical Status (on a 7 point ordinal scale) at Day 28 - Rank ANCOVA, £ 65 years, mITT Population | 37 | ||||
| Table 4-28: |
Summary of Change in Clinical Status (on a 7 point ordinal scale) at Day 28 - Ordinal Scale 2 at Baseline, Rank ANCOVA, mITT Population | 38 | ||||
| Table 4-29: |
Summary of Change in Clinical Status (on a 7 point ordinal scale) at Day 28 - Ordinal Scale 2 at Baseline, > 65 years, Rank ANCOVA, mITT Population | 38 | ||||
| Table 4-30: |
Summary of Change in Clinical Status (on a 7 point ordinal scale) at Day 28 - Ordinal Scale 2 at Baseline, £ 65 years, Rank ANCOVA, mITT Population | 39 | ||||
| Table 4-31: |
Summary of Length of Hospital Stay (Days), mITT Population | 40 | ||||
| Table 4-32: |
Summary of Length of Hospital Stay (Days), > 65 years, mITT Population | 40 | ||||
| Table 4-33: |
Summary of Length of Hospital Stay (Days), £ 65 years, mITT Population | 40 | ||||
| Table 4-34: |
Summary of Length of Hospital Stay (Days) - Ordinal Scale 2 at Baseline, mITT Population | 41 | ||||
| Table 4-35: |
Summary of Length of Hospital Stay (Days) - Ordinal Scale 2 at Baseline, > 65 years, mITT Population | 41 | ||||
| Table 4-36: |
Summary of Length of Hospital Stay (Days) - Ordinal Scale 2 at Baseline, £ 65 years, mITT Population | 41 | ||||
| Confidential | Page 5 of 42 |
|
|
Leronlimab (PRO 140) CD12_COVID-19 Executive Summary |
| Table 4-37: |
Overview of Adverse Events, Safety Population | 42 | ||||
| Table 4-38: |
Overview of Adverse Events, Critical Population | 42 | ||||
| Confidential | Page 6 of 42 |
|
|
Leronlimab (PRO 140) CD12_COVID-19 Executive Summary |
| 1. | SUMMARY |
Leronlimab (PRO 140) has been studied in a Phase 2b/3, two-arm, randomized, double-blind, placebo-controlled study to evaluate its safety and efficacy as add-on therapy in patients being treated with institutional standard of care (SoC) for severe or critical symptoms of respiratory illness caused by coronavirus disease 2019 (COVID-19).
394 subjects were randomized in a 2:1 ratio to leronlimab or placebo, in combination with SoC therapies. 384 subjects received at least one dose of the study medication (leronlimab 700 mg Or placebo administered subcutaneously on Day 0 and Day 7) and are included in the mITT analyses.
The study population includes 62 critically ill (Baseline Ordinal Score 2) and 322 non-critically ill (Baseline Ordinal Score 3 or higher) patients having confirmed diagnosis of COVID-19 by standard RT-PCR assay or equivalent testing.
Demographic and baseline characteristics showed a higher proportion of >65 years old [33% (88/259) vs 23% (29/125)] population were enrolled in the leronlimab + SoC group compared to placebo + SoC group. The mortality rate reported in the >65 years group is about 3.5 times higher compared to the £65 years group [42% (49/117) vs. 12% (31/267)] in the study. Therefore, additional analyses for the primary and major secondary endpoints were conducted to demonstrate the survival benefit of leronlimab in: age group > 65 years; age group £ 65 years; and adjusted for the age group (> 65 years and £ 65 years).
RESULTS:
The below table summarizes Day 28 all-cause mortality for combined and subgroups by age:
Table 1-1: Effect of Randomization by Age on 28-Day All-Cause Mortality
| Death/Randomized (%) | Absolute Reduction |
Relative Reduction | ||||||
| Leronlimab | Placebo | |||||||
| Day 28 Mortality, mITT |
53/259 (20.5%) | 27/125 (21.6%) | 1.1% | 5.3% | ||||
| Day 28 Mortality, mITT, > 65y |
36/88 (40.9%) | 13/29 (44.8%) | 3.9% | 8.7% | ||||
| Day 28 Mortality, mITT, £ 65y |
17/171 (9.9%) | 14/96 (14.6%) | 4.7% | 31.8% | ||||
|
| ||||||||
| • | Survival benefit: A favorable, statistically significant results (p value 0.0319) reported for the primary endpoint (all-cause mortality at Day 28) in participants receiving leronlimab + “commonly used COVID-19 treatments” compared to participants who received “commonly used COVID-19 treatments” alone in the placebo group in the overall mITT population. |
Similar statistically significant results (p value 0.0552) reported for the primary endpoint (all-cause mortality at Day 28) among participants who received dexamethasone as the prior or concomitant standard of care treatment for COVID-19, compared to patients who received dexamethasone (without leronlimab) as standard of care therapy in the overall mITT population.
| Confidential | Page 7 of 42 |
|
|
Leronlimab (PRO 140) CD12_COVID-19 Executive Summary |
| Death/Randomized (%) | P value | |||||
| Leronlimab | Placebo | |||||
| Day 28 Mortality, mITT, prior or concomitant COVID treatment |
34/205 (16.6%) | 24/104 (23.1%) | 0.0319 | |||
| Day 28 Mortality, mITT, prior or concomitant dexamethasone use |
25/155 (16.1%) | 17/78 (21.8%) | 0.0552 | |||
|
| ||||||
Note: p-value is from logistic model adjusted for stratification factor and age based on non-missing observed data.
| • | Shortened time to recovery: The average length of hospital stay was lower in leronlimab group compared to placebo/SoC group in the critically ill population with a statistically significant p value of 0.0050 using the Rank-ANCOVA model. |
| Days | P value | |||||
| Leronlimab | Placebo | |||||
| Mean Length of hospital stay (days), mITT, Baseline OS=2 |
33.0 | 38.5 | 0.005 | |||
|
| ||||||
Note: p-value is from the rank-ANCOVA model adjusted for stratification factor and age
| • | Leronlimab improved the probability of “discharged alive” at Day 28 in the overall mITT population as well as in the critically ill population with the results trending towards statistical significance. |
| Responders/Randomized (%) | P value | |||||
| Leronlimab | Placebo | |||||
| OS 6 or higher, mITT Day 28 (responders) - No Imputation |
126/259 (48.6%) | 54/125 (43.2%) | 0.0697 | |||
| OS 6 or higher, mITT Day 28 (responders) Baseline OS=2 |
12/43 (27.9%) | 2/19 (10.5%) | 0.0824 | |||
|
| ||||||
Note: p-value is from logistic model adjusted for stratification factor and age based on non-missing observed data
| • | Safety Analysis: |
The safety analysis of leronlimab in COVID-19 patients was found consistent with the established extensive safety profile with over 1000 patients treated across other multiple studies and indications. Leronlimab in combination with other commonly used COVID-19 treatments was well-tolerated with no new safety signal detected in the CD12_COVID-19 study. The overall incidence rate, frequency and severity of adverse events (AEs) and serious adverse events (SAEs) were similar between the leronlimab + SoC and placebo + SoC groups in this study.
| • | Conclusions: |
| • | The potential benefit of adding leronlimab to SoC was consistently seen in the critically ill patient population by virtue of numerically better results for all prespecified evaluated clinical endpoints. |
| Confidential | Page 8 of 42 |
|
|
Leronlimab (PRO 140) CD12_COVID-19 Executive Summary |
| • | Adding leronlimab to the commonly used COVID-19 treatments including dexamethasone reduced mortality compared to the commonly used treatments without leronlimab in the critically ill patient population and in the overall mITT population. |
| • | Given these findings, there is a high likelihood that critically ill COVID-19 patients may benefit from leronlimab added on to SoC treatments. Given the favorable safety profile of leronlimab, the current mortality rate, and the absolute number of deaths due to COVID-19 in the USA and around the world, the availability of leronlimab for emergency use has the potential to save many lives. |
| Confidential | Page 9 of 42 |
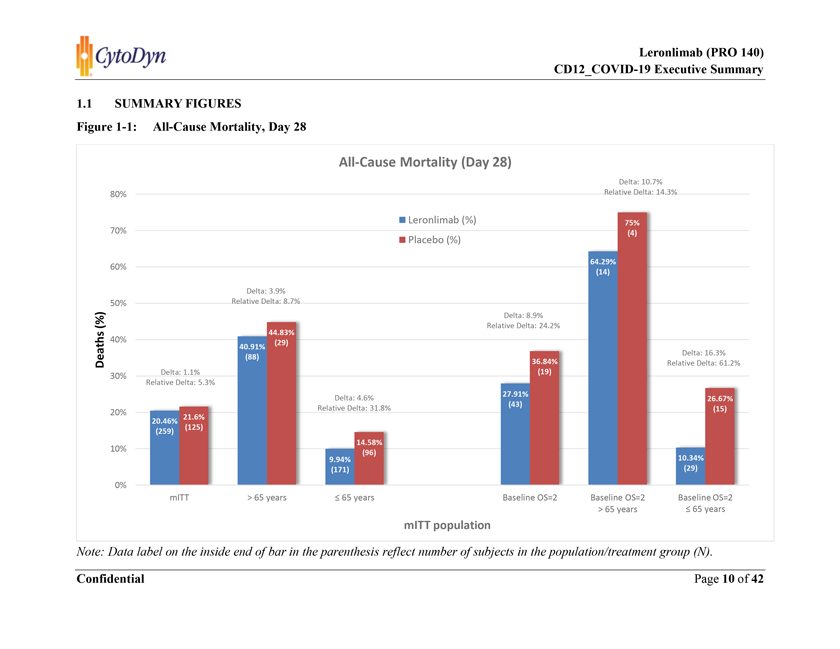
1.1 SUMMARY FIGURES Figure 1-1: All-Cause Mortality, Day 28 Note: Data label on the inside end of bar in the parenthesis reflect number of subjects in the population/treatment group (N).
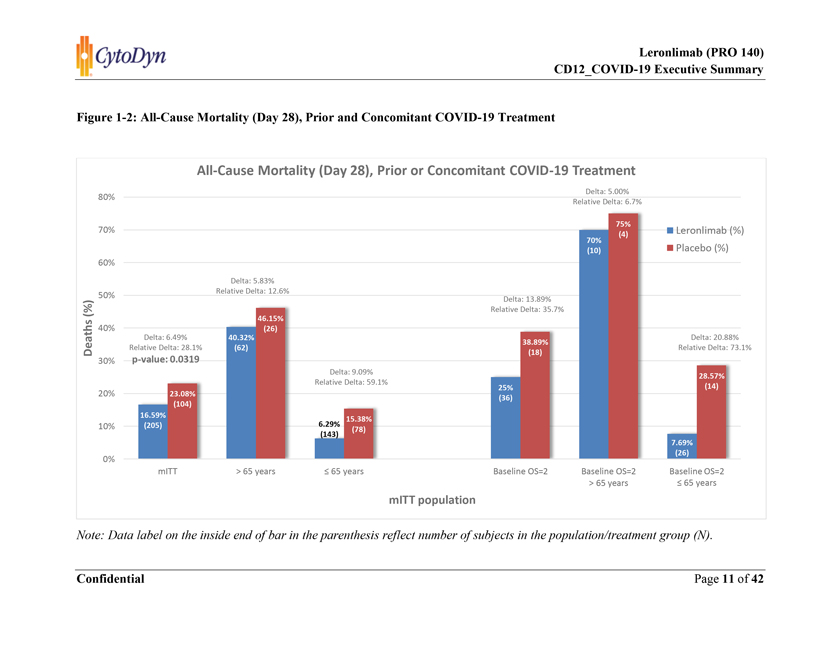
Figure 1-2: All-Cause Mortality (Day 28), Prior and Concomitant COVID-19 Treatment Note: Data label on the inside end of bar in the parenthesis reflect number of subjects in the population/treatment group (N).
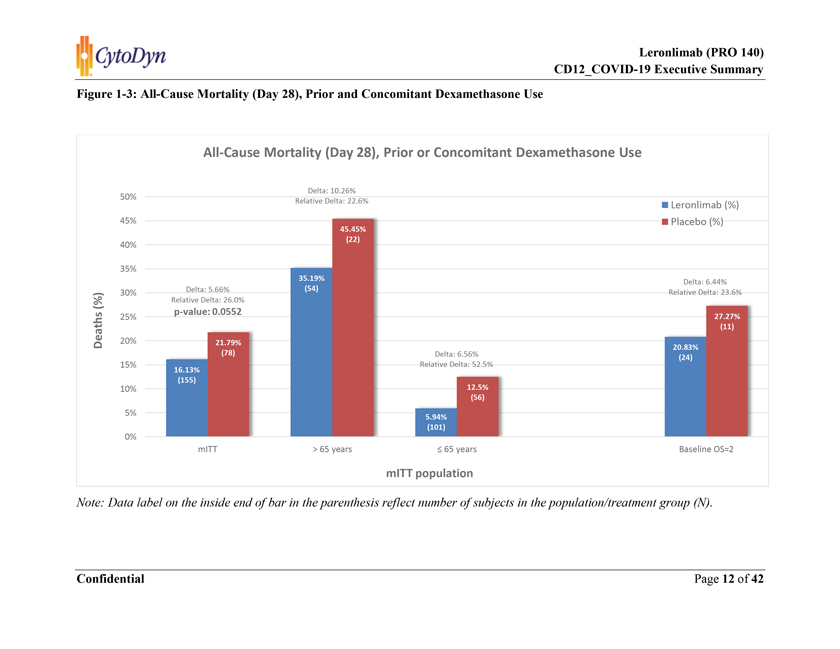
Figure 1-3: All-Cause Mortality (Day 28), Prior and Concomitant Dexamethasone Use Note: Data label on the inside end of bar in the parenthesis reflect number of subjects in the population/treatment group (N).
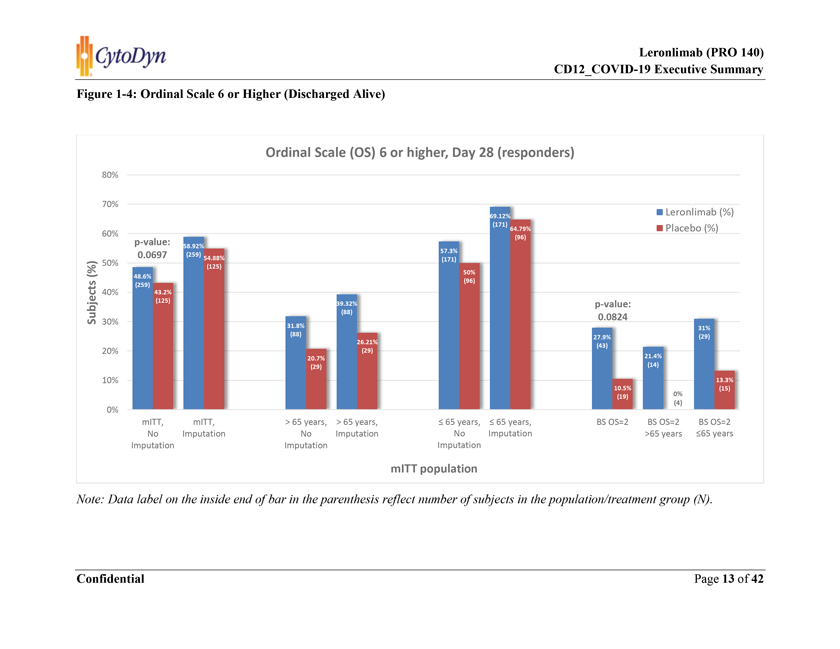
Figure 1-4: Ordinal Scale 6 or Higher (Discharged Alive) Note: Data label on the inside end of bar in the parenthesis reflect number of subjects in the population/treatment group (N).
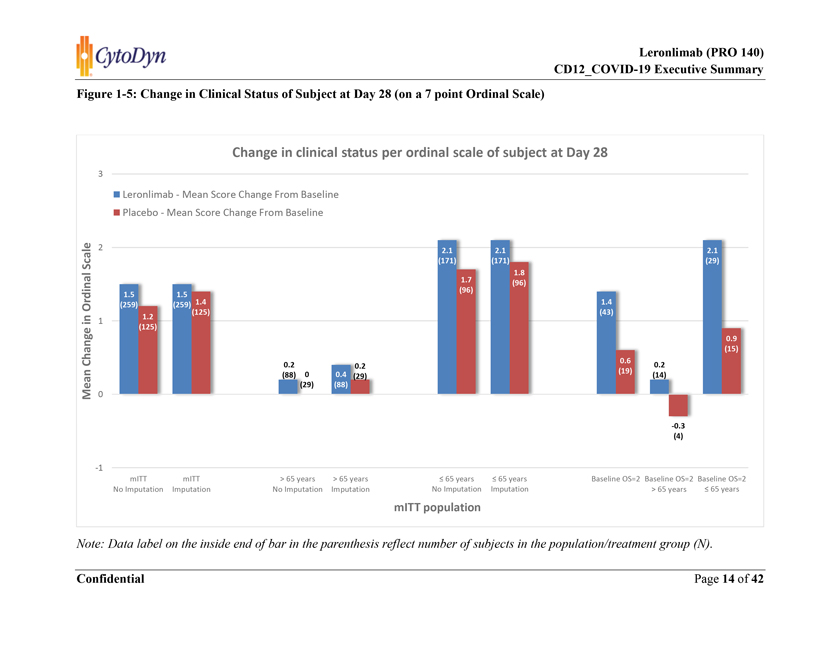
Figure 1-5: Change in Clinical Status of Subject at Day 28 (on a 7 point Ordinal Scale) Note: Data label on the inside end of bar in the parenthesis reflect number of subjects in the population/treatment group (N).
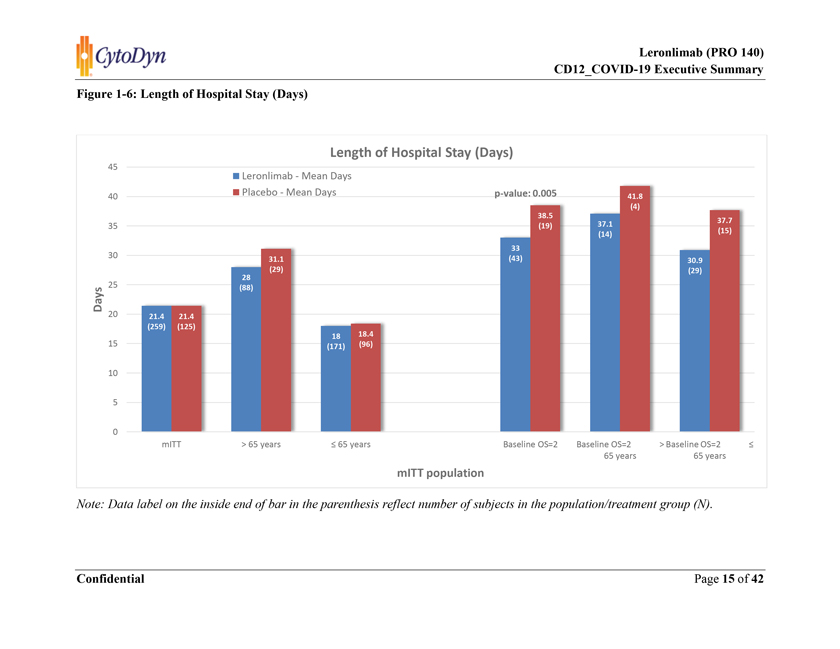
Figure 1-6: Length of Hospital Stay (Days) Note: Data label on the inside end of bar in the parenthesis reflect number of subjects in the population/treatment group (N).
|
|
Leronlimab (PRO 140) CD12_COVID-19 Executive Summary |
| 2. | INTRODUCTION |
| 2.1 | DISEASE BACKGROUND |
COVID-19 is a disease caused by a novel coronavirus that emerged in Wuhan, China, in December 2019. Other diseases caused by coronaviruses include severe acute respiratory syndrome (SARS), Middle East respiratory syndrome (MERS), and the common cold. COVID-19 manifests as a respiratory illness of widely varying clinical severity. At the most severe end of the spectrum, it results in severe pneumonia and respiratory failure. Acute respiratory distress syndrome (ARDS) is often the preterminal event in patients with COVID-19. Severe COVID-19 is often associated with the release of proinflammatory cytokines, which may cause or exacerbate lung injury leading to life-threatening disease.
| 2.2 | LERONLIMAB (PRO 140) |
Leronlimab (PRO 140) is a humanized IgG4,k monoclonal antibody (mAb) that recognizes the C-C chemokine receptor type 5 (CCR5). Leronlimab acts as a competitive inhibitor by binding the N-terminus and second extracellular loop and blocking CCR5-mediated infection of cells. CCR5 is expressed predominantly on T cells but also found on macrophages, dendritic cells, and eosinophils to mediate chemotaxis in response to its cognate ligands that include CCL5 (RANTES), CCL3 (MIP-1α), and CCL4 (MIP-1ß). These ligands are integral in the recruitment of these immune cells to inflammatory sites. The immunopathogenesis of COVID-19 likely involves the excessive influx of immune cells into the lung. SARS-CoV-1 has very similar clinical findings to COVID-19 and elicits high levels of CCL5 expression by airway epithelial cells and macrophages. Disruption of the CCL5-CCR5 axis via leronlimab-mediated CCR5 blockade might prevent pulmonary trafficking of pro-inflammatory leukocytes and dampen pathogenic immune activation in COVID-19.
The migration of macrophages and release of pro-inflammatory cytokines led to acute respiratory distress syndrome (ARDS) in lungs. The ARDS has known to be one of the main reasons for mortalities in patients with COVID-19. CytoDyn believes that leronlimab, a CCR5 antagonist, is potentially therapeutic in inhibiting pro-inflammatory cytokines responses as observed in ARDS and could be useful in treating COVID-19.
| 3. | STUDY OVERVIEW |
This study is a Phase 2b/3, two-arm, randomized, double-blind, placebo-controlled, adaptive design study to evaluate the safety and efficacy of leronlimab (PRO 140) in patients with severe or critical symptoms of respiratory illness caused by coronavirus disease 2019 (COVID-19). Approximately 390 subjects are to be randomized in a 2:1 ratio to leronlimab or placebo group. Leronlimab 700mg (175 mg/mL) and placebo were administered subcutaneously as an add-on to the institutional standard of care treatment (SoC).
| Confidential | Page 16 of 42 |
|
|
Leronlimab (PRO 140) CD12_COVID-19 Executive Summary |
| 3.1 | PATIENT POPULATION |
The study population includes critically ill and non-critically ill hospitalized patients with a confirmed diagnosis of COVID-19 by standard RT-PCR assay or equivalent testing.
Critical Illness:
Based on clinical severity on the baseline Ordinal Scale (OS) score of 2
OS 2 = Hospitalized, on invasive mechanical ventilation or extracorporeal membrane oxygenation (ECMO).
Note: The patient, if intubated, must have positive end-expiratory pressure (PEEP) <15 cmH2O with PaO2/FiO2 >150 mmHg to enroll in the study.
Non Critical (Severe) Illness:
Based on clinical severity on the baseline Ordinal Scale (OS) score of 3 or 4
OS 3 = Hospitalized, on non-invasive ventilation or high flow oxygen devices.
OS 4 = Hospitalized, requiring supplemental oxygen.
The study allowed co-administration of approved or off-label COVID-19 treatments as part of standard-of-care therapies.
| 3.2 | ENDPOINTS |
The primary endpoint and major secondary endpoints (at Day 28) are presented in this Executive Summary.
| • | Primary Endpoint: |
| • | All-cause mortality at Day 28 |
| • | Major Secondary Endpoints: |
| • | Proportion of patients achieving a category of 6 or higher at Day 28 (on a 7 point ordinal scale). |
| • | Change in clinical status of subject at Day 28 (on a 7 point ordinal scale) |
Note: A 7-category ordinal scale of patient health status ranges from: 1) Death; 2) Hospitalized, on invasive mechanical ventilation or extracorporeal membrane oxygenation (ECMO); 3) Hospitalized, on non-invasive ventilation or high flow oxygen devices; 4) Hospitalized, requiring supplemental oxygen; 5) Hospitalized, not requiring supplemental oxygen; 6) Not hospitalized, limitation on activities; 7) Not hospitalized, no limitations on activities.
| • | Length of hospital stay (days). |
| Confidential | Page 17 of 42 |
|
|
Leronlimab (PRO 140) CD12_COVID-19 Executive Summary |
Note: Subgroup analyses were conducted based on baseline Ordinal Scale (OS) for patient severity (OS 2 = Critically ill; OS 3&4 = Non-Critically ill) for the primary and major secondary endpoints listed above.
| 3.3 | ANALYSIS POPULATION |
A summary of the analysis populations is provided in Table 4-1.
A total of 394 subjects were randomized and thus included in the Intent-to-Treat (ITT) population.
Of those, 384 (97.5%) subjects who received at least one dose of study treatment (leronlimab or placebo) were included in the Modified Intent-to-Treat (mITT) and Safety population. The demographics summaries for the mITT population is provided in Table 4-2. Demographic and baseline characteristics were generally balanced except for a slightly higher proportion of non-white (50% vs 44%), and >65 years old (33% vs 23%) population in the Leronlimab + SoC group. Both of these groups of COVID-19 patients are known to have higher mortality rates.
Among the 384 participants, 62 (16%) subjects are categorized under critically ill population based on an ordinal scale score of 2 at baseline, i.e. patients hospitalized, on invasive mechanical ventilation or extracorporeal membrane oxygenation (ECMO), as described in Section 3.1.
As defined in the statistical analysis plan, the Modified Intent-to-Treat (mITT) Population is used to analyze the primary and secondary efficacy endpoints and Safety Population is used for the analysis of safety parameters or measurements.
| 3.3.1 | Subgroup analysis - Age group |
Demographic and baseline characteristics showed a higher proportion of >65 years old [34% (88/259) vs 23% (29/125)] population were enrolled in the leronlimab + SoC group compared to placebo + SoC group. The mortality rate reported in the >65 years group is about 3.5 times higher compared to the £65 years group [42% (49/117) vs. 12% (31/267)] in the study. Therefore, additional analyses for the primary and major secondary endpoints were conducted to demonstrate the survival benefit of leronlimab in:
| a. | Age group > 65 years |
| b. | Age group £ 65 years; and |
| c. | Adjusted for the age group (> 65 years and £ 65 years) |
| 3.4 | RESULTS DESCRIPTION |
A total of 384 subjects randomized and treated (mITT), 259 in leronlimab and 125 in placebo group.
| Confidential | Page 18 of 42 |
|
|
Leronlimab (PRO 140) CD12_COVID-19 Executive Summary |
3.4.1 Primary endpoint (All-cause mortality at Day 28)
Overall population:
The survival benefit of adding leronlimab to SoC was evident in both > 65 years and £ 65 years age group within overall mITT population.
> 65 years: All-cause mortality among > 65 years age group was 41% (36 out of 88 subjects died) within 28 days of treatment initiation in leronlimab + SoC group compared to 45% (13 out of 29 subjects died) in placebo + SoC group (Table 4-4). This is approximately a 9% relative reduction in mortality observed with leronlimab when given in combination with other SoC therapies compared to SoC alone.
£ 65 years: All-cause mortality among £ 65 years age group was 10% (17 out of 171 subjects died) within 28 days of treatment initiation in leronlimab + SoC group compared to 15% (14 out of 96 subjects died) in placebo + SoC group (Table 4-5). This is approximately a 32% relative reduction in mortality observed with leronlimab when given in combination with other SoC therapies compared to SoC alone.
Critical population:
Out of 62 patients in the critically ill population, 19 (31%) died within 28 days. Leronlimab showed a survival benefit in critically ill COVID-19 patients. All-cause mortality among critically ill patients was 28% (12/43) with leronlimab + SoC and 37% (7/19) with placebo + SoC at day 28 (Table 4-6). This is approximately a 24% relative reduction in mortality observed with leronlimab when given in combination with other SoC therapies compared to SoC alone in the critically ill population.
> 65 years: All-cause mortality among > 65 years age group was 64% (9/14) within 28 days of treatment initiation in leronlimab + SoC group compared to 75% (3/4) in placebo + SoC group (Table 4-7). This is approximately a 14% relative reduction in mortality observed with leronlimab when given in combination with other SoC therapies compared to SoC alone in > 65 years age group in critically ill population.
£ 65 years: All-cause mortality among £ 65 years age group was 10% (3/29) within 28 days of treatment initiation in leronlimab + SoC group compared to 27% (4/15) in placebo + SoC group (Table 4-8). This is approximately a 61% relative reduction in mortality observed with leronlimab when given in combination with other SoC therapies compared to SoC alone in £ 65 years age group in the critically ill population.
3.4.2 Primary endpoint (All-cause mortality at Day 28) – Additional Analyses
3.4.2.1 Leronlimab + specific COVID-19 treatments vs. specific COVID-19 treatments alone
The study allowed prior and co-administration of any approved or off-label COVID-19 treatments as the standard of care therapies. Hence, subgroup analyses were performed to evaluate the treatment effect of leronlimab in subjects receiving these commonly used COVID-19 treatments. For the purpose of subgroup analyses, the following medications were considered “commonly used treatment for COVID-19: hydroxychloroquine or chloroquine with or without azithromycin,
| Confidential | Page 19 of 42 |
|
|
Leronlimab (PRO 140) CD12_COVID-19 Executive Summary |
remdesivir, dexamethasone (or other corticosteroids), monoclonal antibodies (such as bamlanivimab, casirivimab, imdevimab, siltuximab), immunomodulatory agents (such as baricitinib, sarilumab, clazakizumab, tocilizumab, anakinra), and convalescent plasma therapy. Approximately 80% of the participants received these medications (309/384). Leronlimab, when added on these “commonly used treatment”, seems to provide additional survival benefit at Day 28. Mortality rate was 17% (34/205) in subjects receiving leronlimab + “commonly used treatment” compared to 23% (24/104) in subjects who received “commonly used treatments” alone in the placebo group in the overall mITT population, a relative reduction in mortality by approximately 28%. This was statistically significant with p value of 0.0319 using the logit model. (Table 4-9)
> 65 years: All-cause mortality rate was 40% (25/62) in subjects receiving leronlimab + “commonly used treatment” compared to 46% (12/26) in subjects who received placebo + “commonly used treatments” in the > 65 years age group of overall mITT population, a relative reduction of approximately 13%. (Table 4-10)
£ 65 years: All-cause mortality rate was 6% (9/143) in subjects receiving leronlimab + “commonly used treatment” compared to 15% (12/78) in subjects who received placebo + “commonly used treatments” in the £ 65 years age group of overall mITT population, a relative reduction of approximately 59%. (Table 4-11)
Critical population:
Majority of the critically ill patients received these medications (54/62). Mortality rate was 25% (9/36) in subjects receiving leronlimab + “commonly used treatment” compared to 39% (7/18) in subjects who received “commonly used treatments” alone in the placebo group in the critically ill population. This is approximately a 36% relative reduction in mortality observed with leronlimab when given in combination with other SoC therapies compared to SoC alone in the critically ill population. (Table 4-12)
> 65 years: All-cause mortality rate was 70% (7/10) in subjects receiving leronlimab + “commonly used treatment” compared to 75% (3/4) in subjects who received placebo + “commonly used treatments” in the > 65 years age group of critically ill population. This is approximately a 7% relative reduction in mortality observed with leronlimab when given in combination with other SoC therapies compared to SoC alone in the > 65 years age group of critically ill population. (Table 4-13)
£ 65 years: All-cause mortality rate was 8% (2/26) in subjects receiving leronlimab + “commonly used treatment” compared to 29% (4/14) in subjects who received placebo + “commonly used treatments” in the £ 65 years age group of critically ill population. This is approximately a 73% relative reduction in mortality observed with leronlimab when given in combination with other SoC therapies compared to SoC alone in the £ 65 years age group of critically ill population. (Table 4-14)
| Confidential | Page 20 of 42 |
|
|
Leronlimab (PRO 140) CD12_COVID-19 Executive Summary |
3.4.2.2 Leronlimab + Dexamethasone vs. Dexamethasone alone
Approximately 60% of the participants (233/384) received dexamethasone, a systemic corticosteroid. Among participants who received dexamethasone as the prior or concomitant standard of care treatment for COVID-19, the mortality rate within 28 days was lower in leronlimab group (leronlimab + dexamethasone) compared to patients who received dexamethasone (without leronlimab) as standard of care therapy [16% (25/155) vs 22% (17/78)] in the overall mITT population. This is approximately a 26% relative reduction in mortality observed with leronlimab when given in combination with dexamethasone compared to dexamethasone alone. (Table 4-15). The p value of 0.0552 using the logit model.
> 65 years: Among participants in > 65 years age group who received dexamethasone as prior or concomitant SoC treatment for COVID-19, the mortality rate within 28 days was lower in leronlimab group (leronlimab + dexamethasone) compared to patients who received dexamethasone (without leronlimab) as SoC therapy [35% (19/54) vs 45% (10/22)] in the overall mITT population. This is approximately a 23% relative reduction in mortality observed with leronlimab when given in combination with dexamethasone compared to dexamethasone alone in > 65 years age group of the overall mITT population. (Table 4-16)
£ 65 years: Among participants in £ 65 years age group who received dexamethasone as prior or concomitant SoC treatment for COVID-19, the mortality rate within 28 days was lower in leronlimab group (leronlimab + dexamethasone) compared to patients who received dexamethasone (without leronlimab) as SoC therapy [6% (6/101) vs 13% (7/56)] in the overall mITT population. This is approximately a 53% relative reduction in mortality observed with leronlimab when given in combination with dexamethasone compared to dexamethasone alone in £ 65 years age group of the overall mITT population. (Table 4-17)
Critical population:
Among critically ill participants who received dexamethasone as prior or concomitant SoC treatment for COVID-19, the mortality rate within 28 days was lower in leronlimab group (leronlimab + dexamethasone) compared to patients who received dexamethasone (without leronlimab) as SoC therapy [21% (5/24) vs 27% (3/11)]. This is approximately a 24% relative reduction in mortality observed with leronlimab when given in combination with dexamethasone compared to dexamethasone alone in the critically ill population. (Table 4-18)
3.4.3 Patients achieving OS 6 or higher (Discharged alive)
Overall population:
Evaluation of the clinical status at Day 28 was assessed with a 7-level ordinal scale (with higher score indicating better outcome). The study enrolled hospitalized patients with an ordinal scale (OS) Score of 2, 3, or 4 at baseline. The OS score of 6 refers to participant who is not hospitalized with limitation on activities and 7 refers to not hospitalized with no limitations on activities.
| Confidential | Page 21 of 42 |
|
|
Leronlimab (PRO 140) CD12_COVID-19 Executive Summary |
Leronlimab improved the probability of “discharged alive” at Day 28, to 49% (126/259) from 43% (54/125) in the placebo + SoC group, a relative improvement of approximately 13% among hospitalized patients of varying severity at baseline (from those needing supplemental oxygen to those requiring intubation) with a p-value of 0.0697 using the logit model. (Table 4-19A). The results of an additional analysis using multiple imputation for missing data are presented in Table 4-19B.
> 65 years: A numerically higher proportion of patients were discharged from hospital alive in the leronlimab + SoC (32%) vs placebo + SoC (21%) in > 65 years age group. (Table 4-20A). This is approximately a 54% relative improvement or higher probability of discharged alive from hospital with leronlimab group compared to placebo (SoC alone) group. The results of an additional analysis using multiple imputation for missing data is presented in Table 4-20B.
£ 65 years: A numerically higher proportion of patients were discharged from hospital alive in the leronlimab + SoC (57%) vs placebo + SoC (50%) in £ 65 years age group. (Table 4-21A). This is approximately a 15% relative improvement or higher probability of discharged alive from hospital with leronlimab group compared to placebo (SoC alone) group. The results of an additional analysis using multiple imputation for missing data are presented in Table 4-21B.
Critical population:
28% (12/43) of the critically-ill population (i.e., on invasive mechanical ventilation/intubated at baseline) who received leronlimab + SoC were discharged from the hospital within 28 days compared to only 11% (2/19) patients in the placebo + SoC group (Table 4-22), a relative improvement of approximately 166% in the proportion of patients discharged within 28 days in leronlimab group compared to SoC alone (P-value of 0.0824)
> 65 years: 21% (3/14) of the critically-ill population in > 65 years age group who received leronlimab + SoC were discharged from the hospital within 28 days compared to none 0% (0/4) of the patients in the placebo + SoC group (Table 4-23).
£ 65 years: 31% (9/29) of the critically-ill population in £ 65 years age group who received leronlimab + SoC were discharged from the hospital within 28 days compared to only 13% (2/15) of the patients in the placebo + SoC group (Table 4-24). This is a relative improvement of approximately 133% in participants who received leronlimab compared to the placebo group.
3.4.4 Change in clinical status of subject at Day 28 (on a 7 point ordinal scale)
Overall population:
The improvement in clinical status according to the ordinal scale score at Day 28 was higher in the leronlimab + SoC group compared to the placebo + SoC group. The mean change (improvement) in the ranking on an ordinal scale from baseline to Day 28 was (+1.5) in leronlimab + SoC group compared to (+1.2) in the placebo + SoC group (Table 4-25A). The results of an additional analysis using multiple imputation for missing data is presented in Table 4-25B.
| Confidential | Page 22 of 42 |
|
|
Leronlimab (PRO 140) CD12_COVID-19 Executive Summary |
> 65 years: The mean change (improvement) in the ranking on an ordinal scale from baseline to Day 28 was (+0.2) in leronlimab + SoC group compared to (-0.0) in the placebo + SoC group in > 65 years age group (Table 4-26A). The results of an additional analysis using multiple imputation for missing data are presented in Table 4-26B.
£ 65 years: The mean change (improvement) in the ranking on an ordinal scale from baseline to Day 28 was (+2.1) in leronlimab + SoC group compared to (+1.7) in the placebo + SoC group in £ 65 years age group (Table 4-27A). The results of an additional analysis using multiple imputation for missing data are presented in Table 4-27B.
Critical population:
The improvement in clinical status according to the ordinal scale score at Day 28 was higher in the leronlimab + SoC group compared to the placebo + SoC group. The mean change (improvement) in the ranking on an ordinal scale from baseline to Day 28 was (+1.4) in leronlimab + SoC group compared to only (+0.6) in the placebo + SoC group in the critically ill population. (Table 4-28)
> 65 years: The mean change (improvement) in the ranking on an ordinal scale from baseline to Day 28 was (+0.2) in leronlimab + SoC group compared to mean change (worsening) reported (-0.3) in the placebo + SoC group in the > 65 years age group of critically ill population. (Table 4-29)
£ 65 years: The mean change (improvement) in the ranking on an ordinal scale from baseline to Day 28 was (+2.1) in leronlimab + SoC group compared to only (+0.9) in the placebo + SoC group in the £ 65 years age group of critically ill population. (Table 4-30)
3.4.5 Length of hospital stay (days)
Overall population:
The average length of hospital stay was similar between the two treatment groups in the overall mITT population (21.4 days). (Table 4-31)
> 65 years: The average length of hospital stay was lower in leronlimab + SoC group (28 days) compared to the placebo + SoC group (31 days) in the > 65 years age group of overall mITT population. (Table 4-32)
£ 65 years: The average length of hospital stay was lower in leronlimab + SoC group (18 days) compared to the placebo + SoC group (19 days) in the £ 65 years age group of overall mITT population. (Table 4-33)
Critical population:
The average length of hospital stay was lower in leronlimab + SoC group (33 days) compared to the placebo + SoC group (39 days) in the critically ill population. This was statistically significant with p value of 0.0050 using the Rank-ANCOVA model. (Table 4-34)
| Confidential | Page 23 of 42 |
|
|
Leronlimab (PRO 140) CD12_COVID-19 Executive Summary |
> 65 years: The average length of hospital stay was lower in leronlimab + SoC group (37 days) compared to the placebo + SoC group (42 days) in the > 65 years age group of critically ill population. (Table 4-35)
£ 65 years: The average length of hospital stay was lower in leronlimab + SoC group (31 days) compared to the placebo + SoC group (38 days) in the £ 65 years age group of critically ill population. (Table 4-36)
| 3.5 | SAFETY ANALYSIS |
Leronlimab has an extensive safety profile available based on data from more than 1000 patients treated across multiple studies and indications. Leronlimab was generally well tolerated with no major safety concerns. Participants have received weekly subcutaneous doses of leronlimab with the longest duration of exposure lasting 5+ years in HIV setting.
The overall incidence rate, frequency, and severity of adverse events and serious adverse events (SAEs) were similar between the leronlimab and placebo group in the CD12_COVID-19 study.
An overview of all adverse events and serious adverse events (SAEs) reported in the study at the time of the data snapshot is provided in Table 4-37. There were 197 SAEs reported for 99 subjects (38.2%, 99/259) in the leronlimab (PRO 140) group and 98 SAEs reported for 47 subjects (37.6%, 47/125) in the placebo group. Additionally, an overview of all adverse events and serious adverse events (SAEs) reported in the critically ill population is provided in Table 4-38.
| Confidential | Page 24 of 42 |
|
|
Leronlimab (PRO 140) CD12_COVID-19 Executive Summary |
| 4. | SUMMARY TABLES |
Table 4-1: Analysis Population, All Subjects
| Parameter |
Leronlimab 700 mg N=265 n(%) |
Placebo N=129 n(%) |
Total N=394 n(%) | |||
| Intent to Treat (ITT) population |
265 (100.0) | 129 (100.0) | 394 (100.0) | |||
| Modified-Intent to Treat (mITT) population |
259 (97.7) | 125 (96.9) | 384 (97.5) | |||
| Safety population |
259 (97.7) | 125 (96.9) | 384 (97.5) |
Note: All percentages are based on the number of subjects in the population and treatment group (N).
Table 4-2: Summary of Demographics, mITT Population
| Parameter |
Characteristic |
Leronlimab 700 mg N=259 |
Placebo N=125 |
Total N=384 | ||||
| Gender |
Male, n(%) | 169 (63.8) | 83 (64.3) | 252 (64.0) | ||||
| Female, n(%) | 90 (34.0) | 42 (32.6) | 132 (33.5) | |||||
| American Indian/Alaskan Native, n(%) | 1 (0.4) | 0 (0.0) | 1 (0.3) | |||||
| Asian, n(%) | 11 (4.2) | 7 (5.4) | 18 (4.6) | |||||
| Race |
Black/African-American, n(%) | 29 (10.9) | 23 (17.8) | 52 (13.2) | ||||
| White, n(%) | 133 (50.2) | 70 (54.3) | 203 (51.5) | |||||
| Other, n(%) | 85 (32.1) | 25 (19.4) | 110 (27.9) | |||||
| Not Hispanic/Latino, n(%) | 122 (46.0) | 72 (55.8) | 194 (49.2) | |||||
| Ethnicity |
Hispanic/Latino, n(%) | 123 (46.4) | 52 (40.3) | 175 (44.4) | ||||
| Not Reported, n(%) | 8 (3.0) | 0 (0.0) | 8 (2.0) | |||||
| Unknown, n(%) | 6 (2.3) | 1 (0.8) | 7 (1.8) | |||||
| Age (Years) [1] |
n | 259 | 125 | 384 | ||||
| Mean (SD) | 58.82 (13.82) |
58.51 (11.50) |
58.72 (13.09) | |||||
| Median | 59 | 58 | 59 | |||||
| Min - Max | 20-88 | 28-86 | 20-88 | |||||
| < 40 | 26 (9.8) | 8 (6.2) | 34 (8.6) | |||||
| Age Group |
40-65 | 145 (54.7) | 88 (68.2) | 233 (59.1) | ||||
| > 65 | 88 (33.2) | 29 (22.5) | 117 (29.7) |
[1] Age (Years) = Integer of [(date of informed consent - date of birth) / 365.25]
Note: All percentages are based on the number of subjects in the population and treatment group (N).
| Confidential | Page 25 of 42 |
|
|
Leronlimab (PRO 140) CD12_COVID-19 Executive Summary |
Table 4-3: Mortality Status at Day 28, mITT Population
| Category |
Leronlimab 700 mg N=259 |
Placebo N=125 |
Odds Ratio | 95% CI | ||||
| Subject Deceased, n (%) |
53 (20.46%) | 27(21.60%) | 0.70 | (0.39, 1.25) |
Note: Logistic model adjusted for stratification factor and age based on non-missing observed data.
Note: All percentages are based on the number of subjects in the population and treatment group (N).
Note: No imputation performed for missing data less than 10%.
Table 4-4: Mortality Status at Day 28, > 65 years, mITT Population
| Category |
Leronlimab 700 mg N=88 |
Placebo N=29 |
Odds Ratio | 95% CI | ||||
| Subject Deceased, n (%) |
36 (40.91%) | 13 (44.83%) | 0.79 | (0.32, 1.93) |
Note: Logistic model adjusted for stratification factor based on non-missing observed data
Note: All percentages are based on the number of subjects in the population and treatment group (N).
Note: No imputation performed for missing data less than 10%.
Table 4-5: Mortality Status at Day 28, £ 65 years, mITT Population
| Category |
Leronlimab 700 mg N=171 |
Placebo N=96 |
Odds Ratio | 95% CI | ||||
| Subject Deceased, n (%) |
17 (9.94%) | 14 (14.58%) | 0.64 | (0.30, 1.37) |
Note: Logistic model adjusted for stratification factor based on non-missing observed data
Note: All percentages are based on the number of subjects in the population and treatment group (N).
Note: No imputation performed for missing data less than 10%.
| Confidential | Page 26 of 42 |
|
|
Leronlimab (PRO 140) CD12_COVID-19 Executive Summary |
Table 4-6: Mortality Status at Day 28 - Ordinal Scale 2 at Baseline, mITT population
| Category |
Leronlimab 700 mg N=43 |
Placebo N=19 |
Odds Ratio | 95% CI | ||||
| Subject Deceased, n (%) |
12 (27.91%) | 7 (36.84%) | 0.43 | (0.10, 1.82) |
Note: Logistic model adjusted for stratification factor and age based on non-missing observed data
Note: All percentages are based on the number of subjects with Ordinal Scale of 2 at Baseline in the population and treatment group (N).
Note: No imputation performed for missing data less than 10%.
Table 4-7: Mortality Status at Day 28 - Ordinal Scale 2 at Baseline, > 65 years, mITT population
| Category |
Leronlimab 700 mg N=14 |
Placebo N=4 |
Odds Ratio | 95% CI | ||||
| Subject Deceased, n (%) |
9 (64.29%) | 3 (75.00%) | 1.00 | (0.06,15.99) |
Note: Logistic model adjusted for stratification factor based on non-missing observed data
Note: All percentages are based on the number of subjects with Ordinal Scale of 2 at Baseline in the population and treatment group (N).
Note: No imputation performed for missing data less than 10%.
Table 4-8: Mortality Status at Day 28 - Ordinal Scale 2 at Baseline, £ 65 years, mITT population
| Category |
Leronlimab 700 mg N=29 |
Placebo N=15 |
Odds Ratio | 95% CI | ||||
| Subject Deceased, n (%) |
3 (10.34%) | 4 (26.67%) | 0.32 | (0.06, 1.74) |
Note: Logistic model adjusted for stratification factor based on non-missing observed data
Note: All percentages are based on the number of subjects with Ordinal Scale of 2 at Baseline in the population and treatment group (N).
Note: No imputation performed for missing data less than 10%.
| Confidential | Page 27 of 42 |
|
|
Leronlimab (PRO 140) CD12_COVID-19 Executive Summary |
Table 4-9: Mortality Status at Day 28 - with Prior or Concomitant COVID-19 Treatments, mITT Population
| Category |
Leronlimab 700 mg N=205 |
Placebo N=104 |
Odds Ratio | 95% CI | ||||
| Subject Deceased, n (%) |
34 (16.59%) | 24 (23.08%) | 0.48 | (0.25, 0.94) |
Note: Logistic model adjusted for stratification factor and age based on non-missing observed data
Note: All percentages are based on the number of subjects in the population and treatment group (N).
Note: Commonly used COVID-19 treatment includes hydroxychloroquine or chloroquine with or without azithromycin, anti-viral agents (remdesivir), dexamethasone (or other corticosteroids), monoclonal antibodies (such as bamlanivimab, casirivimab, imdevimab, siltuximab), immunomodulatory agents (such as baricitinib, sarilumab, clazakizumab, tocilizumab, anakinra), and convalescent plasma therapy.
Table 4-10: Mortality Status at Day 28 - with Prior or Concomitant COVID-19 Treatments, > 65 years, mITT Population
| Category |
Leronlimab 700 mg N=62 |
Placebo N=26 |
Odds Ratio | 95% CI | ||||
| Subject Deceased, n (%) |
25 (40.32%) | 12 (46.15%) | 0.69 | (0.26, 1.85) |
Note: Logistic model adjusted for stratification factor based on non-missing observed data
Note: All percentages are based on the number of subjects in the population and treatment group (N).
Note: Commonly used COVID-19 treatment includes hydroxychloroquine or chloroquine with or without azithromycin, anti-viral agents (remdesivir), dexamethasone (or other corticosteroids), monoclonal antibodies (such as bamlanivimab, casirivimab, imdevimab, siltuximab), immunomodulatory agents (such as baricitinib, sarilumab, clazakizumab, tocilizumab, anakinra), and convalescent plasma therapy.
Table 4-11: Mortality Status at Day 28 - with Prior or Concomitant COVID-19 Treatments, £ 65 years, mITT Population
| Category |
Leronlimab 700 mg N=143 |
Placebo N=78 |
Odds Ratio | 95% CI | ||||
| Subject Deceased, n (%) |
9 (6.29%) | 12 (15.38%) | 0.34 | (0.14, 0.87) |
Note: Logistic model adjusted for stratification factor based on non-missing observed data
Note: All percentages are based on the number of subjects in the population and treatment group (N).
Note: Commonly used COVID-19 treatment includes hydroxychloroquine or chloroquine with or without azithromycin, anti-viral agents (remdesivir), dexamethasone (or other corticosteroids), monoclonal antibodies (such as bamlanivimab, casirivimab, imdevimab, siltuximab), immunomodulatory agents (such as baricitinib, sarilumab, clazakizumab, tocilizumab, anakinra), and convalescent plasma therapy.
| Confidential | Page 28 of 42 |
|
|
Leronlimab (PRO 140) CD12_COVID-19 Executive Summary |
Table 4-12: Mortality Status at Day 28 - with Prior or Concomitant COVID-19 Treatments - Ordinal Scale 2 at Baseline, mITT Population
| Category |
Leronlimab 700 mg N=36 |
Placebo N=18 |
Odds Ratio | 95% CI | ||||
| Subject Deceased, n (%) |
9 (25.00%) | 7 (38.89%) | 0.33 | (0.07, 1.62) |
Note: Logistic model adjusted for stratification factor and age based on non-missing observed data
Note: All percentages are based on the number of subjects with Ordinal Scale of 2 at Baseline in the population and treatment group (N).
Table 4-13: Mortality Status at Day 28 - with Prior or Concomitant COVID-19 Treatments - Ordinal Scale 2 at Baseline, > 65 years, mITT Population
| Category |
Leronlimab 700 mg N=10 |
Placebo N=4 |
Odds Ratio | 95% CI | ||||
| Subject Deceased, n (%) |
7 (70.00%) | 3 (75.00%) | 1.06 | (0.06,17.55) |
Note: Logistic model adjusted for stratification factor based on non-missing observed data
Note: All percentages are based on the number of subjects with Ordinal Scale of 2 at Baseline in the population and treatment group (N).
Table 4-14: Mortality Status at Day 28 - with Prior or Concomitant COVID-19 Treatments - Ordinal Scale 2 at Baseline, £ 65 years, mITT Population
| Category |
Leronlimab 700 mg N=26 |
Placebo N=14 |
Odds Ratio | 95% CI | ||||
| Subject Deceased, n (%) |
2 (7.69%) | 4 (28.57%) | 0.20 | (0.03, 1.37) |
Note: Logistic model adjusted for stratification factor based on non-missing observed data
Note: All percentages are based on the number of subjects with Ordinal Scale of 2 at Baseline in the population and treatment group (N).
| Confidential | Page 29 of 42 |
|
|
Leronlimab (PRO 140) CD12_COVID-19 Executive Summary |
Table 4-15: Mortality Status at Day 28 - with Prior or Concomitant Dexamethasone Use, mITT Population
| Category |
Leronlimab 700 mg N=155 |
Placebo N=78 |
Odds Ratio | 95% CI | ||||
| Subject Deceased, n(%) |
25 (16.13%) | 17 (21.79%) | 0.47 | (0.21, 1.02) |
Note: Logistic model adjusted for stratification factor and age based on non-missing observed data
Note: All percentages are based on the number of subjects in the population and treatment group (N).
Table 4-16: Mortality Status at Day 28 - with Prior or Concomitant Dexamethasone Use, > 65 years, mITT Population
| Category |
Leronlimab 700 mg N=54 |
Placebo N=22 |
Odds Ratio | 95% CI | ||||
| Subject Deceased, n(%) |
19 (35.19%) | 10 (45.45%) | 0.48 | (0.16, 1.44) |
Note: Logistic model adjusted for stratification factor based on non-missing observed data
Note: All percentages are based on the number of subjects in the population and treatment group (N).
Table 4-17: Mortality Status at Day 28 - with Prior or Concomitant Dexamethasone Use, £ 65 years, mITT Population
| Category |
Leronlimab 700 mg N=101 |
Placebo N=56 |
Odds Ratio | 95% CI | ||||
| Subject Deceased, n(%) |
6 (5.94%) | 7 (12.50%) | 0.40 | (0.13, 1.27) |
Note: Logistic model adjusted for stratification factor based on non-missing observed data
Note: All percentages are based on the number of subjects in the population and treatment group (N).
Table 4-18: Mortality Status at Day 28 - with Prior or Concomitant Dexamethasone Use - Ordinal Scale 2 at Baseline, mITT Population
| Category |
Leronlimab 700 mg N=24 |
Placebo N=11 |
Odds Ratio | 95% CI | ||||
| Subject Deceased, n(%) |
5 (20.83%) | 3 (27.27%) | 0.34 | (0.04, 2.60) |
Note: Logistic model adjusted for stratification factor and age based on non-missing observed data
Note: All percentages are based on the number of subjects with Ordinal Scale of 2 at Baseline in the population and treatment group (N).
| Confidential | Page 30 of 42 |
|
|
Leronlimab (PRO 140) CD12_COVID-19 Executive Summary |
Table 4-19: Proportion of Subjects Achieving a Category of 6 or Higher on the Ordinal Scale at Day 28, mITT Population
(A) No Imputation, Missing as Missing
| Visit |
Statistic |
Leronlimab 700 mg N=259 |
Placebo N=125 |
Odds Ratio | 95% CI | |||||||||
| Responders, n (%) |
126 (48.6%) | 54 (43.2%) | 1.617 | (0.96, 2.72 | ) | |||||||||
| Day 28 |
Non-Responders, n (%) |
94 (36.3%) | 52 (41.6%) | |||||||||||
| Missing, n (%) |
39 (15.1%) | 19 (15.2%) | ||||||||||||
Note: Logistic model adjusted for stratification factor and age based on non-missing observed data
Note: Responders refer to subjects who achieved a category of 6 or higher at Day 28.
Note: All percentages are based on the number of subjects in the population and treatment group (N).
(B) Multiple Imputation
| Visit |
Statistic |
Leronlimab 700 mg N=259 |
Placebo N=125 |
Odds Ratio | 95% CI | |||||
| Day 28 |
Responders, n (%) |
58.92% | 54.88% | 1.47 | (0.89, 2.42) | |||||
| Non-Responders, n (%) |
41.08% | 45.12% |
Note: Logistic model adjusted for stratification factor and age based on non-missing observed data
Note: Responders refer to subjects who achieved a category of 6 or higher at Day 28.
Note: All percentages are based on the number of subjects in the population and treatment group (N).
| Confidential | Page 31 of 42 |
|
|
Leronlimab (PRO 140) CD12_COVID-19 Executive Summary |
Table 4-20: Proportion of Subjects Achieving a Category of 6 or Higher on the Ordinal Scale at Day 28, > 65 years, mITT Population
(A) No Imputation, Missing as Missing
| Visit |
Statistic |
Leronlimab 700 mg N=88 |
Placebo N=29 |
Odds Ratio | 95% CI | |||||
| Responders, n (%) |
28 (31.8%) | 6 (20.7%) | 1.981 | ( 0.71, 5.55) | ||||||
| Day 28 |
Non-Responders, n (%) |
49 (55.7%) | 21 (72.4%) | |||||||
| Missing, n (%) |
11 (12.5%) | 2 (6.9%) |
Note: Logistic model adjusted for stratification factor based on non-missing observed data
Note: Responders refer to subjects who achieved a category of 6 or higher at Day 28.
Note: All percentages are based on the number of subjects in the population and treatment group (N).
(B) Multiple Imputation
| Visit |
Statistic |
Leronlimab 700 mg N=88 |
Placebo N=29 |
Odds Ratio | 95% CI | |||||
| Day 28 |
Responders, n (%) |
39.32% | 26.21% | 1.80 | ( 0.65, 4.97) | |||||
| Non-Responders, n (%) | 60.68% | 73.79% |
Note: Logistic model adjusted for stratification factor based on non-missing observed data
Note: Responders refer to subjects who achieved a category of 6 or higher at Day 28.
Note: All percentages are based on the number of subjects in the population and treatment group (N).
| Confidential | Page 32 of 42 |
|
|
Leronlimab (PRO 140) CD12_COVID-19 Executive Summary |
Table 4-21: Proportion of Subjects Achieving a Category of 6 or Higher on the Ordinal Scale at Day 28, £ 65 years, mITT Population
(A) No Imputation, Missing as Missing
| Visit |
Statistic |
Leronlimab 700 mg N=171 |
Placebo N=96 |
Odds Ratio | 95% CI | |||||
| Responders, n (%) |
98 (57.3%) | 48 (50.0%) | 1.554 | ( 0.84, 2.89) | ||||||
| Day 28 |
Non-Responders, n (%) |
45 (26.3%) | 31 (32.3%) | |||||||
| Missing, n (%) |
28 (16.4%) | 17 (17.7%) |
Note: Logistic model adjusted for stratification factor based on non-missing observed data
Note: Responders refer to subjects who achieved a category of 6 or higher at Day 28.
Note: All percentages are based on the number of subjects in the population and treatment group (N).
(B) Multiple Imputation
| Visit |
Statistic |
Leronlimab 700 mg N=171 |
Placebo N=96 |
Odds Ratio | 95% CI | |||||
| Day 28 |
Responders, n (%) |
69.12% | 64.79% | 1.32 | ( 0.74, 2.36) | |||||
| Non-Responders, n (%) |
30.88% | 35.21% |
Note: Logistic model adjusted for stratification factor based on non-missing observed data
Note: Responders refer to subjects who achieved a category of 6 or higher at Day 28.
Note: All percentages are based on the number of subjects in the population and treatment group (N).
| Confidential | Page 33 of 42 |
|
|
Leronlimab (PRO 140) CD12_COVID-19 Executive Summary |
Table 4-22: Proportion of Subjects Achieving a Category of 6 or Higher on the Ordinal Scale at Day 28 - Ordinal Scale 2 at Baseline, mITT Population
| Visit |
Statistic |
Leronlimab 700 mg N=43 |
Placebo N=19 |
Odds Ratio | 95% CI | |||||
| Responders, n (%) |
12 (27.9%) | 2 (10.5%) | 4.425 | ( 0.83,23.70) | ||||||
| Day 28 |
Non-Responders, n (%) |
27 (62.8%) | 16 (84.2%) | |||||||
| Missing, n (%) |
4 (9.3%) | 1 (5.3%) |
Note: Logistic model adjusted for stratification factor and age based on non-missing observed data
Note: Responders refer to subjects who achieved a category of 6 or higher at Day 28.
Note: All percentages are based on the number of subjects with Ordinal Scale of 2 at Baseline in the population and treatment group (N).
Note: No imputation performed for missing data less than 10%.
Table 4-23: Proportion of Subjects Achieving a Category of 6 or Higher on the Ordinal Scale at Day 28 - Ordinal Scale 2 at Baseline, > 65 years, mITT Population
| Visit |
Statistic | Leronlimab 700 mg N=14 |
Placebo N=4 |
Odds Ratio | 95% CI | |||||||
| Day 28 |
Responders, n (%) | 3 (21.4%) | NA | NA | ||||||||
| Non-Responders, n (%) | 11 (78.6%) | 4 (100%) | ||||||||||
Note: Responders refer to subjects who achieved a category of 6 or higher at Day 28.
Note: Logistic model adjusted for stratification factor based on non-missing observed data
Note: All percentages are based on the number of subjects with Ordinal Scale of 2 at Baseline in the population and treatment group (N).
Note: No imputation performed for missing data less than 10%.
Table 4-24: Proportion of Subjects Achieving a Category of 6 or Higher on the Ordinal Scale at Day 28 - Ordinal Scale 2 at Baseline, £ 65 years, mITT Population
| Visit |
Statistic |
Leronlimab 700 mg N=29 |
Placebo N=15 |
Odds Ratio | 95% CI | |||||
| Responders, n (%) |
9 (31.0%) | 2 (13.3%) | 4.092 | ( 0.69,24.32) | ||||||
| Day 28 |
Non-Responders, n (%) |
16 (55.2%) | 12 (80.0%) | |||||||
| Missing, n (%) |
4 (13.8%) | 1 (6.7%) |
Note: Responders refer to subjects who achieved a category of 6 or higher at Day 28.
Note: Logistic model adjusted for stratification factor based on non-missing observed data
Note: All percentages are based on the number of subjects with Ordinal Scale of 2 at Baseline in the population and treatment group (N).
Note: No imputation performed for missing data less than 10%.
| Confidential | Page 34 of 42 |
|
|
Leronlimab (PRO 140) CD12_COVID-19 Executive Summary |
Table 4-25: Summary of Change in Clinical Status (on a 7 point ordinal scale) at Day 28 - Rank ANCOVA, mITT Population
| (A) | No Imputation, Missing as Missing |
| Leronlimab 700 mg N=259 |
Placebo N=125 | |||||||||
| Visit |
Statistic | Result | Change from Baseline [1] |
Result | Change from Baseline [1] | |||||
| n | 259 | 125 | ||||||||
| Mean (SD) | 3.2 (0.68) | 3.2 (0.70) | ||||||||
| Baseline |
Median | 3 | 3 | |||||||
| Min-Max | 2.0 - 4.0 | 2.0 - 5.0 | ||||||||
| n | 220 | 220 | 106 | 106 | ||||||
| Mean (SD) | 4.6 (2.49) | 1.5 (2.36) | 4.4 (2.46) | 1.2 (2.27) | ||||||
| Day 28 |
Median | 6 | 3 | 6 | 2 | |||||
| Min-Max | 1.0 - 7.0 | -3.0 - 5.0 | 1.0 - 7.0 | -3.0 - 4.0 | ||||||
Note: Rank ANCOVA model adjusted for stratification factor and age based on non-missing observed data
[1] Baseline is the last available value before treatment. Change from baseline is based on patients with paired values.
(B) Multiple Imputation, Rank ANCOVA Method
| Leronlimab 700 mg | Placebo | |||||||||
| N=259 | N=125 | |||||||||
| Visit |
Statistic | Result | Change from Baseline [1] |
Result | Change from Baseline [1] | |||||
| n | 259 | 125 | ||||||||
| Mean (SD) | 3.2 (0.68) | 3.2 (0.70) | ||||||||
| Baseline |
Median | 3 | 3 | |||||||
| Min-Max | 2.0 - 4.0 | 2.0 - 5.0 | ||||||||
| n | 259 | 259 | 125 | 125 | ||||||
| Mean (SD) | 4.7 (2.35) | 1.5 (2.25) | 4.6 (2.37) | 1.4 (2.18) | ||||||
| Day 28 |
Median | 6.0 | 2.0 | 6.0 | 2.0 | |||||
| Min-Max | 1.0 - 7.0 | -3.0 - 5.0 | 1.0 - 7.0 | -3.0 - 4.2 | ||||||
Note: Rank ANCOVA model adjusted for stratification factor and age based on non-missing observed data
[1] Baseline is the last available value before treatment. Change from baseline is based on patients with paired values.
| Confidential | Page 35 of 42 |
|
|
Leronlimab (PRO 140) CD12_COVID-19 Executive Summary |
Table 4-26: Summary of Change in Clinical Status (on a 7 point ordinal scale) at Day 28 - Rank ANCOVA, > 65 years, mITT Population
(A) No Imputation, Missing as Missing
| Leronlimab 700 mg | Placebo | |||||||||
| N=88 | N=29 | |||||||||
| Result | Change from Baseline [1] |
Result | Change from Baseline [1] | |||||||
| Visit |
Statistic | |||||||||
| n | 88 | 29 | ||||||||
| Mean (SD) | 3.2 (0.68) | 3.1 (0.62) | ||||||||
| Baseline |
Median | 3.0 | 3.0 | |||||||
| Min-Max | 2.0 - 4.0 | 2.0 - 4.0 | ||||||||
| n | 77 | 77 | 27 | 27 | ||||||
| Mean (SD) | 3.3 (2.57) | 0.2 (2.46) | 3.1 (2.30) | -0.0 (2.34) | ||||||
| Day 28 |
Median | 2.0 | -1.0 | 2.0 | -1.0 | |||||
| Min-Max | 1.0 - 7.0 | -3.0 - 4.0 | 1.0 - 7.0 | -3.0 - 4.0 | ||||||
Note: Rank ANCOVA model adjusted for stratification factor based on non-missing observed data
[1] Baseline is the last available value before treatment. Change from baseline is based on patients with paired values.
(B) Multiple Imputation, Rank ANCOVA Method
| Leronlimab 700 mg | Placebo | |||||||||
| N=88 | N=29 | |||||||||
| Result | Change from Baseline [1] |
Result | Change from Baseline [1] | |||||||
| Visit |
Statistic | |||||||||
| n | 88 | 29 | ||||||||
| Mean (SD) | 3.2 (0.68) | 3.1 (0.62) | ||||||||
| Baseline |
Median | 3.0 | 3.0 | |||||||
| Min-Max | 2.0 - 4.0 | 2.0 - 4.0 | ||||||||
| n | 88 | 88 | 29 | 29 | ||||||
| Mean (SD) | 3.6 (2.50) | 0.4 (2.37) | 3.3 (2.35) | 0.2 (2.40) | ||||||
| Day 28 |
Median | 3.3 | 0.0 | 4.0 | 1.0 | |||||
| Min-Max | 1.0 - 7.0 | -3.0 - 4.0 | 1.0 - 7.0 | -3.0 - 4.0 | ||||||
Note: Rank ANCOVA model adjusted for stratification factor based on non-missing observed data
[1] Baseline is the last available value before treatment. Change from baseline is based on patients with paired values.
| Confidential | Page 36 of 42 |
|
|
Leronlimab (PRO 140) CD12_COVID-19 Executive Summary |
Table 4-27: Summary of Change in Clinical Status (on a 7 point ordinal scale) at Day 28 - Rank ANCOVA, £ 65 years, mITT Population
| (A) | No Imputation, Missing as Missing |
| Leronlimab 700 mg | Placebo | |||||||||
| N=171 | N=96 | |||||||||
| Result | Change from Baseline [1] |
Result | Change from Baseline [1] | |||||||
| Visit |
Statistic | |||||||||
| n | 171 | 96 | ||||||||
| Mean (SD) | 3.2 (0.69) | 3.3 (0.73) | ||||||||
| Baseline |
Median | 3.0 | 3.0 | |||||||
| Min-Max | 2.0 - 4.0 | 2.0 - 5.0 | ||||||||
| n | 143 | 143 | 79 | 79 | ||||||
| Mean (SD) | 5.2 (2.18) | 2.1 (2.02) | 4.9 (2.36) | 1.7 (2.09) | ||||||
| Day 28 |
Median | 6.0 | 3.0 | 6.0 | 3.0 | |||||
| Min-Max | 1.0 - 7.0 | -3.0 - 5.0 | 1.0 - 7.0 | -3.0 - 4.0 | ||||||
Note: Rank ANCOVA model adjusted for stratification factor based on non-missing observed data
[1] Baseline is the last available value before treatment. Change from baseline is based on patients with paired values.
(B) Multiple Imputation, Rank ANCOVA Method
| Leronlimab 700 mg | Placebo | |||||||||
| N=171 | N=96 | |||||||||
| Result | Change from Baseline [1] |
Result | Change from Baseline [1] | |||||||
| Visit |
Statistic | |||||||||
| n | 171 | 96 | ||||||||
| Mean (SD) | 3.2 (0.69) | 3.3 (0.73) | ||||||||
| Baseline |
Median | 3.0 | 3.0 | |||||||
| Min-Max | 2.0 - 4.0 | 2.0 - 5.0 | ||||||||
| n | 171 | 171 | 96 | 96 | ||||||
| Mean (SD) | 5.3 (2.05) | 2.1 (1.92) | 5.1 (2.24) | 1.8 (1.99) | ||||||
| Day 28 |
Median | 6.0 | 3.0 | 6.0 | 2.9 | |||||
| Min-Max | 1.0 - 7.0 | -3.0 - 5.0 | 1.0 - 7.0 | -3.0 - 4.6 | ||||||
Note: Rank ANCOVA model adjusted for stratification factor based on non-missing observed data
[1] Baseline is the last available value before treatment. Change from baseline is based on patients with paired values.
| Confidential | Page 37 of 42 |
|
|
Leronlimab (PRO 140) CD12_COVID-19 Executive Summary |
Table 4-28: Summary of Change in Clinical Status (on a 7 point ordinal scale) at Day 28 - Ordinal Scale 2 at Baseline, Rank ANCOVA, mITT Population
| Leronlimab 700 mg | Placebo | |||||||||
| N=43 | N=19 | |||||||||
| Result | Change from Baseline [1] |
Result | Change from Baseline [1] | |||||||
| Visit |
Statistic | |||||||||
| n | 43 | 19 | ||||||||
| Mean (SD) | 2.0 (0.00) | 2.0 (0.00) | ||||||||
| Baseline |
Median | 2.0 | 2.0 | |||||||
| Min-Max | 2.0 – 2.0 | 2.0 – 2.0 | ||||||||
| n | 39 | 39 | 18 | 18 | ||||||
| Mean (SD) | 3.4 (2.29) | 1.4 (2.29) | 2.6 (1.75) | 0.6 (1.75) | ||||||
| Day 28 |
Median | 2.0 | 0.0 | 2.0 | 0.0 | |||||
| Min-Max | 1.0 - 7.0 | -1.0 - 5.0 | 1.0 - 6.0 | -1.0 - 4.0 | ||||||
[1] Baseline is the last available value before treatment. Change from baseline is based on patients with paired values.
Note: Rank ANCOVA model adjusted for stratification factor and age based on non-missing observed data
Note: No imputation performed for missing data less than 10%.
Table 4-29: Summary of Change in Clinical Status (on a 7 point ordinal scale) at Day 28 - Ordinal Scale 2 at Baseline, > 65 years, Rank ANCOVA, mITT Population
| Leronlimab 700 mg | Placebo | |||||||||
| N=14 | N=4 | |||||||||
| Result | Change from Baseline [1] |
Result | Change from Baseline [1] | |||||||
| Visit |
Statistic | |||||||||
| n | 14 | 4 | ||||||||
| Mean (SD) | 2.0 (0.00) | 2.0 (0.00) | ||||||||
| Baseline |
Median | 2.0 | 2.0 | |||||||
| Min-Max | 2.0 - 2.0 | 2.0 - 2.0 | ||||||||
| n | 14 | 14 | 4 | 4 | ||||||
| Mean (SD) | 2.2 (2.08) | 0.2 (2.08) | 1.8 (1.50) | -0.3 (1.50) | ||||||
| Day 28 |
Median | 1.0 | -1.0 | 1.0 | -1.0 | |||||
| Min-Max | 1.0 - 6.0 | -1.0 - 4.0 | 1.0 - 4.0 | -1.0 - 2.0 | ||||||
[1] Baseline is the last available value before treatment. Change from baseline is based on patients with paired values.
Note: Rank ANCOVA model adjusted for stratification factor based on non-missing observed data
Note: No imputation performed for missing data less than 10%.
| Confidential | Page 38 of 42 |
|
|
Leronlimab (PRO 140) CD12_COVID-19 Executive Summary |
Table 4-30: Summary of Change in Clinical Status (on a 7 point ordinal scale) at Day 28 - Ordinal Scale 2 at Baseline, £ 65 years, Rank ANCOVA, mITT Population
| Leronlimab 700 mg | Placebo | |||||||||
| N=29 | N=15 | |||||||||
| Result | Change from Baseline [1] |
Result | Change from Baseline [1] | |||||||
| Visit |
Statistic | |||||||||
| n | 29 | 15 | ||||||||
| Mean (SD) | 2.0 (0.00) | 2.0 (0.00) | ||||||||
| Baseline |
Median | 2.0 | 2.0 | |||||||
| Min-Max | 2.0 - 2.0 | 2.0 - 2.0 | ||||||||
| n | 25 | 25 | 14 | 14 | ||||||
| Mean (SD) | 4.1 (2.15) | 2.1 (2.15) | 2.9 (1.79) | 0.9 (1.79) | ||||||
| Day 28 |
Median | 4.0 | 2.0 | 2.5 | 0.5 | |||||
| Min-Max | 1.0 - 7.0 | -1.0 - 5.0 | 1.0 - 6.0 | -1.0 - 4.0 | ||||||
[1] Baseline is the last available value before treatment. Change from baseline is based on patients with paired values.
Note: Rank ANCOVA model adjusted for stratification factor based on non-missing observed data
Note: No imputation performed for missing data less than 10%.
| Confidential | Page 39 of 42 |
|
|
Leronlimab (PRO 140) CD12_COVID-19 Executive Summary |
Table 4-31: Summary of Length of Hospital Stay (Days), mITT Population
| Leronlimab 700 mg | Placebo | P-Value [1] | ||||||
| Category |
Statistic |
N=259 | N=125 | |||||
| n | 259 | 125 | ||||||
| Length of Hospital Stay (Days) |
Mean (SD) | 21.4 (15.9) | 21.4 (16.3) | |||||
| Median | 15.0 | 14.0 | 0.2733 | |||||
| Min-Max | 1.0 - 45.0 | 1.0 - 46.0 |
Note: Based on the number of subjects in the mITT population and treatment group (N).
[1] p-value is from the rank-ANCOVA model adjusted for stratification factor and age.
Note: No imputation performed for missing data less than 10%.
Table 4-32: Summary of Length of Hospital Stay (Days), > 65 years, mITT Population
| Leronlimab 700 mg | Placebo | P-Value [1] | ||||||
| Category |
Statistic |
N=88 | N=29 | |||||
| n | 88 | 29 | ||||||
| Length of Hospital Stay (Days) |
Mean (SD) | 28.0 (15.9) | 31.1 (14.6) | |||||
| Median | 41.0 | 42.0 | 0.3266 | |||||
| Min-Max | 2.0 - 43.0 | 6.0 - 43.0 |
Note: Based on the number of subjects in the mITT population and treatment group (N).
[1] p-value is from the rank-ANCOVA model adjusted for stratification factor.
Note: No imputation performed for missing data less than 10%.
Table 4-33: Summary of Length of Hospital Stay (Days), £ 65 years, mITT Population
| Leronlimab 700 mg | Placebo | P-Value [1] | ||||||
| Category |
Statistic |
N=171 | N=96 | |||||
| n | 171 | 96 | ||||||
| Length of Hospital Stay (Days) |
Mean (SD) | 18.0 (14.8) | 18.4 (15.7) | |||||
| Median | 11.0 | 11.0 | 0.5868 | |||||
| Min-Max | 1.0 - 45.0 | 1.0 - 46.0 |
Note: Based on the number of subjects in the mITT population and treatment group (N).
[1] p-value is from the rank-ANCOVA model adjusted for stratification factor.
Note: No imputation performed for missing data less than 10%.
| Confidential | Page 40 of 42 |
|
|
Leronlimab (PRO 140) CD12_COVID-19 Executive Summary |
Table 4-34: Summary of Length of Hospital Stay (Days) - Ordinal Scale 2 at Baseline, mITT Population
| Category |
Statistic | Leronlimab 700 mg N=43 |
Placebo N=19 |
P-Value [1] | ||||
| n | 43 | 19 | ||||||
| Length of Hospital Stay (Days) |
Mean (SD) | 33.0 (10.7) | 38.5 (7.60) | |||||
| Median | 40.0 | 42.0 | 0.0050 | |||||
| Min-Max | 9.0 - 45.0 | 20.0 - 46.0 |
Note: Based on the number of subjects with Ordinal Scale of 2 at Baseline in the population and treatment group (N).
[1] p-value is from the rank-ANCOVA model adjusted for stratification factor and age.
Note: No imputation performed for missing data less than 10%.
Table 4-35: Summary of Length of Hospital Stay (Days) - Ordinal Scale 2 at Baseline, > 65 years, mITT Population
| Category |
Statistic | Leronlimab 700 mg N=14 |
Placebo N=4 |
P-Value [1] | ||||
| n | 14 | 4 | ||||||
| Length of Hospital Stay (Days) |
Mean (SD) | 37.1 (10.0) | 41.8 (0.50) | |||||
| Median | 42.0 | 42.0 | 0.9806 | |||||
| Min-Max | 10.0 - 42.0 | 41.0 - 42.0 |
Note: Based on the number of subjects with Ordinal Scale of 2 at Baseline in the population and treatment group (N).
[1] p-value is from the rank-ANCOVA model adjusted for stratification factor.
Note: No imputation performed for missing data less than 10%.
Table 4-36: Summary of Length of Hospital Stay (Days) - Ordinal Scale 2 at Baseline, £ 65 years, mITT Population
| Category |
Statistic | Leronlimab 700 mg N=29 |
Placebo N=15 |
P-Value [1] | ||||
| n | 29 | 15 | ||||||
| Length of Hospital Stay (Days) |
Mean (SD) | 30.9 (10.6) | 37.7 (8.39) | |||||
| Median | 30.0 | 42.0 | 0.0060 | |||||
| Min-Max | 9.0 - 45.0 | 20.0 - 46.0 |
Note: Based on the number of subjects with Ordinal Scale of 2 at Baseline in the population and treatment group (N).
[1] p-value is from the rank-ANCOVA model adjusted for stratification factor.
Note: No imputation performed for missing data less than 10%.
| Confidential | Page 41 of 42 |
|
|
Leronlimab (PRO 140) CD12_COVID-19 Executive Summary |
Table 4-37: Overview of Adverse Events, Safety Population
| Leronlimab 700 mg | Placebo | |||||||
| Parameter |
N=259 n(%) |
Events | N=125 n(%) |
Events | ||||
| Subjects with ³ 1 AE |
142 (54.8) | 555 | 77 (61.6) | 337 | ||||
| Subjects with ³ 1 SAE |
99 (38.2) | 197 | 47 (37.6) | 98 | ||||
| By Severity |
||||||||
| Subjects with ³ 1 AE Leading to Death |
59 (22.8) | 59 | 31 (24.8) | 31 | ||||
| Subjects with ³ 1 Life-Threatening AE |
17 (6.6) | 83 | 8 (6.4) | 41 | ||||
| Subjects with ³ 1 Severe AE |
24 (9.3) | 158 | 11 (8.8) | 93 | ||||
| By Causality |
||||||||
| Subjects with ³ 1 Probably Related AE |
1 (0.4) | 1 | 0 (0.0) | 0 | ||||
| Subjects with ³ 1 Possibly Related AE |
8 (3.1) | 8 | 9 (7.2) | 16 | ||||
| By Outcome |
||||||||
| Subjects with ³ 1 AE Leading to Drug Withdrawal |
1 (0.4) | 1 | 1 (0.8) | 1 | ||||
Note: All percentages are based on the number of subjects in the safety population and treatment group (N).
Note: A subject is counted only once within each category, using the event with the worst-case intensity (by severity) or relationship (by causality).
Table 4-38: Overview of Adverse Events, Critical Population
| Leronlimab 700 mg | Placebo | |||||||
| Parameter |
N=43 n(%) |
Events | N=19 n(%) |
Events | ||||
| Subjects with ³ 1 AE |
34 (79.1) | 186 | 15 (78.9) | 96 | ||||
| Subjects with ³ 1 SAE |
24 (55.8) | 43 | 14 (73.7) | 30 | ||||
| AEs By Severity |
||||||||
| Subjects with ³ 1 AE Leading to Death |
12 (27.9) | 12 | 9 (47.4) | 9 | ||||
| Subjects with ³ 1 Life-Threatening AE |
10 (23.3) | 23 | 2 (10.5) | 8 | ||||
| Subjects with ³ 1 Severe AE |
4 (9.3) | 55 | 3 (15.8) | 39 | ||||
| Subjects with ³ 1 Moderate AE |
5 (11.6) | 62 | 1 (5.3) | 25 | ||||
| Subjects with ³ 1 Mild AE |
3 (7.0) | 34 | 0 (0.0) | 15 | ||||
| AEs By Causality |
||||||||
| Subjects with ³ 1 Possibly Related AE |
3 (7.0) | 3 | 1 (5.3) | 3 | ||||
| Subjects with ³ 1 Remotely Related AE |
0 (0.0) | 9 | 0 (0.0) | 0 | ||||
| Subjects with ³ 1 Unrelated AE |
31 (72.1) | 174 | 14 (73.7) | 93 | ||||
| AEs By Outcome |
||||||||
| Subjects with ³ 1 AE That Led To Study Treatment Discontinuation |
0 (0.0) | 0 | 1 (5.3) | 1 | ||||
Note: All percentages are based on the number of subjects in the critical population and treatment group (N) with ordinal scale baseline of 2.
Note: A subject is counted only once within each category using the event with the worst-case intensity (by severity) or relationship (by causality).
| Confidential | Page 42 of 42 |