UNITED STATES
SECURITIES AND EXCHANGE COMMISSION
WASHINGTON, D.C. 20549
FORM 10-K
|
| |
x | ANNUAL REPORT PURSUANT TO SECTION 13 OR 15(d) OF THE SECURITIES EXCHANGE ACT OF 1934 |
| For the fiscal year ended December 31, 2016 |
OR |
| |
o | TRANSITION REPORT PURSUANT TO SECTION 13 OR 15(d) OF THE SECURITIES EXCHANGE ACT OF 1934 |
| FOR THE TRANSITION PERIOD FROM __________ TO ________ |
COMMISSION FILE NUMBER 001-35176
GLOBAL EAGLE ENTERTAINMENT INC.
(Exact name of registrant as specified in its charter)
|
| | |
Delaware | | 27-4757800 |
(State or other jurisdiction of incorporation or organization) | | (I.R.S. Employer Identification Number) |
| | |
6100 Center Drive, Suite 1020 | | |
Los Angeles, California | | 90045 |
(Address of principal executive offices) | | (Zip Code) |
Registrant’s telephone number, including area code: (310) 437-6000
Securities registered pursuant to Section 12(b) of the Act: |
| |
Title of each class Common Stock, $0.0001 par value | Name of each exchange on which registered The Nasdaq Stock Market LLC |
Securities registered pursuant to Section 12(g) of the Act: |
None |
Indicate by check mark if the registrant is a well-known seasoned issuer, as defined in Rule 405 of the Securities Act. Yes o No x
Indicate by check mark if the registrant is not required to file reports pursuant to Section 13 or Section 15(d) of the Act. Yes o No x
Indicate by check mark whether the registrant (1) has filed all reports required to be filed by Section 13 or 15(d) of the Securities Exchange Act of 1934 during the preceding 12 months (or for such shorter period that the registrant was required to file such reports) and (2) has been subject to such filing requirements for the past 90 days. Yes o No x
Indicate by check mark whether the registrant has submitted electronically and posted on its corporate Website, if any, every Interactive Data File required to be submitted and posted pursuant to Rule 405 of Regulation S-T during the preceding 12 months (or for such shorter period that the registrant was required to submit and post such files). Yes o No x
Indicate by check mark if disclosure of delinquent filers pursuant to Item 405 of Regulation S-K (Section 229.405 of this chapter) is not contained herein, and will not be contained, to the best of registrant’s knowledge, in definitive proxy or information statements incorporated by reference in Part III of this Form 10-K or any amendment to this Form 10-K. o
Indicate by check mark whether the registrant is a large accelerated filer, an accelerated filer, a non-accelerated filer, or a smaller reporting company. See the definitions of “large accelerated filer,” “accelerated filer” and “smaller reporting company” in Rule 12b-2 of the Exchange Act. (Check one):
|
| | | | | | |
Large accelerated filer o | | Accelerated filer x | | Non-accelerated filer o | | Smaller reporting company o |
| | | | | | Emerging growth company o |
If an emerging growth company, indicate by check mark if the registrant has elected not to use the extended transition period for complying with any new or revised financial accounting standards provided pursuant to Section 13(a) of the Exchange Act. o
Indicate by check mark whether the registrant is a shell company (as defined in Rule 12b-2 of the Act). Yes o No x
The aggregate market value of the common stock held by non-affiliates of the registrant, computed as of June 30, 2016 (the last business day of the registrant’s most recently completed second fiscal quarter), was approximately $358,476,462.
As of October 31, 2017, there were 90,743,565 shares of the registrant’s common stock issued and outstanding (excluding 3,053,634 shares of common stock held by a wholly-owned subsidiary of the registrant).
DOCUMENTS INCORPORATED BY REFERENCE
None.
GLOBAL EAGLE ENTERTAINMENT INC.
INDEX TO FORM 10-K
YEAR ENDED DECEMBER 31, 2016
|
| | | | |
Item No. | | Description | | Page |
| | | | |
| | | | |
| | | | |
| | | | |
| | | | |
| | | | |
| | | | |
| | | | |
| | | | |
| | | | |
| | | | |
| | | | |
| | | | |
| | | | |
| | | | |
| | | | |
| | | | |
| | | | |
| | | | |
| | | | |
| | | | |
| | | | |
| | | | |
| | | | |
| | | | |
| | | | |
| | | | |
| | | | |
| | | | |
| | | | |
| | | | |
| | | | |
| | | | |
| | | | |
PART I
INTRODUCTORY NOTE
As used herein, “Global Eagle Entertainment,” “Global Eagle,” “GEE,” the “Company,” “our,” “we,” or “us” and similar terms include Global Eagle Entertainment Inc. and its subsidiaries, unless the context indicates otherwise.
As previously reported, we were unable to timely file our Annual Report on Form 10-K for our fiscal year ended December 31, 2016 (this “Form 10-K”) and our Quarterly Reports on Form 10-Q for the quarters ended March 31, 2017 (the “Q1 Form 10-Q”), June 30, 2017 (the “Q2 Form 10-Q”) and September 30, 2017 (the “Q3 Form 10-Q”). We required additional time to file this Form 10-K due to our increased size and complexity following our acquisition of Emerging Markets Communications (“EMC”) in July 2016, and the effect of that increased size and complexity on our financial reporting processes; our need to transition our finance function after the departures of our Chief Executive Officer, Chief Financial Officer and Chief Accounting Officer; and our need to complete additional financial-closing procedures associated with our material weaknesses in internal control over financial reporting, as are described in Part II, Item 9A. Controls and Procedures of this Form 10-K. We were unable to timely file our Q1 Form 10-Q, Q2 Form 10-Q and Q3 Form 10-Q because they must include balance-sheet information that will be derived from the audited financial statements included herein, and also must include unaudited financial statements that we were unable to finalize until we finalized our audited financial statements for the year ended December 31, 2016. The Company expects to file the Q1 Form 10-Q, Q2 Form 10-Q and Q3 Form 10-Q on or prior to January 2, 2018.
Notwithstanding the material weaknesses discussed under Part II, Item 9A. Controls and Procedures of this Form 10-K and based upon our internal accounting review and the independent review of our Audit Committee, our management has concluded that our consolidated financial statements included in this Form 10-K are fairly stated in all material respects in accordance with accounting principles generally accepted in the United States (“GAAP”).
Except for the discussion of our operating segments in Part I as described below and as otherwise specifically set forth herein, the information contained in this Form 10-K is presented as of December 31, 2016 and the fiscal year then ended and does not reflect events or results of operations that have occurred subsequent to December 31, 2016.
Our Operating Segments
We discuss our business and operations in Part I of this Form 10-K (including Item 1. Business and Item 1A. Risk Factors) as comprising two operating segments: Media & Content and Connectivity. For fiscal years 2014, 2015 and 2016 until our acquisition of Emerging Markets Communications, LLC (“EMC”) in July 2016 (the “EMC Acquisition”), our business consisted of two operating segments: Content and Connectivity. Following the EMC Acquisition, the acquired EMC business became our third operating segment, which we called Maritime & Land Connectivity, and we renamed our other two segments as Media & Content and Aviation Connectivity. In the second quarter of 2017, following changes in our senior management (including our chief operating decision maker) and organizational changes across our business, we reorganized our business from three operating segments back into two operating segments, Media & Content and Connectivity, primarily through integrating the business and operations of our former Aviation Connectivity segment with that of our former Maritime & Land Connectivity segment. Our chief operating decision maker determined this was appropriate based on the similarities and synergies between these two segments relating to satellite bandwidth and equipment used in those businesses as well as on our restructured reporting lines across all of our business departments. Notwithstanding the discussion in Part I of this Form 10-K of our business as comprising two segments, other parts of this Form 10-K, including Item 7. Management’s Discussion and Analysis of Financial Condition and Results of Operations and our audited financial statements included in Item 15. Exhibits and Financial Statement Schedules, discuss our business and present financial information on the basis of three operating segments, as noted above, which were in effect as of December 31, 2016. In addition, the financial results reported for fiscal years 2014, 2015 and 2016 reflect the three operating segments in effect as of December 31, 2016 and do not reflect the subsequent changes to our operating segments. See below and Note 16. Segment Information to our consolidated financial statements included in Item 15. Exhibits and Financial Statement Schedules for further discussion of our operating segments.
Cautionary Note Regarding Forward-Looking Statements
We make forward-looking statements in this Form 10-K and the documents incorporated by reference herein within the meaning of the “safe harbor” provisions of the Private Securities Litigation Reform Act of 1995. These forward-looking statements relate to expectations or forecasts for future events, including without limitation our earnings, revenue, expenses or other future financial or business performance or strategies, or the impact of legal or regulatory matters on our business, results of operations or financial condition. These statements may be preceded by, followed by or include the words “may,” “might,” “will,” “will likely
result,” “should,” “would,” “estimate,” “plan,” “project,” “forecast,” “intend,” “expect,” “anticipate,” “believe,” “seek,” “continue,” “target” or similar expressions.
These forward-looking statements are based on information available to us as of the date of this Form 10-K and on our current expectations, forecasts and assumptions, and involve substantial risks and uncertainties. Actual results may vary materially from those expressed or implied by the forward-looking statements herein due to a variety of factors, including those discussed under “Risk Factors,” “Quantitative and Qualitative Disclosures about Market Risk,” and “Management’s Discussion and Analysis” in this Form 10-K, which are incorporated herein by reference. Forward-looking statements speak only as of the date the statements are made. You should not put undue reliance on any forward-looking statements. We assume no obligation to update forward-looking statements except to the extent required by applicable securities laws. If in the future we do update one or more forward-looking statements, no inference should be drawn that we will make additional updates with respect to those or other forward-looking statements.
ITEM 1. BUSINESS
Overview
Global Eagle is a leading provider of satellite-based connectivity and media to fast-growing, global enterprise, consumer and government markets across aviation, maritime and land. Supported by proprietary and best-in-class technologies, Global Eagle entertains, informs and connects travelers and crew with our integrated suite of rich media content and seamless connectivity solutions that cover the globe. Global Eagle delivers exceptional service and rapid support to a diverse base of customers around the world. Our business currently consists of two operating segments: Connectivity and Media & Content. The discussion in this Part I, as well as under the heading “Risk Factors,” reflects these two operating segments. However, our financial results reported for fiscal years 2014, 2015 and 2016, and the discussion elsewhere in this Form 10-K, reflects our three operating segments that were in effect as of December 31, 2016. See “Introductory Note—Our Operating Segments.”
Connectivity. Our Connectivity segment provides satellite-based connectivity services to enterprise and government customers in the aviation, maritime and land vertical markets. We provide:
| |
• | Wi-Fi connectivity (utilizing specialized network equipment and technology) that enables access to the Internet, live television, texting services, e-commerce, on-demand content and travel-related information; and |
| |
• | Connectivity-enabled solutions for advertising, operational performance management and analytics that enable our customers to increase profitability through generation of new revenue streams and more efficient operations. |
Our Connectivity segment generates revenue primarily through the sale of Internet access, data, video, client-server applications, live television, advertising, operations solutions, sponsorships and other related services and network backhaul services, as well as equipment to support these services.
Media & Content. Our Media & Content segment buys, produces, manages, distributes and provides post-production services and wholly-owned and licensed media content, video and music programming, advertising, applications and video games for and to the airline, maritime and other “away from home” non-theatrical markets (also known as “mobility markets”). Our Media & Content segment generates revenue primarily through the licensing and management of owned and licensed media content, video and music programming, applications and video games to the mobility markets. Secondarily, our Media & Content segment generates revenue from providing value-added services such as selection, purchase, production, customer support, software development, creative services and technical editing and curating of media content in connection with the integration and servicing of entertainment programs as well as the sourcing of advertising from agencies and directly from brands for use in those markets.
Operating Segments
Connectivity
Our Connectivity segment provides our customers with satellite-based Internet access and Internet-enabled live television, on-demand content, texting services, e-commerce, travel-related information and backhaul solutions. We provide our customers and their passengers, crew and personnel with operational solutions and Wi-Fi connectivity primarily via C-band, Ka-band, Ku-band and Ku-band High Throughput Satellites (“Ku-HTS”) satellite transmissions. We obtain satellite coverage through various global satellite services providers, including Hughes Network Systems, LLC (“Hughes”), New Skies Satellites B.V. (“SES”), an affiliate of SES S.A., and Intelsat Corporation (“Intelsat”). Global Eagle operates a vertically integrated teleport and ground network
infrastructure that integrates leased satellite capacity from multiple satellite operators. We utilize proprietary performance-enhancing technologies to increase the efficiency of our network with patented software that increases end-user quality of experience.
Our Connectivity segment connects aircraft, vessels and fixed ground stations to orbiting satellites which link data to ground earth stations. Our ground earth stations are connected by a terrestrial broadband network with fully-meshed Multiprotocol Label Switching (“MPLS”). Global Eagle develops integrates and sells, leases and/or provides a right to use proprietary third-party manufactured antenna systems (including at times as part of an equipment and services bundle) for connectivity customers.
Global Eagle pioneered the application of satellite-based connectivity in large airline fleets. Our aircraft Wi-Fi connectivity system was first deployed by a commercial airline in 2009, and our in-flight broadband services became fully operational in 2010. Following the completion of our licensed and operational in-flight broadband system in 2010, we commenced installation of our connectivity system equipment on Southwest Airlines Co. (“Southwest Airlines”) aircraft and began to generate revenue. As of September 30, 2017, Global Eagle provides live in-flight connectivity (“IFC”) services on 877 aircraft.
To expand into the maritime and land connectivity markets, Global Eagle acquired EMC in July 2016 (the “EMC Acquisition”). EMC was a communications services provider that delivered communications, Internet, live television, on-demand video, voice, and network backhaul services to land-based sites and marine vessels globally, and whose offerings have now been integrated into Global Eagle. As noted above, following the EMC Acquisition, EMC comprised our third operating segment, called Maritime & Land Connectivity, which we combined with our former Aviation Connectivity segment in the second quarter of 2017. During the fourth quarter of 2016, we recorded a $64.0 million charge related to the impairment of goodwill in this Maritime & Land Connectivity segment. This was as a result of reduced financial projections for the Maritime & Land Connectivity reporting unit, due to, among other things: lower than expected actual financial results from this business due to margin compression resulting from competition in our cellular backhaul land business in Africa, resulting in diminished financial performance relative to our original expectations; delayed new deal executions and slower than anticipated installations and upgrades, also resulting in diminished financial performance relative to our original expectations; and operational challenges in integrating a legacy EMC acquiree in 2015 into this reporting unit, resulting in delayed acquisition synergies. Given the foregoing, we determined there was greater uncertainty in achieving our prior financial projections and so applied a higher discount rate for purposes of our goodwill impairment analysis. The higher discount rate affected the fair value of the Maritime & Land Connectivity reporting unit.
In addition, for the quarter ended March 31, 2017, we expect to record an additional goodwill impairment charge of between $75.0 million and $80.0 million related to this reporting unit. This additional impairment is due to continuing challenges in the business operations at this segment as well as delay in realizing our expected synergies, which resulted in lower results than the projections as of December 31, 2016. We determined that there is a higher degree of uncertainty in achieving our financial projections and as such increased our discount rate, which reduced the fair value of the Maritime & Land Connectivity reporting unit. Also, the adoption of ASU 2017-04, Intangibles-Goodwill and Others (Topic 350): Simplifying the Test for Goodwill Impairment, changed the measurement of the goodwill impairment, which increased the impairment. We have not closed our books for any periods subsequent to December 31, 2016. As stated above, we expect to have a significant impairment during the quarter ended March 31, 2017, and we may have additional impairment charges in later periods after completing our impairment assessments for these periods.
Aviation Products and Services
Global Eagle offers satellite-based in-flight entertainment and connectivity solutions that provide cost-effective, high-performance IFC to global airlines. Our platform provides airlines with a single resource for global connectivity and the latest content and digital media solutions to entertain and engage passengers. At the same time, our platform provides airlines with the opportunity to differentiate and monetize their IFC offerings.
Airconnect
Our proprietary branded service, Airconnect, is available worldwide to meet the needs of the global airline industry. Through Airconnect, airline passengers can connect to the Internet through their personal Wi-Fi-enabled devices. Where permitted by government regulations, Airconnect can provide gate-to-gate connectivity. As a “white-label” provider of connectivity services, we provide our airline customers flexibility in how they want to brand and price the Airconnect service to their passengers. Our fee structure for satellite-based Internet service varies by airline and is customarily in the form of (i) a set fee for each enplaned
passenger, (ii) a fee based on the number of passengers using our services or (iii) a flat rate per installed aircraft. In order to utilize our connectivity services, we provide our airline customers with the following:
| |
• | Connectivity Equipment – We sell and lease equipment that enables our satellite-based services to operate on aircraft. Our equipment is generally shipped and sold as a single kit, with components of the kits separately priced for future ordering. Significant components of our equipment kits include the radome, antenna, modems, wireless access points and activation packages. Substantially all of our equipment is manufactured and warrantied by third-party manufacturers. Our antennas are proprietary to us in that we develop the specifications, and our third-party suppliers manufacture them exclusively for our use. |
| |
• | Regulatory Support – We obtain Supplemental Type Certificates (“STCs”), which are certificates issued when an applicant has received Federal Aviation Administration (“FAA”), European Aviation Safety Agency (“EASA”) or similar international regulatory approval to modify an aircraft from its original type certificate approval. An STC on a particular aircraft type enables our equipment to be installed on that aircraft type. We have STCs for installation on the Boeing 737, 757, 767, 777 and Airbus A320 aircraft families. As an alternative to STC-based installation, we also offer our equipment for factory installation (Boeing Line-fit) on Boeing 737-700, 737-800, 737-900 and the Boeing 737 MAX family. |
| |
• | Post-Installation Support – Once our equipment is installed and operational, we provide technical and network support and management services, including 24/7 operational assistance and monitoring of each aircraft’s connectivity performance and bandwidth of our satellite-based services. |
In addition, we intend in the future to provide our airline customers with the following additional offerings:
| |
• | Airconnect Global® Antenna – In partnership with Quantenelektronische Systeme GmbH (“QEST”), the Company continues to develop a satellite antenna that would enable global usage of our services, including equatorial regions of the world (the “Global Antenna”). The Global Antenna’s innovative design features a first-of-its-kind three-axis precision pointing mechanism capable of delivering superior satellite connectivity and continuous coverage, including during flights near or below the equator, at high latitudes or during banking maneuvers. It is optimized to deliver airlines a breakthrough mix of reliability, high connection speeds and global coverage. The Global Antenna utilizes a revolutionary steerable pointing system to optimize coverage anywhere a commercial aircraft flies. The Global Antenna is compatible with our current installation architecture and STCs, and is also intended to meet the requirements for future line-fit installations. We expect to begin our first installations of this equipment in early 2018. |
| |
• | In late 2015, Global Eagle entered into an agreement with Hughes, the world's leading provider of broadband satellite solutions and services, to utilize Hughes's JUPITER™ System HT Aero Modem to power Global Eagle’s next-generation, high-performance broadband aviation service. Hughes's HT Aero Modem, including the core router module and JUPITER mobility technology, features the JUPITER System second-generation SoC (System on a Chip) that supports over 200 Mbps of throughput, readily accommodating the highest demands for aviation broadband. Compared to Hughes's prior-generation mobility terminal, the new HT modem delivers more than 10 times the throughput performance to an individual aircraft. Designed for the aviation broadband industry, the HT Aero Modem technology also provides faster spot beam and satellite switchover times. The modem is compatible with our antenna system, enabling an easy and cost-effective upgrade to improve speeds for our current connected fleet. We expect to begin our first installations of this equipment in early 2018. |
Airtime IFE
Our Airtime IFE system enables airline passengers to access a custom suite of IFE and connectivity solutions on their personal devices. Through an in-cabin Wi-Fi solution, the Airtime IFE system is a cost-effective, easy-to-install system that can replicate portions of the Airconnect IFE passenger experience without Airconnect system hardware. The Airtime IFE platform delivers content directly to all personal devices, including passenger laptops, tablets and smartphones utilizing Digital Rights Management technology to offer secured viewing of the latest Hollywood and international content.
The Airtime IFE solution also enables airlines to brand their IFE services through a customizable portal (user interface) that becomes the central platform for delivering entertainment in-flight. Airtime IFE offers a comprehensive lineup of world-class content for which airlines can determine access and pricing. The hardware required to power Airtime IFE consists of a server management unit and wireless routers installed on a plane. Media & Content can be refreshed wirelessly as often as an airline requires through our satellite network. Furthermore, our combined content, distribution and technology platforms provide airlines and millions of passengers worldwide with the industry’s most complete offering of IFE content and can deliver the most popular
content according to geographical and passenger demographics. News content and sports programming can be refreshed daily and delivered to a passenger via Airtime IFE’s near-live content capability.
Live Television Programming
In addition to Internet connectivity, we offer live television programming whereby airline passengers can watch a wide range of live television channels through their personal Wi-Fi-enabled devices. Our aviation live television services include a variety of programming options such as news channels, major broadcast networks, and sports and specialty cable network channels. We also offer a large selection of video-on-demand (“VOD”) content in connection with our live television channels. VOD enables customers to watch feature films or television content in-flight and over their personal Wi-Fi-enabled devices in exchange for a one-time fee.
Digital Media
We provide a number of value-added digital media services on our connected platforms. Through our Airtime and Airtime IFE products, we deliver a web-based portal for connected vessels that includes (i) VOD, (ii) digital advertising and sponsored content, (iii) interactive in-flight maps, destination and travel-related services and (iv) other relevant on-board applications such as Airgames, Airread, Airshop, Airmeal, Aircities and Airhealth. Portal services are generally subject to revenue sharing arrangements with our customers.
Our web portal offers our customers a fully customizable turn-key wireless entertainment experience, including multiple entertainment and connectivity options delivered directly to passengers’ devices. The web portal is white-labeled, enabling our customers to customize the home page with their own logo, language and branding.
Our core digital media products include the Airtime series of products:
| |
• | Airtime App: Our Airtime App is an innovative application that allows passengers to personalize their entertainment directly on their mobile devices. |
| |
• | Airtime Content-to-Go: Airtime Content-to-Go eliminates the need for airlines to install onboard hardware because it enables airlines to offer passengers a pre-flight download of digital media content. Passengers can download content as early as when they book a flight and the content remains locked until they board the plane, at which time they are able to view the purchased content. |
Maritime & Land Products and Services
Global Eagle provides connectivity services to land sites and serves cruise lines and ferries, yachts, oil and gas rigs, commercial shippers, enterprise locations in off-the-grid locations, government and military customers, and non-government organizations such as the United Nations. We provide land-based sites and marine vessels with a multimedia platform delivering broadband communications, Internet, live television, on-demand video, voice and backhaul services.
To service our marine and land-based customers, we operate a network of global field-support centers for installation and repair services. Our maritime and land products and services include:
| |
• | Connectivity – We provide global satellite bandwidth (C-Band, Ku-Band, and Ka-band), terrestrial broadband network, backhaul services, remote fiber network and fully meshed MPLS interconnected teleports. We provide capacity planning and management services and on-board revenue management. |
| |
• | Access – We provide worldwide access to live television, video (on-demand and subscription), backhaul services, Internet, voice, data, high-definition video conferencing and universal portals, including through use of our proprietary SpeedNet product that improves the web-browsing experience over a satellite connection by proactively storing web content close to the user. |
| |
• | Support – We have field support centers in several locations worldwide, several of which offer a spare parts inventory, a network operations center open 24/7, certified technicians, system integration and project management. These field centers provide third-party antenna and ship-based system integration, global installation support, and repair services. |
Since the EMC Acquisition, Global Eagle has continued to integrate our aviation, maritime and land connectivity operations to harmonize our programs and services across the mobility and off-the-grid market. In 2017, we substantially transitioned our aviation network operations into the teleport and ground network infrastructure acquired from EMC, which features a global, fully-
meshed MPLS interconnected teleport system, patented and proprietary performance-enhancing technologies (such as SpeedNet), a 120,000 square foot data center in Germany to serve Europe, the Middle East and Africa, traffic-routing and traffic prioritization, and gateways with 35 global Internet points of presence. We have also increased our maritime and land television, video and digital media services by cross-selling our IFE solutions to maritime and land markets in addition to aviation markets.
Media & Content
Our Media & Content segment is a market leader in the business of selecting, procuring, managing, encoding, and distributing video and music programming, and in providing e-readers and similar applications and games to the airline, maritime and other “away from home” non-theatrical markets. We deliver content compatible with our systems as well as compatible with a multitude of third-party IFE systems.
Our Media & Content segment’s operations are primarily focused on:
| |
• | acquiring non-theatrical licenses from major Hollywood, independent and international film and television producers and distributors, and marketing those rights to the airline, maritime and other non-theatrical markets; |
| |
• | making content available for non-theatrical systems and all associated services; |
| |
• | providing services ranging from the selection, purchase, post-production and technical adjustment of content to customer support in connection with the integration and servicing of non-theatrical programs; |
| |
• | providing ancillary revenue through advertising and sponsorship of airport lounge media, IFE, IFC and live broadcast insertion on multiple platforms; and |
| |
• | providing creative services such as user experience and user interface management on all IFE systems and the creation and production of special videos such as safety videos, destination guides and video promotions. |
Media & Content Products and Services
Movie and Audio Licensing and Distribution
Our Media & Content segment (through its predecessor acquired companies) has been providing movies and audio programming as well as technical services for over 30 years. We source a broad range of theatrical programs from worldwide producers and distributors including Warner Bros., NBC Universal, Twentieth Century Fox, CBS, Paramount, the BBC, Discovery, STX, Starz and The Walt Disney Company, as well as smaller international content providers. Our programmers identify content that is relevant and appropriate for each individual market. For some content, we act as a sole distributor on behalf of the content creator for the airline, maritime and other non-theatrical markets.
Live Television & Sporting Event Licensing and Distribution
Our Media & Content segment licenses live television content for distribution to aviation, maritime and land customers over Global Eagle and third-party satellite infrastructure. Global Eagle provides reliable and secure delivery of television content to more than 800 aircraft and 130 ships. Global Eagle licenses well-known channels and our own customized channels. Our portfolio currently includes CNN, ESPN, Disney Channel, Fox Sports, Fox News, USA Network, CNBC, BBC, NBC, and Bloomberg. In addition, we hold exclusive licenses for approximately 15,000 hours of sports and live event entertainment, including the NCAA, the AFL, the AFC Champions League, International Cricket Council, and the Emirates Australian Open, for distribution to aviation and maritime customers.
Technical Services and Digital Production Solutions
Our Media & Content segment addresses a variety of technical customer needs relating to content regardless of the particular IFE system being used. We provide comprehensive support for a broad-range of traditional, new and emerging technologies. Our technical services, which include encoding, editing and meta-data services, are performed in-house in our technical facilities in Singapore, India, the United Kingdom and California. These technical facilities also enable us to provide a full range of tailored digital production solutions including corporate videos, safety videos, animated video content, podcasts and broadcast-quality radio shows. We maintain a robust global digital network that allows us to transfer a wide range of file formats to our customers in minutes. We also support analog systems for customers running on older “legacy” systems, and can advise on “plug and play” replacement hardware to assist our customers in implementing more cost-effective IFE hardware solutions. We can adapt content
and databases to be compatible with a broad-range of devices and delivery methods, including tablets, streaming video, iOS, Android and others. We have also negotiated licensing agreements with both domestic and international rights holders for the use of materials on portable electronic devices.
Graphical User Interfaces
Our capabilities in Media & Content also include the development of graphical user interfaces for a variety of IFE applications, database management related to the overall management of IFE and both the technical integration of content and the operation of the varied content management systems found on aircraft and vessels across the globe.
Software and Gaming
We have a strong position in the international in-flight gaming content market. Our creative teams produce casual games customized to suit the in-flight environment. We also acquire multi-year licenses from reputable game publishers to adapt third-party-branded games and concepts for in-flight use from partners such as The Walt Disney Company, Electronic Arts Inc., PopCap Games, Rovio Entertainment, The Tetris Company, Bandai Namco Entertainment, Dorling Kindersley and Berlitz Corporation. Our Media & Content services include adapting the software and games we deliver to the language and cultural specificities of each customer's passenger demographics. In addition, our Media & Content business develops software applications for the next generation of IFE systems, including interactive electronic menus and magazines.
Advertising Sales
We work with advertising agencies and directly with brands to source advertising for use in the airline media market. The advertising is placed on inflight TV, inflight Wi-Fi portals, live TV streams as well as premium lounges at airports.
Customers
We provide our Connectivity services worldwide to the aviation, maritime and land markets, with customers located in North America, the Caribbean, Asia, the Middle East, Africa, South America and Europe. For fiscal years 2016, 2015 and 2014, our largest Connectivity customer was Southwest Airlines, which represented approximately 22%, 23% and 24% of our total consolidated revenue, respectively.
We provide content-curating, management and processing services to the airline, maritime, and non-theatrical industries globally. Our customers also include major Hollywood and international studios.
Other than Southwest Airlines as noted above, no other single customer in our Connectivity or Media & Content segment constituted more than 10% of our total consolidated revenue in 2016.
Competitive Advantages
Connectivity
Our satellite-based broadband services allow us to connect our customers to the Internet and deliver live-streaming television, on-demand content, texting services, shopping and other related services over land and sea. Unlike certain peer technologies, our satellite Wi-Fi platform is capable of being operated gate-to-gate (where government regulations permit) and over the majority of the commonly used air and maritime routes across the globe at the data throughput levels required to deliver a feature-rich IFE experience. We also have relationships with Hughes, SES and Intelsat, among others, and have network operational footprints worldwide. These competitive advantages provide us the ability to more rapidly on-board and service new and existing airline, maritime and land-based customers regardless of where they operate.
In addition to regional expansion, we have the ability to rapidly expand our product offerings worldwide. We launched our live television and texting services to customers in the United States and now offer similar and other related services in additional markets around the world. We target heavily air-trafficked regions, which allows us to leverage existing and add additional customers with little interruption to our base operations. Adding customers in areas with existing satellite coverage (utilized for launch customers) enables us to spread fixed costs associated with transponders over a larger network base.
We have dedicated engineering resources to our connectivity services, enabling us to deploy end-to-end solutions for our customers. For example, our engineering resources assist our airline customers with obtaining necessary regulatory approvals, such as STCs, which permit our equipment to be installed and operated on the applicable aircraft type covered by the STC (regardless of airline operator). As we continue to obtain STCs on a wider variety of plane types, we will be able to leverage these STCs for more rapid deployment on new airline customers in the future on a more cost-effective and efficient basis.
Our Network Operations Centers (NOCs) are based in the United States (Illinois and Florida), South America (Sao Paolo, Brazil and Paraná, Argentina), Europe (Madrid and Santander, both in Spain) and the Middle East (Sharjah, UAE). The NOCs manage our 24/7 satellite and network operations and monitor each plane and vessel whether in operation on the ground or docked. We recently expanded our NOCs facilities to manage our growing fleet of connected aircraft and vessels and to continue driving new innovations for our IFC system and offerings.
Media & Content
We develop, acquire and distribute video content, games and other media content and work closely with major and independent studios and other content producers. Accordingly, our significant operating and deal-making experience and relationships with companies in these industries gives us a number of competitive advantages and may present us with additional business targets and relationships to facilitate growth going forward. We believe that we have sustainable competitive advantages due to our market positions, technology and relationships with important content suppliers and airlines.
We are a market leader in providing content and services to the airline, maritime and other “away from home” non-theatrical markets around the world. Our cultural expertise allows us to provide customized solutions to accommodate cultural and linguistic requirements in all key markets, across industries. We provide our content services to many airlines in markets such as the Middle East, Asia and Europe, where demand for content tends to be stronger and airlines are more widely equipped with on-board IFE solutions than in the United States. We also provide solutions for advanced, interactive IFE hardware systems. The new IFE hardware systems provide the technological basis for turning the systems previously used only for the purpose of entertaining passengers into interactive passenger platforms that offer a variety of possibilities. In the IFE industry, this strategic development entails changing IFE into a complete “passenger experience.” We intend to leverage our market position and technological know-how to participate in and take advantage of this cutting-edge development in IFE for the benefit of our customers and their passengers.
With the ability to offer a wide variety of content, games and related services, we believe that we provide our customers with more content options and more cost-effective content solutions than our competitors.
Our Growth Strategy
We believe that our combined connectivity and content services enhance and personalize the experience our customers deliver to their travelers. Using portals created specifically for the mobility audience, we provide Internet access, content-on-demand, and live television programming. Connectivity enhances our content capabilities by expanding our vertical markets across the mobility markets and introducing new capacity for personalized end-user advertising. Providing rich content directly to passengers’ own devices creates new opportunities for revenue from passengers and brand sponsorship. Content enhances our connectivity capabilities by differentiating our products, increasing traffic on our connectivity system, and providing licensing for television and live events. Our services are uniquely positioned to change the existing mobility model and drive towards a satellite-connected entertainment and commerce platform.
Connectivity
We are seeking to aggressively expand our Connectivity solutions to customers worldwide. In aviation markets, we already have significant operations in North America, Europe and the Middle East. We have initiated operations in South America and Asia, and we strategically target new opportunities in markets with high populations and traffic density, such as Asia Pacific, China, India and Brazil, as well as major airlines in North America and Western Europe. In maritime and land markets, we are focused on winning large fleets and fixed terrestrial installations with a combination of efficient broadband capacity and integrated content that improves traveler experience, crew welfare and revenue generation for our customers.
Leverage Technology
We believe we have the most technologically advanced ground network and performance-enhancing technologies in the market today, and we plan to leverage our network strength as we incorporate the newest technology from our satellite partners.
In aviation markets, our technology has proven reliability, global certifications and market-leading capabilities for performance on geostationary satellite networks at mid- and high-latitudes. In maritime and land markets, we have unique multi-band capabilities, patented technologies that improve the quality of experience for end-users and a global network backbone that we believe differentiates us from our competitors. We plan to leverage these advantages as we target expansion in new and emerging markets.
Continue Technological Evolution
We work continuously to improve existing systems and user interfaces, while also developing plans to remain at the forefront of the technological curve. We intend to introduce to market our next-generation Ku- and Ka-band antenna systems for aviation in the near future. We also expect to continue to develop better-performing components of our system, including new aviation components to better service long-haul carriers and new maritime components for television and premium media distribution. Our strategic decision to develop key components and systems that interface with handheld devices should enable our aviation, maritime and land customers to stay on the cutting edge of technological advancements.
Media & Content
Supply-Chain Efficiency
Given our strong position in the IFE content market, we are able to manage larger customer budgets, as well as provide a fully outsourced IFE solution to our customers. We believe that this quality and scale will lead to longer-term contracts and a wider variety of services as evidenced by winning multiple new contracts with terms longer than five years and covering creative user interfaces and innovation as well as traditional content. The scale we have in our post-production facilities and range in content rights management allows for a more efficient cost structure and enables us to serve newer, smaller and more remote customers.
Increasing the Value of Traditional Content
One of our strengths is our ability to efficiently scale our post-production facilities and provide a range of content rights management to our customers. We believe that this will lead to expanded services with existing customers, and allow us to more rapidly expand our services to newer, smaller and more remote customers.
Competition
Our Connectivity segment operates in a highly competitive environment, but only Global Eagle combines network scale across aviation, maritime and land with a global satellite and ground network system, performance-enhancing technologies, end-to-end service management including installation and repair, and fully integrated content and media services.
In aviation, our primary in-flight connectivity competitors are Gogo, Inc., ViaSat, Inc., Thales Avionics Inc., Inmarsat plc and Panasonic Avionics Corporation. In maritime and land, our primary competitors are Speedcast, Inmarsat plc and O3b Networks Ltd. Our competitors use different technologies, including air-to-ground mobile services and satellite connectivity on C-band, Ku-band, Ka-band and L-band networks to provide connectivity to customers. We believe our satellite services offer a competitive combination of worldwide availability, quality of experience, available high-speed bandwidth and cost compared to our competitors.
Our Media & Content segment services the majority of the content market for the worldwide airline industry. We have different competitors for our various activities in the content market. For airline content curation and post-production and advertising, we primarily compete with Spafax, which is affiliated with the advertising and public-relations company WPP PLC. In the maritime market, our primary competitor is Swank Motion Picture Inc. For applications and games, we compete against two small companies on the seat-back systems whereas on open platforms there are numerous companies that provide applications for consumer mobile devices.
We believe our state-of-the-art studio services offer unparalleled solutions to our mobility and studio partners compared to our Media & Content competitors. In addition, we believe that our worldwide relationships with major airline carriers and Hollywood studios provide us with a significant competitive advantage over our competition. For software and applications, we have built up processes for certification on all the major proprietary entertainment systems that make up the bulk of airline entertainment systems.
Government Regulation
As a participant in the global airline and global telecommunication industries we are subject to a variety of government regulatory obligations.
Federal Aviation Administration/European Aviation Safety Agency
Our aviation and maritime and land connectivity services require the installation of network hardware on aircraft and maritime vessels and in remote land locations. The installation of equipment on aircraft is subject to the rules and regulations promulgated by the FAA and its global counterparts, including the EASA. Prior to installing our equipment on an aircraft type, we are required to obtain an STC, which supplements the original Type Certificate obtained by the original aircraft manufacturer from the FAA/EASA and identifies the parts to be installed and the location of the installation and will only be issued by the FAA/EASA after we comply with any additional regulations for the installation of hardware such as ours (for example, bird strike regulation compliance). To date, we have obtained STCs for installing our connectivity solution hardware on the Boeing 737 Next Generation series of aircraft, the Boeing 757, 767 and 777 aircraft families, and the Airbus A320 family. We are also a Boeing linefit supplier for the Boeing 737 Next Generation and 737 MAX aircraft families. We currently have additional STC and linefit certification projects underway.
Global Aero Mobile Satellite Services Regulation
In order to operate our connectivity services, we are required to obtain authorization in each jurisdiction over which we intend to provide our aero mobile satellite services (“AMSS”). In the United States, we have a license from the Federal Communications Commission (“FCC”) allowing us to provide AMSS services subject to compliance with various requirements imposed by the FCC. Certain other countries require affirmative licenses; however many countries only require a notification of intent to provide services and certain technical details without requiring affirmative approval. To date, we are authorized to provide our AMSS connectivity services in over 150 countries.
Employees
As of October 31, 2017, we had approximately 1,500 employees, with approximately 40% employed in the United States. Approximately 2% of our overall workforce is employed in Brazil. Our Brazilian employees are unionized and are employed pursuant to collective bargaining agreements. Such collective bargaining agreements are renegotiated annually on May 1, generally to account for inflation. Other than the foregoing, none of our employees are represented by labor unions or are subject to collective bargaining agreements. We believe that relations with our employees are good.
Corporate History
Prior to January 2013, we were known as Global Eagle Acquisition Corp. Global Eagle Acquisition Corp. was formed in February 2011 as a “special purpose acquisition company” whose purpose was to effect a merger, capital stock exchange, asset acquisition or similar business combination with one or more businesses. In May 2011, we consummated an initial public offering, and from then until January 2013 did not engage in any other business operating activities. In January 2013, we completed a business combination transaction in which we acquired Row 44, Inc. and an 86% equity interest in Advanced Inflight Alliance AG (“AIA”). Following this transaction, we changed our name to Global Eagle Entertainment Inc. We later acquired the remaining 14% equity interest in AIA.
Our principal executive offices are located at 6100 Center Drive Suite 1020, Los Angeles, California, 90045.
Available Information
Our main corporate website address is www.globaleagle.com. We use our website as a channel of distribution for company information, and financial and other material information regarding us is routinely posted and accessible on our website. Copies of the Company’s Quarterly Reports on Form 10-Q, Annual Report on Form 10-K and Current Reports on Form 8-K filed or furnished to the U.S. Securities and Exchange Commission (the “SEC”), and any amendments to the foregoing, will be provided without charge to any stockholder submitting a written request to the Secretary at the principal executive offices of the Company or by calling (310) 437-6000. All of the Company’s SEC filings are also available on the Company’s website at http://investors.geemedia.com/sec.cfm, as soon as reasonably practicable after having been electronically filed or furnished to the SEC. All SEC filings are also available at the SEC’s website at www.sec.gov.
We also live webcast our earnings calls and certain events we participate in or host with members of the investment community on the investor relations section of our corporate website. Additionally, we provide notifications of news or announcements regarding our financial performance, including SEC filings, investor events, and press and earnings releases on the investor relations section of our corporate website. Investors can receive notifications of new press releases and SEC filings by signing up for email alerts on our website. Further corporate governance information, including our Board committee charters and code of ethics, is also available on our website at http://investors.geemedia.com/corporate-governance.cfm. If we make any amendments to our Code
of Ethics other than technical , administrative or other non-substantive amendments, or grant any waiver, including any implicit waiver, from a provision of the Code of Ethics applicable to our principal executive officer, principal financial officer principal accounting officer or controller or persons performing similar functions requiring disclosure under applicable SEC or Nasdaq rules, we will disclose the nature of such amendment or waiver on our website. The information included on our website, or any of the websites of entities that we are affiliated with, is not incorporated by reference into this Form 10-K or in any other report or document we file with the SEC, and any references to our website are intended to be inactive textual references only.
ITEM 1A. RISK FACTORS
Investing in our common stock involves substantial risks. In addition to the other information included in this Annual Report on Form 10-K, the following risk factors should be considered in evaluating our business and future prospects. The risk factors described below are not necessarily exhaustive. You should also refer to the other information contained in this Form 10-K, including Part II, Item 7. Management’s Discussion and Analysis of Financial Condition and Results of Operations.
Risks Related to Our Business and Industry
The material weaknesses in our internal control over financial reporting have not been remediated. If we are unable to remediate these material weaknesses and maintain effective internal control over financial reporting, we may not be able to generate timely and accurate financial statements.
A material weakness is a deficiency, or combination of deficiencies, in internal control over financial reporting such that there is a reasonable possibility that a material misstatement of annual or interim financial statements will not be prevented or detected on a timely basis.
We previously identified a material weakness in our internal control over financial reporting as of December 31, 2015 relating to resources and the timeliness of our financial statement close process, as reported in our Annual Report on Form 10-K for the fiscal year ended December 31, 2015 (the “2015 Form 10-K”).
In addition to the material weakness related to the financial statement close process that existed as of December 31, 2015, we identified additional material weaknesses during and after the fiscal year 2016. These related to our entity level control environment, financial statement close and reporting process, intercompany process, business combination, significant and unusual non-routine transactions, inventory, content library, internally developed software, long lived assets, goodwill impairment, accounts payable and accrued liabilities, revenue processes, license fee accruals, income taxes, payroll, stock-based compensation, treasury, and information technology processes. We believe these additional material weaknesses are the result of the growth of our Company, insufficient automation in our financial reporting environment, increased complexity of our business transactions, and increased decentralization of our operations. In retrospect, we have concluded that the above-described changes to our business were not adequately supported by the hiring of additional personnel with sufficient, specific expertise in accounting, finance and information technology. Moreover, we experienced significant turnover in our executive management during 2016 and 2017. For additional information about the material weaknesses in our internal control over financial reporting, see Item 9A. Controls and Procedures.
We will continue to expend significant financial resources to remediate these material weaknesses in our internal control over financial reporting as well as to perform additional procedures to compensate for our material weaknesses in order to complete our financial statement closing. If we are unable to establish and maintain effective internal control over financial reporting, we may not be able to produce financial statements in a timely manner or without material misstatements. The material weaknesses that we have identified may impair our ability to timely identify and forecast certain business trends and certain aspects of our financial performance. Our failure to timely produce financial statements may also constitute defaults or give rise to penalties under our debt instruments if we are unable to comply with our reporting covenants. Nasdaq could also delist our common stock if we are delinquent in our SEC filings, thereby impairing the trading liquidity of our common stock. A delisting would trigger the repurchase option under the indenture governing our convertible notes (as further described under “Risks Relating to our Common Stock”) and have an adverse impact on the trading volume, liquidity and market price of our common stock. In addition, if we are unable to remediate our material weaknesses in internal control over financial reporting, then investors, customers, rating agencies, lenders or others may lose confidence in the accuracy and completeness of our financial reports, the market price of our securities could decline and we could be subject to sanctions or investigations by Nasdaq, the SEC or other regulatory authorities or litigation that results in substantial fines, penalties or liabilities. As a result, we may be unable to raise funds from debt and equity investors on terms favorable to us, if at all.
On September 13, 2017, Nasdaq notified us that we are currently not compliant with Nasdaq rules and that the Nasdaq staff had determined to delist our common stock. We appealed that determination and had a hearing before a Nasdaq Hearings Panel on October 26, 2017. On November 3, 2017, Nasdaq granted our request for an extension to regain compliance with Nasdaq rules.
Nasdaq granted us our requested extension until November 30, 2017 to file our Annual Report on Form 10-K for the fiscal year ended December 31, 2016 and until January 31, 2018 to file our Quarterly Reports on Forms 10-Q for the quarterly periods ended March 31, June 30, and September 30, 2017.
Our management has concluded that our disclosure controls are ineffective due to material weaknesses in our internal control over financial reporting. If we are unable to establish and maintain effective disclosure controls and internal control over financial reporting, our ability to produce accurate financial statements on a timely basis could continue to be impaired, and the market price of our securities may be negatively affected.
Our management has historically concluded that we do not maintain effective disclosure controls and procedures due to material weaknesses in our internal control over financial reporting. A material weakness is a deficiency, or combination of deficiencies, in internal control over financial reporting, such that there is a reasonable possibility that a material misstatement of annual or interim financial statements will not be prevented or detected and corrected on a timely basis. In connection with our 2016 audit, our management assessed our disclosure controls and procedures and our internal control over financial reporting and concluded that they were not effective due to the material weaknesses in our internal control over financial reporting discussed in Item 9A. Controls and Procedures.
We will continue to expend significant financial resources to remediate these material weaknesses. If we are unable to establish and maintain effective disclosure controls and procedures and internal control over financial reporting, we may continue to be unable to produce timely and accurate financial statements. If that were to happen, investors, customers, rating agencies, lenders or others may lose confidence in the accuracy and completeness of our financial reports, the market price of our securities could decline, and we could be subject to sanctions or investigations by Nasdaq, the SEC or other regulatory authorities or litigation that results in substantial fines, penalties or liabilities.
We have expended significant time and resources in connection with our 2016 audit and expect to incur additional expenses in connection with our efforts to remediate our material weaknesses in our internal control over financial reporting.
We have expended significant time and costs in connection with our 2016 audit, which were funded primarily through amounts drawn on our revolving credit facility, due to our current liquidity constraints. Additional costs associated with our efforts to remediate our material weaknesses in our internal control over financial reporting and restructuring our business could constrain our liquidity further, requiring us to seek amendments or waivers to our credit agreement or obtain additional financing by issuing debt or equity securities. As of the date of filing of this Form 10-K, other than approximately $1 million of availability that we are reserving for foreign currency fluctuations on outstanding letters of credit, we had no capacity remaining under our revolving credit facility. If in the future we have additional capacity on that facility, one of the conditions to drawing on the facility is confirmation that the representations and warranties in our credit agreement are true as of the date of borrowing. If we are unable to make that confirmation, then we will be unable to draw down further on the revolver.
If we issue equity or convertible debt securities to raise additional funds, our existing stockholders may experience dilution, and the new equity or debt securities may have rights, preferences and privileges senior to those of our existing stockholders. If we incur additional debt, it may increase our leverage relative to our earnings or to our equity capitalization, requiring us to pay additional interest expenses. There can be no assurance that we will be able to obtain additional financing on favorable terms, or at all.
The implementation by us of a new revenue recognition standard in 2018 (ASC 606) requires substantial preparation and expenditures, and our failure to properly implement this standard in a timely manner could result in inaccurate revenue recognition and disclosure and cause us to fail to meet our financial reporting obligations.
In May 2014, the Financial Accounting Standards Board (FASB) issued new revenue recognition guidance under ASC 606, which is effective for our interim and annual periods beginning after December 31, 2017. Under this new guidance, revenue is recognized when promised goods or services are transferred to customers in an amount that reflects the consideration that is expected to be received for those goods or services. The new guidance also requires additional disclosure about the nature, amount, timing and uncertainty of revenue that is recognized.
In order to be able to comply with the requirements of ASC 606 beginning in the first quarter of 2018, we need to update and enhance our internal accounting systems, processes and our internal controls over financial reporting. This has required, and will continue to require, additional investments by us, and may require incremental resources and system configurations that could increase our operating costs in future periods. If we are not able to properly implement ASC 606 in a timely manner, the revenue that we recognize and the related disclosures that we provide under ASC 606 may not be complete or accurate, and we could fail
to meet our financial reporting obligations in a timely manner, which could result in, among other things, regulatory discipline, failure to satisfy the requirements of our debt instruments and adversely affect our stock price.
Our business is dependent on the travel industry and the competitive nature of that industry makes our business sensitive to domestic and international economic conditions.
Our business is directly affected by the number of passengers flying on commercial airlines and traveling on cruise ships, the financial condition of these airlines and cruise lines and the general availability of travel and related economic conditions around the world. If demand for air or maritime travel declines, the number of aircraft and flights shrink or the travel industry is severely disrupted, the number of passengers available to use our Connectivity and Media & Content offerings will be reduced, which will have a material adverse effect on our financial condition and prospects. High unemployment rates, reduced consumer and business spending, recessionary conditions in the United States or Europe and terrorism are among the general economic and social conditions that adversely affect the travel and mobility markets. A general reduction or shift in discretionary spending can result in decreased demand for leisure and business travel and lead to a reduction in the number of airline flights or cruise lines offered, the number of passengers flying or taking cruises and the willingness of airlines and cruise lines to commit to spending funds on items such as our Connectivity and Media & Content offerings.
Each of our airline and maritime customers operates in an intensely competitive environment and constantly faces pressure for on-board connectivity and content offerings and pricing of all aspects of air and maritime travel. These competitive circumstances could cause one or more of our customers to reduce expenditures on passenger services, including the deployment of our Connectivity and Media & Content offerings, which could have a material adverse effect on our business prospects and financial condition.
In addition, instability and changes in economic and political conditions across the globe, including inflation, recession, interest rate fluctuations and actual or anticipated military or political conflicts are among the global risks that may impact our business and our plans for expansion. Our operations and performance are sensitive to fluctuations in general economic conditions, both in the U.S. and globally.
A future act or threat of terrorism or other events could result in a prohibition on the use of Wi-Fi enabled devices on aircraft and maritime vessels.
A future act of terrorism, the threat of such acts or other airline or maritime accidents could have an adverse effect on the travel industry. In the event of a terrorist attack, terrorist threat or other accident, the industry could experience significantly reduced passenger demand. The U.S. federal government could respond to such events by prohibiting the use of Wi-Fi enabled devices on aircraft and maritime vessels, which would eliminate demand for our equipment and services. As an example, the U.S. and U.K. governments recently passed legislation banning laptops, tablets and other portable electronic devices as carry-on devices on aircraft vessels traveling from several Muslim-majority countries. Even though the bans have been lifted, they remain plausible responses to acts of terrorism and similar bans could adversely affect our business. In addition, any association or perceived association between our equipment or services and such attacks or accidents would likely have an adverse effect on demand for our equipment and services.
In a number of countries where we operate our Connectivity segment, we are subject to increased risk of disruption to the business due to terrorist acts, conflicts, wars, adverse weather conditions, natural disasters, power outages, pandemics or other public health crises and environmental incidents, wherever located around the world. The potential for future terrorist attacks and natural disasters, the national and international responses to terrorist attacks and natural disasters or perceived threats to national security and other actual or potential conflicts or wars may create economic and political uncertainties. Heightened geopolitical risk, most notably in Africa and the Middle East, could materially adversely affect our Connectivity segment.
We may be unable to renew agreements with existing customers or attract new customers on favorable terms or at all.
A number of factors may adversely impact our ability to retain existing customers and partners and attract new and repeat customers, including dissatisfaction with our services or its consistency, our pricing, the availability of our services, actual or perceived security risks and dissatisfaction with the features of our equipment or services. Additionally, the terms of any future agreements with existing or new customers may be less favorable than our current agreements. We may ultimately fail in entering into agreements with additional customers on competitive terms, and that failure could harm our results of operations due to, among other factors, a diversion of resources, the actual costs of pursuing these opportunities and the inability to deploy committed satellite transponder space segments to additional customers. To the extent that we are unable to secure new customers or that any of our future agreements with existing or new customers are not as favorable as our existing arrangements, our growth and financial prospects would be materially and adversely affected.
Failing to retain and effectively integrate and train key members of senior management could harm our business.
Our business depends on the continued service and performance of our senior management team, many of whom are recent hires. Such individuals have acquired specialized knowledge and skills with respect to our segments and their operations. As a result, if any of these individuals were to leave, we could face substantial difficulty in hiring qualified successors. In addition, the loss of key members of senior management, as well as other key personnel, could disrupt our operations and have an adverse effect on our ability to grow our business. Furthermore, we may experience a loss of productivity while the new members of senior management obtain the necessary training and expertise to integrate into our business. In early 2017, we had turnover in a substantial number of our senior management positions, including our chief executive officer, president, chief financial officer and chief accounting officer. The process of transitioning successor senior managers into their respective roles will require significant time and financial resources, and the transition may not ultimately be successful.
We may fail to recruit, train and retain the highly skilled employees that are necessary to remain competitive and execute the growth strategy of our business.
Our business depends on the continued service and performance of key technical personnel. Such individuals have acquired specialized technical knowledge and skills with respect to our business and operations. As a result, if any of these individuals were to leave, we could face substantial difficulty in hiring qualified successors and could experience a loss of productivity. In addition, much of our key technology and systems are custom-made for our business by our personnel. The loss of key technical personnel could disrupt our operations and have an adverse effect on our ability to grow our business.
The structure of our investment in the WMS joint venture subjects us to risks that may limit our anticipated cash distributions from such investment or prevent us from receiving its anticipated benefits.
We own a 49% equity interest in Wireless Maritime Services, LLC (“WMS”), a provider of global cellular roaming services to off‑shore vessels. WMS’s managing member owns a 51% equity interest in the WMS joint venture, has the right to nominate three of WMS’s five voting board members and controls the day-to-day operations of WMS. WMS’s profits and losses for any fiscal year are allocated between our joint-venture partner and the Company in proportion to percentage interests owned, after giving effect to any applicable special allocations. The WMS joint venture operating agreement provides for annual cash distributions to us and our joint-venture partner, but those distributions are subject to reduction for certain expenses and other items relating to WMS’s operations, including capital expenditures, as determined by WMS’s board (which we do not control). As a result, we may not receive all or part of our anticipated cash distributions in any period for reasons beyond our control.
In addition, our investment in WMS is further subject to various risks that could adversely affect our results of operations and financial condition. These risks include, but are not limited to:
| |
• | Our interests could diverge from our joint-venture partner’s interests or we may not agree with our joint-venture partner on ongoing activities or on the amount, timing or nature of further investments in WMS; |
| |
• | WMS profits and cash flows may prove inadequate to fund cash dividends or other distributions to us, or those amounts may be subject to reduction as noted above; |
| |
• | Our control over the operations of and other decisions relating to WMS is limited; |
| |
• | Due to differing business models or long term business goals, our joint-venture partner may decide not to fund capital investments in WMS, impairing the value of the WMS joint venture; |
| |
• | We may lose the rights to technology or products being developed by WMS, including if our joint-venture partner is acquired by another company, or experiences financial or other losses; |
| |
• | Many of the contractors on which WMS relies are with our joint-venture partner, and “seconded” to WMS from our joint-venture partner, such that WMS relies on these contractors, personnel and other resources provided to it by our joint-venture partner; and |
| |
• | We may experience difficulties or delays in collecting amounts due to us from WMS. |
We are subject to a variety of complex U.S. and foreign tax laws and regimes as a result of our global footprint, and changes in those laws—or our failure to properly interpret them—may adversely affect our business, financial condition, results of operations and cash flows.
We have numerous offices on six continents, and we provide our products and services globally. As a result, we are subject to a variety of complex U.S. and foreign tax laws and regimes, and changes in those laws and regimes—and our failure to properly conduct our operations in compliance with them—could be costly and expose us to fines, penalties or tax obligations that we did not anticipate. This could occur due to, among other things, unclear or unsettled tax laws, lack of clarity as to whether we have “permanent establishment” exposure, intercompany charges, value-added tax and income tax-liability in some countries where we conduct operations. Our failure to comply with any of these laws and regimes, or increased enforcement activity by tax regulators, could adversely affect our business, financial conditions, results of operations and cash flows.
We cannot guarantee that we will continue to be able to make claims for investment tax credits in Canada.
Our Canadian subsidiary, DTI Software, makes claims for currently available tax credits in Canada in the course of its development of games and applications in Canada, including tax credits that support multimedia, e-commerce and research and development in Canada. If governmental authorities in Canada, and, in particular, in the province of Quebec, were to reduce or eliminate the amount of tax credits that are available in respect of these activities by DTI, then our tax liabilities would likely increase and our overall profitability would be negatively impacted. In 2016, we paid approximately $1.1 million in taxes in Canada after taking advantage of approximately $0.1 million in offsetting tax credits.
We are exposed to foreign currency risks in our Media & Content segment.
Within our Media & Content segment, sales to customers and purchasing are largely transacted in U.S. dollars, while most of our Media & Content segment’s operating companies’ fixed costs are incurred in local currencies such as euros, British pounds, Indian rupees and Canadian dollars, which exposes us to currency risks. We cannot preclude the possibility of negative foreign currency effects in the future, some of which may be substantial, due to unforeseen exchange rate fluctuations or inaccurate assessments of market developments.
There are also intragroup receivables and liabilities in our Media & Content segment, such as loans, that can generate significant foreign currency effects. Changes in the exchange rates of a number of foreign currencies against the euro, especially the U.S. dollar and the Canadian dollar, could lead to the recognition of unrealized foreign exchange losses.
Risks Related to Our Connectivity Segment
Our Connectivity segment’s revenue is largely dependent upon our existing relationship and agreement with Southwest Airlines.
Our existing supply and services agreement with Southwest Airlines, which we entered into on December 13, 2016, governs our supply of products and services to Southwest Airlines, including our broadband equipment, Wi-Fi service in connection with the use of our broadband system, live television-related services and certain additional contemplated services. Our Connectivity segment is substantially dependent on this customer relationship, which accounted for 54%, 85% and 83% of such segment’s revenue for the years ended December 31, 2016, 2015 and 2014, respectively, and 22%, 23% and 24% of our consolidated revenue for the years ended December 31, 2016, 2015 and 2014. In addition, a significant source of our revenue and operating income is generated from the supply of live television-related services to Southwest Airlines. If we fail to maintain certain minimum service level requirements relating to such television service, or if we fail to meet other obligations relating to our technology, equipment or services, Southwest Airlines may have the right to terminate such television service or the supply and services agreement. Further, there is no guarantee that Southwest Airlines will continue to maintain historical levels of fleet installation growth and services with us. Our business would be materially adversely affected if we are unable to maintain our existing relationship with Southwest Airlines or if such television service or the supply and services agreement is terminated.
The success of our Connectivity segment depends on the investment in and development of new broadband technologies and advanced communications and secure networking systems, products and services, as well as their market acceptance.
Broadband, advanced communications and secure networking markets are subject to rapid technological change, frequent new and enhanced product and service introductions, product obsolescence and changes in user requirements. Our ability to compete successfully in these markets depends on several factors, including:
| |
• | our ability to continue to develop leading technologies in existing and emerging broadband, advanced communications and secure networking markets; |
| |
• | our ability to successfully develop, introduce and sell new products and services on a timely and cost-effective basis that respond to ever-changing customer requirements; |
| |
• | our ability to enhance our product and service offerings by continuing to increase satellite capacity, bandwidth cost efficiencies and service quality and adding innovative features that differentiate our offerings from those of our competitors; |
| |
• | successful integration of various elements of our complex technologies and system architectures; |
| |
• | timely completion and introduction of new system and product designs; |
| |
• | achievement of acceptable product and service costs; |
| |
• | establishment of close working relationships with major customers for the design of their new communications and secure networking systems incorporating our products and services; |
| |
• | marketing and pricing strategies of our competitors with respect to competitive products and services; and |
| |
• | market acceptance of our new products and services. |
We cannot guarantee that our new technology, product or service offerings in our Connectivity segment will be successful or that any of the new technologies, products or services we offer will achieve sufficient market acceptance. Our Connectivity segment may experience difficulties that could delay or prevent us from successfully selecting, developing, manufacturing or marketing new technologies, products or services, and these efforts could divert our attention and resources from other projects. We cannot be sure that such efforts and expenditures will ultimately lead to the timely development of new offerings and technologies. Any delays could result in increased costs of development or divert resources from other projects. In addition, defects may be found in our products after we begin deliveries that could result in degradation of service quality, and the delay or loss of market acceptance. If we are unable to design, manufacture, integrate and market profitable new products and services for existing or emerging markets, it could materially harm our business, financial condition and results of operations.
We face increased demand for greater bandwidth, speed and performance from customers in an increasingly competitive environment featuring new technologies and market entrants, which may require us to maintain increased service levels at higher costs and make significant investments in improving our Connectivity platform.
Competition among providers of connectivity solutions, including satellite providers who can leverage their own gateways and satellite constellations to provide connectivity solutions directly to customers, may impact prices received for services. Moreover, if demand for greater bandwidth, Internet streaming, speed and performance of our network increases, we may be forced to expend substantial financial and other resources in investing in future satellite transponder capacity and network infrastructure and improve our overall satellite-based and related technologies to ensure that we meet such demands from our current and future customers. The costs of obtaining current and future satellite capacity may also be impacted by limitations in global satellite capacity. Should demand increase for greater bandwidth, speed and performance beyond our current capabilities in this increasingly competitive environment featuring new technologies and direct satellite providers directly competing with our offerings, we may be required to significantly invest in improving our Connectivity solution or to leverage our existing platform, including our Media & Content services offerings, to further develop and deploy more cost-effective connectivity solutions.
We may experience customer attrition as satellite capacity providers increasingly enter into arrangements directly with customers.
We rely on satellite providers to secure the satellite capacity needed to conduct our Connectivity operations and provide Connectivity services to customers. There is no guarantee that we will be able to obtain the capacity needed to conduct our operations at current rates and levels moving forward, or to obtain capacity on commercially reasonable terms or at all. Satellite manufacturers, satellite owners and other satellite providers are increasingly seeking to enter into arrangements directly with our customers for satellite capacity and services. As a result, we may experience customer attrition and may be unable to compete with satellite providers who could offer greater pricing flexibility and satellite capacity options given their place in the supply chain. Our failure to compete with satellite providers, or new-entrant providers, and offer favorable pricing arrangements to customers could materially harm our business, financial condition and results of operations.
We rely on “sole source” service providers and other third parties for certain key components of, and services relating to, our Connectivity segment.
We currently source key components of our hardware and key features of our Connectivity services from sole providers of equipment and network services, respectively, including the satellite antenna sourced from TECOM Industries, Inc., or TECOM, and substantially all of our Connectivity segment’s satellite modems from Hughes. If we experience a disruption in the delivery of products and services from any of our key providers it may be difficult for us to continue providing our own products and services to our customers. We have experienced component delivery issues in the past and there can be no assurance that we will avoid similar issues in the future. In addition, the supply of third party components in general could be interrupted or halted by a termination of our relationships with such third parties, a failure of quality control or other operational problems at such suppliers or a significant decline in their financial conditions. If we are unable to continue to engage suppliers with the capabilities or capacities required by our Connectivity segment, or if such suppliers fail to deliver quality products, parts, equipment and services on a timely basis consistent with our schedule, our business prospects, financial condition and results of operations could be adversely affected. Additionally, any loss of favored nation relationships that we have with our hardware providers today could eliminate our competitive advantage in the use of satellites for in-flight connectivity in the future, which could have a material adverse effect on our business and operations.
We may be unsuccessful or delayed in developing and deploying new global antenna technologies.
We have entered into a long-term development project with QEST to develop new global antenna technologies, and have made and continue to make significant product development investments to our existing connectivity technology solutions to address these new technologies. Since our new global antenna technologies have yet to be deployed for commercial use, there can be no assurance that such technologies will perform as expected or be commercially available on our current timeline, if at all, due to, among other things, problems arising in the development process, and delays in obtaining or failures to obtain the required regulatory approvals to deploy and operate such technologies. If the technologies fail to perform as expected or their commercial availability is significantly delayed, our business, business prospects and results of operations may be materially adversely affected.
We may need to materially increase our investments in product development and equipment in connection with our efforts to grow our Connectivity segments’ service line and remain competitive in the future, which the Company could be unable to do if it is liquidity constrained.
We have historically incurred significant product development expenses to support the growth of our Connectivity services and offerings and we expect to continue to expend substantial financial and other resources as we continue to grow our Connectivity segment and increase our investments in satellite-based technologies and our product offerings. As current and future product development efforts progress, such as our currently-in-process Boeing line-fit initiative (that allows the Company to install its connectivity equipment on aircraft during assembly), QEST antenna development, expansions in our satellite-based services and capabilities, Airtime IFE product offering development, investments in Ku-HTS technologies and capital investments in Connectivity equipment for new and existing customers and services, the costs of our Connectivity segment may materially fluctuate in future periods, which could negatively affect our future operating results. The amount and timing of these costs are subject to numerous variables, including the availability and timing of next-generation technologies, the need and related costs to develop and implement changes to our software and hardware or to expand our service offerings to be competitive and, with respect to satellite technologies, the need and related costs of obtaining current and future satellite capacity. The capital investments and related costs may be significant, and we may have insufficient liquidity or resources to make those investments in the future.
We may be unsuccessful in expanding our Connectivity segment internationally, and our international operations are subject to a variety of risks.
We operate our Connectivity segment in numerous countries around the world and intend to continue to expand the number of countries in which we operate. Our ability to expand our Connectivity segment internationally involves various risks, including the need to invest significant resources in unfamiliar markets and the possibility that there may not be returns on these investments in the near future comparable to our recent financial results or at all. We may need to adopt technological solutions for broadband Internet that are different than those we deploy domestically, we may be unable to find content or service providers to partner with on commercially reasonable terms for foreign markets, or at all, and we cannot provide assurance that changes in geopolitics will not result in restrictions on the expansion of our business, such as restrictions on foreign ownership of telecommunications providers or the establishment of economic sanctions by the United States affecting businesses such as ours. In addition, in expanding our operations internationally, we expose our business to the risks and uncertainties relating to the international financial markets, compliance with international regulations and policies, the complexity of managing foreign operations and human resources and more acute exposure to the impact of international governmental and political changes and conflicts.
Many of the countries in which we operate our Connectivity segment have legal systems that are less developed and less predictable than legal systems in the United States, and, as a result, our international expansion exposes us to potential increased costs and uncertainties. New rules and regulations may be enacted or existing rules and regulations may be applied or interpreted in a manner which could limit our ability to provide the services of our Connectivity segment in the countries in which we wish to operate.
Our reputation and ability to attract, retain and serve our Connectivity customers may be negatively impacted by service interruptions or delays, technology failures, damage to equipment or software defects or errors.
Our reputation and ability to attract, retain and serve our customers depends, in part, upon the reliable performance of our Connectivity segment’s satellite transponder capacity, network infrastructure and connectivity system. The uninterrupted operations and services of our Connectivity segment depend upon the extent to which our equipment and the equipment of our third-party network providers is protected against damage from fire, flood, earthquakes, power loss, solar flares, telecommunication failures, computer viruses, break-ins, acts of war or terrorism and similar events or factors beyond our control. Our Connectivity segment has experienced interruptions in these systems in the past, including infrastructure, component and service failures that cause service disruptions, service delays or technology or systems failures. If we experience frequent system or network failures, our reputation could be harmed and our Connectivity customers may have the right to terminate their contracts with us or pursue other remedies. Any such impact to our reputation or ability to attract, retain and serve our Connectivity customers could have a material adverse effect on our business, financial condition and results of operations.
In addition, the software underlying our Connectivity services is inherently complex and may contain material defects or errors, particularly when software is first introduced or when new versions or enhancements are released. Any defects or errors, particularly those that cause interruptions to the availability of our Connectivity services could result in termination or failure to renew contracts by our airline customers, reputational risk and reductions in sales or sales credits or refunds to our customers. The costs incurred in correcting any material defects or errors in our software may be substantial and could have a material adverse effect on our financial condition and results of operations.
The failure of our equipment or material defects or errors in our software may damage our reputation or result in claims against us that exceed our insurance coverage, requiring us to pay significant damages and impairing our ability to offer our Connectivity services.
The products offered by our Connectivity segment contain complex systems and components that could contain errors or defects, particularly when we incorporate new technologies. If any of our Connectivity products are defective, we could be required to redesign or recall those products or pay substantial damages or warranty claims. Such events could result in significant expenses and material liabilities, disrupt sales and affect our reputation and that of our products. If our Connectivity segment’s on-board equipment has a severe malfunction or if there is a problem with equipment installation which damages an aircraft or maritime vessel or impairs its on-board electronics or avionics, significant property loss and serious personal injury or death could result. Any such failure could expose us to material product liability claims or costly repair obligations. Our insurance coverage may not be sufficient to fully cover the payment of any such claims. A product recall or a product liability claim not fully covered by insurance could have a material adverse effect on our business, financial condition and results of operations. In addition, our indemnity obligations to our enterprise customers may include losses due to third-party claims (such as from their end-users, e.g., their passengers) and, in certain cases, the causes for such losses may include failure of our products. Such indemnity obligations are difficult to quantify but may result in significant expenses. In addition to such costs, any material defects or errors could have a material adverse effect on our reputation, which could impair our ability to continue to offer our Connectivity services in the future.
Satellite failures or degradations in satellite performance could affect our business, financial condition and results of operations.
We use leased and Company-owned satellite capacity to support our broadband services for our Connectivity segment. Satellites utilize complex technology and operate in the harsh environment of space and, accordingly, are subject to significant operational risks while in orbit. These risks include malfunctions (commonly referred to as anomalies), interference from electrostatic storms, and collisions with meteoroids, decommissioned spacecraft or other space debris. The satellites we employ for our Connectivity segment have experienced various anomalies in the past and will likely experience anomalies in the future. Anomalies can occur as a result of various factors, such as satellite manufacturer error, whether due to the use of new or largely unproven technology or due to a design, manufacturing or assembly defect that was not discovered before launch and general failures resulting from operating satellites in the space environment.
Additionally, the Company uses for some of its services inclined orbit satellites. These are satellites that are operating beyond their original design life and have reduced their station keeping fuel consumption rate so that they no longer remain in a zero
degree inclination orbit. Their remaining useful life is a function of how long the remaining fuel can be used to maintain an acceptable orbit inclination to allow us to provide services to our customers. Once the onboard fuel has been exhausted, these satellites may not be able to provide useful services.
Any single anomaly or series of anomalies, or other operational failure or degradation, on any of the satellites, or the complete loss of a satellite, could have a material adverse effect on our operations and revenue and our relationships with current customers and distributors, as well as our ability to attract new customers. Anomalies may also reduce the expected useful life of a satellite, thereby creating additional expense due to the need to provide replacement or backup capacity and potentially reducing revenue if service is interrupted or degraded on the satellites utilized. We may not be able to obtain backup capacity or a replacement satellite on reasonable economic terms, a reasonable schedule or at all.
Although many satellites have redundant or backup systems and components that operate in the event of an anomaly, operational failure or degradation of primary critical components, these redundant or backup systems and components are subject to risk of failure similar to those experienced by the primary systems and components. The occurrence of a failure of any of these redundant or backup systems and components could materially impair the useful life, capacity or operational capabilities of the satellite.
Additional businesses or technologies we acquire or invest in could prove difficult to integrate, disrupt our ongoing business, dilute stockholder value or have an adverse effect on our results of operations.
We may engage in further acquisitions of businesses or technologies to augment our growth, or we may invest with third parties in certain U.S. and foreign markets. Acquisitions and investments involve challenges and risks in negotiation, execution, valuation and integration. Even if successfully negotiated, closed and integrated, certain acquisitions or investments may not advance our business strategy, may fall short of expected return-on-investment targets or may fail. Any past or future acquisition or investment could also involve additional risks, including:
| |
• | potential impact on our ability to produce financial statements in a timely manner, such as with the EMC Acquisition and which acquisition in turn contributed to our material weaknesses in our internal controls in 2016; |
| |
• | potential distraction of management from our ongoing business and from the remediation of our material weaknesses; |
| |
• | difficulty integrating the operations and products of the acquired business, including specifically with respect to challenges and delays in timing that we face integrating the acquired EMC business (which could result in delays in the realization of acquisition synergies); |
| |
• | use of cash to fund the acquisition or investment or for unanticipated expenses; |
| |
• | limited market experience in new businesses; |
| |
• | exposure to unknown liabilities, including litigation against the companies that we acquire; |
| |
• | additional costs due to differences in culture, geographical locations and duplication of key talent; |
| |
• | delays associated with or resources being devoted to regulatory review and approval and other ongoing compliance matters; |
| |
• | acquisition-related accounting charges affecting our balance sheet and operations; |
| |
• | difficulty integrating the financial results of the acquired business in our consolidated financial statements; |
| |
• | controls in the acquired business; |
| |
• | impairment of goodwill, intangible and tangible assets, such as the goodwill impairments with respect to the EMC Acquisition that we recognized in 2016 and that we expect to recognize in the first quarter of 2017; |
| |
• | dilution to our current stockholders from the potential issuance of equity securities to consummate a proposed acquisition or investment; and |
| |
• | potential loss of key employees or customers of the acquired company. |
In the event that we enter into any acquisition or investment agreements, closing of the transactions could be delayed or prevented by regulatory approval requirements, including antitrust or national-security reviews or other conditions. We may not be successful in addressing these risks or any other problems encountered in connection with any attempted acquisitions or investments, and we could assume the economic risks of such failed or unsuccessful acquisitions or investments.
In certain of our previously completed acquisitions, we have agreed to make future payments, either in the form of employee bonuses or contingent purchase price payments, or earnouts, based on the performance of the acquired businesses or the employees who joined us with the acquired businesses. We may use earnouts for acquisitions in the future. The performance goals pursuant to which these future payments may be made generally relate to achievement by the acquired business or the employees who joined us from the acquired business of certain specified benchmarks during a specified period following completion of the applicable acquisition. Future acquisitions or investments may involve issuances of stock as full or partial payment of the purchase price for the acquired business or investment, grants of incentive stock or options to employees of the acquired businesses (which may be dilutive to existing stockholders), and expenditure of substantial cash resources or the incurrence of material amounts of debt. The specific performance goal levels and amounts and timing of employee bonuses or contingent purchase price payments vary with each acquisition. While we expect to derive value from an acquisition in excess of such contingent payment obligations, our strategy may change and we may be required to make certain contingent payments without deriving the anticipated value.
Although we conducted due diligence in connection with the acquisitions and investments that we have consummated, we cannot be certain that such diligence revealed all material issues that may be present in those businesses, that it would be possible to uncover all material issues through a customary amount of due diligence, or that factors outside of our control will not later arise. Even if the due diligence that we conducted in connection with acquisitions or investments that we have already consummated or that we consummate in the future successfully identifies certain risks, unexpected risks may arise and previously known risks may materialize in a manner not consistent with our preliminary risk analysis.
We may be required to write down or write off assets, restructure operations, or incur impairment or other charges that could result in losses with respect to any acquisitions or investments we consummate from time to time. Even though these charges may be non-cash items and not have an immediate impact on our liquidity, the fact that we report charges of this nature could contribute to negative market perceptions about us or our securities. Any such write-downs, write-offs, restructuring or charges could have a significant negative effect on our financial condition, results of operations and stock price.
We may fail to realize the expected benefits of any acquisitions or investments as rapidly as the expectations of, or to the extent anticipated by, the marketplace, investors, financial analysts or industry analysts. Any such failure may have a material adverse impact on our financial condition, results of operations and stock price.
We may in the future experience losses from fixed‑price Connectivity contracts or contracts where our average revenue per customer declines more quickly relative to decreasing (or potentially increasing) associated costs.
We typically provide the services of our Connectivity segment for a fixed‑rate monthly recurring fee under long‑term contracts, which are usually three to five years in length. These contracts carry the risk of potential cost overruns because we assume the burden of all costs under the agreement. We assume greater financial risk on fixed‑price contracts than on other types of contracts because our ability to profit on such contracts is dependent on our ability to anticipate technical problems, estimate costs accurately and control costs during the performance of such contracts. If we are unable to estimate or control costs under our fixed price contracts, the net profit of our Connectivity segment may be significantly reduced. Because many of these long-term contracts involve new technologies and applications, unforeseen events, such as technological difficulties, fluctuations in the price of materials, problems with the suppliers and cost overruns, can result in the contractual price becoming less favorable or even unprofitable to us over time. We may in the future experience historical cost overruns and operating losses on at least some of our customer agreements.
Risks Related to Our Media & Content Segment
Our Media & Content segment and the related media and content market faces pricing pressure and reduction in the use of intermediary content service providers.
Our Media & Content business faces pricing pressures from both our customers and studios. Studios, distributors and other content providers seek more expensive pricing for the content that we acquire, and our customers simultaneously demand and negotiate for lower prices and rates for the content and services that we provide. We cannot assure you that we can maintain any current pricing efficiencies with studios, distributors and other content providers, and we may need to provide price concessions in order to acquire new customers or retain current customers in the future. Changes to our cost structure and pricing that reduce our overall yields may have an adverse effect on our financial condition and results of operations.
In addition, our customers may reduce their use of intermediary content service providers (such as us) and seek to obtain content directly from content creators and distributors (i.e., directly from our content suppliers). If our customers execute engagements directly with studios, distributors and other content creators, then our business as a content service provider will be adversely affected.
Our revenue may be adversely affected by a reduction or elimination of the time between our receipt of content and the content being made more broadly publicly available to the rental or home viewing market (i.e., the “early release window”).
We receive the content that we provide directly from studios, distributors and other content providers, and the timing of our receipt of such content is at the discretion of such content providers. Historically, we have received content prior to its availability to the public through the rental or retail markets or Internet streaming services and we have taken advantage of this “early release window” in our business by offering our enterprise customers media and content options before they become generally available to their passengers. However, if content providers delay the release of content in a manner that reduces or eliminates the “early release window,” we may be unable to generate anticipated revenue in our Media & Content segment because passengers may have the opportunity to consume or download such content at home rather than in-flight.
A reduction in the volume or quality of content produced by studios, distributors or other content providers could diminish the attractiveness of our Media & Content products for passengers.
We receive content from studios, distributors and other content providers, and, in some circumstances, we depend on the volume and quality of the content that these content providers produce. If such providers were to reduce the volume or quality of content that they make available to us, whether due to their own financial limitations or other factors influencing their businesses, we would have less quality content to choose from, and our programmers would have more difficulty finding relevant and appropriate content to provide to our customers. This could negatively impact the passenger experience, which could, in turn, reduce the demand for our Media & Content segment’s offerings and would have a negative impact on our revenue and results of operations.
We face competition from the increasing on-board use of personal electronic devices and the greater capabilities for passengers to access and download content to such devices prior to travel, which may, among other things, cause passengers to substitute our IFE services offered in our Media & Content segment with “over-the-top” download services.
Ever-increasing numbers of passengers have personal electronic devices or other digital platforms which have the ability to deliver passengers content in-flight, such as movies, music or games or to access on-board connectivity to the Internet, live television or content on demand. In addition, passengers also may subscribe or have access to “over-the-top” download services (such as Amazon and Netflix) that permit them to download content onto their personal electronic devices prior to travel that they can then access in transit without Wi-Fi or Internet. Being able to use these download and streaming services as an alternative to any media and content that we may be able to provide to our airline or maritime customers may devalue our content service offerings because those passengers will use those alternative platforms instead of our own. If passengers no longer utilize traditional IFE systems for the delivery of content and the demand for our services declines, our customers may cease engaging with us for their content service provider needs, which could have a material adverse effect on our financial condition and results of operations.
Our Connectivity segment competes with other companies that offer IFE and IFC systems, and such competition could deter those companies from engaging our Company as a content service provider.
Our Connectivity segment competes with large companies that offer various products and services in the IFE and IFC supply chain. As such competition with companies in our supply chain continues to increase, our relationship with those companies may deteriorate and actively reduce potential business opportunities. For example, there are companies in our industry that not only compete with our Connectivity segment but also determine the specific IFE system to be utilized on board. Our opportunity to provide services and offerings in our Media & Content segment with respect to such IFE system may be hindered by the competition created by the Connectivity side of our business. If our relationship with such companies that control multiple levels of the supply chain is impacted by the Connectivity solutions that we offer, our Media & Content segment could be adversely affected as a result.
The long sales cycle of many of our Media & Content segment’s products increases the difficulty of our expense planning and revenue forecasting and may cause us to expend substantial resources without any assurance of an acceptable financial return.
Many of our Media & Content segment’s products have long sales cycles that involve numerous steps, including initial customer contacts, specification writing, software engineering design, software prototyping, pilot testing, device certification,
regulatory approvals, marketing and sales efforts and commercial manufacture, integration and delivery. During this cycle, we may expend substantial financial resources and management time and effort without any assurance or ability to predict when or if product sales will result. Delays in sales may cause us to expend significant resources without any assurance of an acceptable financial return and increases the difficulty of our expense planning and revenue forecasting, which could have a material adverse effect on our business.
We may in the future experience losses from fixed-price Media & Content contracts.
We currently have multi-year, fixed-price delivery contracts with some of the studios from which we purchase content which enable us to purchase content during their respective terms at fixed purchase prices, or through “flat deals.” Adjustments to such fixed purchase prices may be advisable or necessary, such as if there are significant changes in customer demand or content supply. If we are unable to make such adjustments or if there is a shift in the customer base under such contracts, then there is a risk that the profit margins on such fixed-price Media & Content contracts may be smaller than predicted or result in a loss. Reduced profit margins or losses in our Media & Content segment resulting from fixed-price contracts could have a material adverse impact on our financial condition and results of operations.
We may be unable to retain or attract Media & Content customers if we do not develop new products or enhance those we currently provide.
The IFE market is faced with rapid technological change, evolving standards in IFE and computer hardware, software development, communications and security infrastructure, and changing needs and expectations of customers. Building new products and service offerings requires significant investment in development. Our investment in software and other product development may ultimately prove to be unsuccessful, and the Company may be required to impair the capitalized value associated with those investments. We also face uncertainty when we develop or acquire new products for our Media & Content segment because there is no assurance that a sufficient market will develop for those products.
In addition, a substantial portion of our Media & Content segment’s research and development resources are devoted to maintenance requirements and product upgrades that address new technology support. These demands put significant constraints on the resources that we have available for new product development. If we are unable to develop new products or enhance those we currently provide in an environment of technological change and evolving standards and customer needs, we may be unable to retain or attract Media & Content customers and our financial condition and results of operations would be materially adversely impacted as a result.
Risks Related to our Intellectual Property and Information Technology
Our intellectual property rights are valuable, and any failure or inability to sufficiently protect them could harm our business and operating results.
Our proprietary rights to the technologies we use in our products and services, particularly with respect to our proprietary SpeedNet product that improves the web-browsing experience over a satellite connection by proactively storing web content close to the user, are important to the success of our business. We generally rely on a combination of patents, copyrights, trademarks, trade secret laws and contractual rights to protect our proprietary rights in our technology and products. We also generally enter into confidentiality agreements with our employees, consultants and corporate partners, and endeavor to control access to and distribution of our proprietary information. Despite our efforts to protect our proprietary rights, unauthorized parties may attempt to copy or otherwise obtain and use our products or technology. If we are unable to protect our proprietary rights adequately, our competitors could use the intellectual property we have developed to enhance their own products and services, which could materially harm our business. Monitoring and preventing unauthorized use of our technology is difficult. In addition, we may be required to commence litigation to protect our intellectual property rights or to defend against or determine the validity and scope of the proprietary rights of others. If we are unsuccessful in any such litigation in the future, our rights to enforce or use such intellectual property may be impaired or we could lose some or all of our rights to such intellectual property. We do not know whether the steps we have taken will prevent unauthorized use of our technology, including in foreign countries where the laws may not protect our proprietary rights as extensively as in the United States. If we are unable to protect our proprietary rights, we may find ourselves at a competitive disadvantage to others who need not incur the substantial expense, time and effort required to create innovative products.
Our business and reputation could be materially harmed as a result of data breaches, data theft, unauthorized access or hacking.
The success of our business depends, in part, on the secure and uninterrupted performance of our information technology systems. In addition, because we engage suppliers and vendors to process personal and payment card information of our customers
and end-users, our business is dependent on the security and performance of the information technology systems of those suppliers and vendors. An increasing number of companies have disclosed breaches of their security, some of which have involved sophisticated and highly targeted attacks on their computer networks. As an example, the content and media industry has recently encountered numerous recent hacks by third parties that have resulted in the premature release of valuable content and the associated loss of revenue. The techniques used to obtain unauthorized access, disable or degrade service or sabotage systems change frequently and often, and as a result the techniques are often not recognized until launched against a target. In addition, we may not have identified all potential issues stemming from such unauthorized access. Accordingly, we may be unable to anticipate such threatening techniques or to implement adequate preventative measures to protect our business from cyber and similar unauthorized attacks on our information technology systems. If unauthorized parties gain access to our or our suppliers’ information technology systems, they may be able to misappropriate assets or sensitive information (such as personally identifiable information of our customers (including their payment card information), business partners and employees), cause interruption in financial systems or operations and corruption of data or computers or otherwise damage our reputation and business. In such circumstances, we could be held liable to our customers, vendors, business partners or other parties or be subject to regulatory or other actions. Any compromise of our security or the security of our suppliers and vendors could result in a loss of confidence in our security measures and subject us to litigation, civil or criminal penalties and negative publicity that could adversely affect our business, financial condition and results of operations.
We may not succeed in implementing a new enterprise resources planning (“ERP”) system to assist with remediating our material weaknesses in our internal controls.
We have several material weaknesses in our internal controls as a result of our failure to have a robust ERP system. See Item 9A. Controls and Procedures. Our ability to remediate our material weaknesses in our internal controls depends in part on our ability to implement this enhanced ERP system and adequately train our personnel to effectively utilize the new system. We believe that a new ERP system will provide greater depth and breadth of functionality than our current ERP systems, which will allow us to more effectively integrate past and future acquisitions and manage business and financial data, manufacturing and resource planning functions and other business processes and information that is important to our management team. We currently utilize several ERP systems, some of which have been only partially integrated from our acquired businesses. We intend to streamline these disparate systems into a single Oracle ERP system which will require significant time and resources. To date, we have been unable to successfully implement an effective company-wide ERP system due to lack of sufficient qualified resources and inadequate integration of financial and internal control processes following acquisitions. Additional time and resources will be necessary to fully operationalize a new ERP system. We can make no assurance that our efforts to implement such system will be successful or that such system will meet our expectations in respect of our efforts to remediate certain of our material weaknesses.
We are subject to civil litigation involving allegations of copyright and patent infringement and related claims for indemnification, which could result in our having to pay damages. We may also be subject to additional similar litigation in the future.
We have been, and in the future may be, subject to civil litigation by parties claiming that certain of our audio and music programming offerings infringe the copyright and other intellectual property rights of such parties. Music and related content are subject to complex licensing and intellectual property rights regimes, and if we are unable to successfully navigate those regimes we may incur damages and liability for any rights infringement. In addition, we are, and in the future may be, subject to civil litigation by patent owners that claim that our connectivity systems infringe their patents and other intellectual property rights.
We will continue to incur costs to defend and/or settle such lawsuits and such costs may be material. We may be required to pay substantial damages and/or be subject to injunctive relief as a result of these matters, and until resolved, these matters may divert the attention of our management and other resources. The outcome of the foregoing ongoing matters is inherently uncertain and could have a materially adverse effect on our business, financial condition and results of operations.
In addition, in recent years there has been significant litigation involving intellectual property rights in many technology-based industries, including the wireless communications industry. Any infringement, misappropriation or related claims, whether or not meritorious, are time-consuming, divert technical and management personnel and are costly to resolve. As a result of any such dispute, we may have to develop non-infringing technology, pay damages, enter into royalty or licensing agreements, cease providing certain products or services or take other actions to resolve the claims. These actions, if required, may be costly or unavailable on terms acceptable to us. Some of our suppliers may not provide us with an indemnity for the use of the products and services that these providers supply to us, even if we are exposed to liability for their infringement. At the same time, we generally offer third party intellectual property infringement indemnity to the customers of our Connectivity segment which, in some cases, do not cap our indemnity obligations and thus could render us liable for both defense costs and any judgments. Any of these events could result in increases in our operating expenses, limit our service offerings or result in a loss of business if we are unable to meet our indemnification obligations and our airline customers terminate or fail to renew their contracts.
Risks Related to Legal, Governmental and Regulatory Matters
We may face changes in regulations and difficulties in obtaining regulatory approvals to provide our services or to operate our business in particular countries or territorial waters, which could have a material adverse impact on the competitive position, growth and financial performance of our Connectivity segment.
In a number of countries where we operate our Connectivity segment, the provision of our services is highly regulated. We may be required to obtain approvals from national and local authorities in connection with most of the telecommunication services that we provide. In many jurisdictions, we must maintain such approvals through compliance with license conditions or payment of annual regulatory fees. For example, many of our Connectivity customers to whom we provide maritime and land products and services utilize our services on mobile vessels or drilling platforms that may enter into new countries on short notice. If we do not already have a license to provide our service in that country or to operate in that country’s territorial waters, if required, we may be required to obtain a license or other regulatory approval on short notice, which may not be feasible in some countries. Failure to comply with such regulatory requirements could subject us to various sanctions including fines, penalties, arrests or criminal charges, loss of authorizations and the denial of applications for new authorizations or for the renewal of existing authorizations or cause us to delay or terminate our service to such vessel or platform until such license or regulatory approval may be obtained. In some areas of international waters, it is ambiguous as to which country’s regulations apply, if any, and thus difficult and costly for us to determine which licenses or other regulatory approvals we should obtain. In such areas, we could be subject to various penalties or sanctions if we fail to comply with the applicable country’s regulations.
We are unable to predict with any certainty the arrival of new or changed regulations from regulatory authorities with jurisdiction over the products and services we provide in our Connectivity segment, including the operation of satellites, the use of satellite bandwidth, the use of radio spectrum, the licensing of earth stations and other radio transmitters, the provision of communications services, the design, manufacture and marketing of communications systems and networking infrastructure and maritime activity. Failure to comply with applicable laws or regulations could result in the imposition of financial penalties against us, the adverse modification or cancellation of required authorizations, or other material adverse actions.
Laws and regulations affecting our Connectivity segment are subject to change in response to industry developments, new technology, and political considerations. Legislators and regulatory authorities in various countries are considering, and may in the future adopt, new laws, policies and regulations, as well as changes to existing regulations, regarding a variety of matters that could, directly or indirectly, affect our operations or the operations of our distribution partners, increase the cost of providing products and services and make the products and services of our Connectivity segment less competitive in our core markets, including by making it easier or less expensive for competitors to compete with us. In addition, regulation by United States and foreign government agencies, such as the Committee on Foreign Investment in the United States (“CFIUS”), may impair our ability to raise funds from foreign sources. For example, in July 2017, we terminated our investment agreement with Shareco Group of America, Inc. that we had entered into in late 2016 as a result of the parties’ inability to obtain CFIUS approval. For a further description of the Shareco transaction, see “2016 Transactions” under Item 7. Management’s Discussion and Analysis of Financial Conditions and Results of Operations in this Form 10-K.
Regulation by United States government agencies, such as the FAA (which regulates the United States civil aviation manufacturing and repair industries), the FCC (which regulates the United States telecommunications industry), the FTC (which regulates competition and consumer protection) and their foreign equivalents may increase our costs of providing services, may require us to change our services, or—if we are not in compliance with relevant requirements—may lead to costly regulatory enforcement actions against us that can result in the imposition of significant penalties.
Our Connectivity segment is subject to extensive regulation by U.S. and foreign government agencies. The U.S. government agency that has primary regulatory authority over our operations is the FAA. Similar government agencies in foreign countries also exercise regulatory oversight over our business operations. The commercial and private aviation industries, including civil aviation manufacturing and repair industries, are highly regulated by the FAA. FAA certification is (and similar certification in foreign countries may be) required for all equipment that we install on commercial aircraft, and certain of our operating activities require that we obtain FAA certification or similar foreign certifications as a parts manufacturer. For example, in the United States, FAA approvals required to operate our Connectivity segment include STCs and Parts Manufacturing Authority (“PMAs”). Obtaining STCs and PMAs is an expensive and time-consuming process that requires significant expenditures of time and resources. Any inability to obtain, delay in obtaining, or change in, needed FAA certifications or their foreign equivalents, authorizations or approvals could have an adverse effect on our ability to meet the installation commitments of our Connectivity segment, to manufacture and sell parts for installation on aircraft, or to expand our business and could, therefore, materially adversely affect our growth prospects, business and operating results. If we fail to comply with the many regulations and standards that apply to our activities, we could lose our FAA certifications or their foreign equivalents, authorizations or other approvals on which the
manufacturing, installation, maintenance, preventive maintenance and alteration capabilities of our Connectivity segment rely. In addition, the FAA and other similar government agencies may adopt new regulations or amend existing regulations. These government agencies could also change their policies regarding the delegation of inspection and certification responsibilities to private companies (as opposed to government agencies) (which private companies we currently engage for these services), which could adversely affect our business. To the extent that any such new regulations or amendments to existing regulations or policies apply to our activities, those new regulations or amendments to existing regulations would generally increase our costs of compliance.
We are also subject to the rules and regulations of the FCC and similar rules and regulations in foreign countries. For example, as part of our authorization to provide satellite-based Wi-Fi services in our Connectivity segment, we have licenses from the FCC that obligate us to comply with various technical, operational and service requirements specifically identified in such licenses as well as other rules and regulations promulgated by the FCC. Our enterprise Connectivity business could in the future become subject to the laws and regulations in the United States applicable to mass-market retail providers of broadband Internet access services, and pursuant to an agreement with U.S. federal law enforcement agencies, our Connectivity segment operations must comply with the Communications Assistance for Law Enforcement Act of 1994 (“CALEA”), under which communications carriers and some other service providers must ensure that their equipment, facilities and services can accommodate technical capabilities in executing authorized wiretapping and other electronic surveillance. Many non-U.S. countries have similar lawful-intercept requirements. We could be subject to an enforcement action by the FCC and other U.S. and foreign telecommunications regulators or law enforcement agencies for our failure to satisfy any of these laws, regulations and commitments, or these laws and regulations may change in a manner adverse to us. This could subject us to fines, cease and desist orders, loss of licenses and other penalties, as well as increased compliance burdens and costs, all of which could adversely affect our business.
We are also subject to U.S. federal and state and foreign consumer protection requirements, including data privacy and security requirements and restrictions on international personal-data transfers. For example, Section 5 of the Federal Trade Commission (“FTC”) Act prohibits “unfair or deceptive acts or practices in or affecting commerce.” The FTC has brought enforcement actions under the FTC Act against companies that: collect, use, share, or retain personal information in a way that is inconsistent with the representations, commitments, and promises that they make in their privacy policies and other public statements; have privacy policies that do not adequately inform consumers about the company’s actual practices; and/or fail to reasonably protect the security, privacy and confidentiality of nonpublic consumer information. In addition, in mid-2018, the European Union General Data Protection Regulation (“GDPR”) will take full effect, imposing significant personal-data protection requirements on us and many of our customers and restricting the transfer of personal data outside the European Union. We continue to analyze the GDPR in respect of its burden and applicability to our global business operations. We may fail to comply with any of these requirements, and compliance with these requirements may increase our compliance burden and costs.
Adverse decisions or regulations of any of the foregoing U.S. and foreign regulators could negatively impact our operations, increase our costs of doing business and potentially expose us to significant liability. We are unable to predict the scope, pace or financial impact of legal, regulatory and policy changes that could be adopted by those entities.
Regulation by foreign government agencies may increase our costs of providing services or require us to change our services.
Our Connectivity segment is subject to regulation by regulatory agencies and legislative bodies outside the United States where we do, or in the future may do, business. These foreign bodies may require us to obtain certifications for equipment that we install and certain of our operating activities may require that we obtain foreign regulatory certifications as a parts manufacturer. Obtaining these certifications could be an expensive and time-consuming process requiring significant focus and resources. Adverse decisions or regulations of these foreign government agencies could delay the roll-out of our services and have other adverse consequences for us.
Any inability to obtain, delay in obtaining, or change in, needed certifications, authorizations, or approvals, could have an adverse effect on our ability to meet the installation commitments of our Connectivity segment, manufacture and sell parts for installation, or expand our business and could, therefore, materially adversely affect our growth prospects, business and operating results. If we fail to comply with the many foreign regulations and standards that apply to our activities, we could lose the foreign certifications, authorizations or other approvals on which the manufacturing, installation, maintenance, preventive maintenance and alteration capabilities of our Connectivity segment are based. In addition, from time to time, the foreign bodies that regulate our activities may adopt new regulations, amend existing regulations or change their policies, all of which could adversely affect our business. To the extent that any such new regulations or amendments to existing regulations or policies apply to our activities, those new regulations or amendments to existing regulations would generally increase our costs of compliance.
Changes in government regulation of the Internet, including e-commerce or online video distribution, may cause us to change our Connectivity operations and incur greater operating expenses.
The current legal environment for Internet communications, products and services is uncertain and subject to statutory, regulatory or interpretive change. Certain laws and regulations applicable to our Connectivity segment often do not contemplate or address specific issues associated with those technologies, and regulators may disagree with our interpretations of existing laws or regulations or the applicability of existing laws or regulations to our business, and existing laws, regulations and interpretations may change in unexpected ways. We cannot be certain what positions regulators may take regarding our compliance with, or lack of compliance with, current and future legal and regulatory requirements or what positions regulators may take regarding any past or future actions that our Connectivity segment has taken or may take in any jurisdiction. Regulators may determine that we are not in compliance with legal and regulatory requirements, and impose penalties, or we may need to make changes to our connectivity system, which could be costly and difficult. Our failure, or the failure of our vendors and media partners, customers and others with whom we transact business, to comply with legal or regulatory requirements could materially adversely affect our business, financial condition and results of operations.
The international sales and operations of our business are subject to extensive trade, export, anti‑money laundering, foreign corrupt practices and data protection laws.
We must comply with all applicable export control laws and regulations of the United States and other countries. U.S. laws and regulations applicable to it include the Arms Export Control Act, the International Traffic in Arms Regulations (“ITAR”), the Export Administration Regulations (“EAR”) and the trade sanctions laws and regulations administered by the U.S. Department of the Treasury’s Office of Foreign Assets Control (“OFAC”) as well as various anti-bribery, anti-corruption and data privacy laws. The export of certain satellite hardware, services and technical data relating to satellites is regulated by the U.S. Department of State under ITAR. Other items are controlled for export by the U.S. Department of Commerce under the EAR. We cannot provide services to certain countries subject to U.S. trade sanctions unless we first obtain the necessary authorizations from OFAC. In addition, we are subject to the Foreign Corrupt Practices Act, which generally bars bribes or unreasonable gifts to foreign governments or officials. A substantial portion of our business is with airlines and non-governmental organizations, which constitute “government officials” for many anti-bribery laws in many jurisdictions, which could increase the risk of potential anti-corruption compliance issues. Violations of these laws or regulations could result in significant sanctions including fines, onerous compliance requirements, extensive debarments from export privileges or loss of authorizations needed to conduct aspects of our international business. A violation of ITAR or the other regulations described above could materially adversely affect our business, financial condition and results of operations.
As we expand our operations to include a physical international presence, or otherwise expand our collection of personally identifiable information of residents in other countries, we may be subject to the data protection regulations of the relevant countries. On April 27, 2016, the European Union adopted the General Data Protection Regulation (“GDPR”), scheduled to take effect on May 25, 2018, which may result in even more restrictive privacy-related requirements for entities outside the European Union that process personally identifiable information about European data subjects. In addition, certain countries have laws which restrict the transfer of personally identifiable information outside of such countries. For example, both Switzerland and the member states of the European Union impose restrictions on transferring data to countries that they do not deem to offer a similar standard of protection as they require. The United States is a jurisdiction whose processes these countries do not deem adequate for purposes of cross-border personal data transfers.
Certain mechanisms apply under European Union member state laws that permit the cross border transfer of personal information to countries that are not deemed adequate, such as the United States. Global Eagle intends to enter into standard contractual clauses approved by the European Union to legitimize these transfers. There is a risk that these standard contractual clauses may be invalidated by the Court of Justice for the European Union as a lawful data transfer mechanism on the grounds that they do not provide adequate protection of European data subjects’ personally identifiable information. There is also a risk that EU data protection authorities may investigate or bring enforcement actions with criminal and administrative sanctions. Such actions could also damage our business and harm our reputation.
We have been subject to civil stockholder litigation involving allegations that certain of our investor disclosures were false or misleading. We may be subject to additional similar litigation in the future.
We and certain of our former officers and directors were named as defendants in certain purported stockholder class action lawsuits. Specifically, on February 23, 2017 and on March 17, 2017, following the Company’s announcement that it anticipated a delay in its 2016 Form 10-K filing and that its former CEO Dave Davis and former CFO Tom Severson would separate from the Company, three putative securities class action lawsuits were filed in United States District Court for the Central District of California. These lawsuits allege violations of Sections 10(b) and 20(a) of the Securities Exchange Act against the Company, Mr.
Davis, Mr. Severson and Michael Zemetra (who was our CFO prior to Mr. Severson). The plaintiffs voluntarily dismissed two of these lawsuits. The third lawsuit, brought by putative stockholder M&M Hart Living Trust and Randi Williams (the “Hart complaint”), alleges that the Company and the other Defendants made misrepresentations and/or omitted material information about the EMC Acquisition in July 2016, the Company’s projected financial performance and synergies following that acquisition, and the impact of that acquisition on the Company’s internal controls over financial reporting. Plaintiffs seek unspecified damages, attorneys’ fees and costs. On November 2, 2017, the Court granted defendants’ motion to dismiss the Hart complaint, and dismissed the action with prejudice. The plaintiffs may appeal that ruling, and their period in which to appeal has not yet expired.
We incurred costs to defend such lawsuits and may in the future incur additional costs to defend and/or settle similar matters. In addition, although all of these lawsuits have now been dismissed, these rulings remain subject to appeal, and we may be required to pay substantial damages in connection with these matters. Further, these lawsuits (if any rulings are appealed) may divert the attention of our management and consume other resources. Our directors’ and officers’ liability insurance may not be adequate to cover our obligations to indemnify our directors and officers, fund a settlement of these lawsuits or pay an adverse judgment. We are currently unable to estimate the possible loss or possible range of loss, if any, associated with these lawsuits, in part because the outcome of the foregoing ongoing matters is inherently uncertain. An unfavorable outcome from the lawsuits could have a material adverse effect on our consolidated financial position, results of operations, future cash flows or future reputation.
In addition to the lawsuits described above, we and our current and/or former officers and directors may face additional suits from stockholders in the future. Any such suits may similarly cause us to incur substantial costs, result in management distraction, and expose us to significant damages. There can be no assurance that we will prevail in any such litigation, and any adverse outcome of such cases could have a material adverse effect on our reputation, business and results of operations.
Our potential indemnification obligations and limitations of our director and officer liability insurance could result in significant legal expenses or damages and could have a material adverse effect on our reputation, business and results of operations.
Both current and former officers and members of our Board of Directors (the “Board”), as individual defendants, could be the subject of lawsuits related to the Company. Under Delaware law, our bylaws and certain indemnification agreements, we may have an obligation to indemnify both current and former officers and directors in relation to these matters. If the Company incurs significant uninsured indemnity obligations, our indemnity obligations could have a material adverse effect on our reputation, business and results of operations.
Risks Related to Our Indebtedness
Our substantial indebtedness may limit cash flow available to invest in the ongoing needs of our business and subjects us to various reporting and financial covenants that we may be unable to comply with and the failure to remain in compliance with those covenants could adversely affect our business and financial condition.
We currently have a significant amount of indebtedness and could in the future incur additional indebtedness. Our substantial debt combined with our other financial obligations and contractual commitments, as well as significant expenses in connection with our Finance department restructuring and efforts to remediate material weaknesses in our internal control over financial reporting, could have significant adverse consequences on our business. For example:
| |
• | If we fail to meet payment obligations or otherwise default under our debt, the lenders will have the right to accelerate the indebtedness and exercise other rights and remedies against us. We do not expect that we could repay all of our outstanding indebtedness if the repayment of such indebtedness was accelerated. |
| |
• | We are required to comply with financial covenants that require us to maintain maximum leverage ratios which decrease on a quarterly basis. |
| |
• | Our ability to obtain additional financing to fund future working capital needs, capital expenditures, acquisitions, and other general corporate requirements could be limited. If we are unable to raise additional capital if required, it could affect our liquidity, business, financial condition, results of operations, and cash flows. In addition, our ability to borrow additional amounts under our revolving credit facility, which is a significant source of liquidity, is subject to the absence of defaults and our ability to make certain representations and warranties. Failure to meet our borrowing conditions under our revolving credit facility could materially and adversely impact our liquidity. |
| |
• | Our debt imposes operating and financial covenants and restrictions on us, and compliance with such covenants and restrictions may adversely affect our ability to adequately finance our operations or capital needs, pursue attractive |
business opportunities that may arise, redeem or repurchase capital stock, pay dividends, sell assets, and make capital expenditures.
| |
• | Our failure to comply with the covenants in our credit agreement, which include covenants requiring us to timely file our audited and unaudited financial statements, could result in an event of default on our debt. In May, June, September and October 2017, we entered into amendments and limited waivers to our credit agreement due to our inability to timely file this Annual Report on Form 10-K and our Q1 Form 10-Q, Q2 Form 10-Q and Q3 Form 10-Q, resulting in, among other things, additional financial and disclosure covenants under the credit agreement and increased interest costs and amendment fees associated with our debt. Upon an event of default, the lenders of that debt could elect to cause all amounts outstanding with respect to that debt to become immediately due and payable and we would be unable to access our revolving credit facility. An event of default could materially and adversely affect our operating results, financial condition and liquidity. |
| |
• | We could experience increased vulnerability to, and limited flexibility in planning for, or reacting to, changes in or challenges relating to our business and industry, creating competitive disadvantages compared to other competitors with lower debt levels and borrowing costs. |
| |
• | We could experience increased vulnerability to general adverse economic conditions, including increases in interest rates if our borrowings bear interest at variable rates or if such indebtedness is refinanced at a time when interest rates are higher. |
We intend to satisfy our current and future debt service obligations with our existing cash and cash equivalents and marketable securities, and if required, funds from external sources. However, we may not have sufficient funds or may be unable to arrange for additional financing to pay the amounts due under our existing debt. Funds from external sources may not be available on acceptable terms, if at all. In the event of an acceleration of amounts due under our debt instruments as a result of an event of default, including upon a failure to pay any amount due or upon an acceleration event on our other debt instruments (such as on our convertible notes described below), we may not have sufficient funds or may be unable to arrange for additional financing to repay our indebtedness or to make any accelerated payments.
Our ability to make scheduled payments of the principal of, to pay interest on or to refinance our indebtedness depends on our performance, which is subject to economic, financial, competitive and other factors beyond our control. Our business may not generate cash flow from operations in the future sufficient to service our debt and make necessary capital expenditures. If we are unable to generate such cash flow, we may be required to adopt one or more alternatives, such as selling assets, restructuring debt or obtaining additional equity capital on terms that may be onerous or highly dilutive. Our ability to refinance our indebtedness will depend on the capital markets and our financial condition at such time. We may not be able to engage in any of these activities or engage in these activities on desirable terms, which could result in a default on our debt obligations.
In addition, we may incur substantial additional indebtedness in the future, which could cause the related risks to intensify. We may need to refinance all or a portion of our indebtedness on or before their respective maturities. We cannot assure you that we will be able to refinance any of our indebtedness on commercially reasonable terms or at all. The terms of any new debt may also impose additional and more stringent restrictions on our operations than are currently in place.
We may not have the ability to repay the principal amount of our convertible notes at maturity, to raise the funds necessary to settle conversions of our convertible notes or to repurchase our convertible notes upon a fundamental change or on specified repurchase dates, and the agreements governing our future indebtedness may contain limitations on our ability to repurchase our convertible notes.
As of September 30, 2017, we had outstanding approximately $82.5 million in aggregate principal amount of 2.75% Convertible Senior Notes due 2035 (the “convertible notes”). At maturity, the entire outstanding principal amount of our convertible notes will become due and payable by us. Upon the occurrence of a fundamental change (including among other things, if our common stock ceases to be listed or quoted on Nasdaq) or upon each of February 20, 2022, February 22, 2025 and February 22, 2030, holders of convertible notes will also have the right to require us to repurchase all or a portion of their convertible notes at a repurchase price equal to 100% of the principal amount of our convertible notes to be repurchased, plus accrued and unpaid interest, if any. In addition, upon conversion of our convertible notes, unless we elect to deliver solely shares of our common stock to settle such conversion (other than paying cash in lieu of delivering any fractional share), we will be required to make cash payments in respect of our convertible notes being converted. However, we may not have sufficient funds or be able to obtain financing at the time we are required to repay the principal amount of our convertible notes, make repurchases of our convertible notes or settle conversions of our convertible notes. In addition, our ability to repurchase our convertible notes may be limited by law, regulatory action or agreements governing our indebtedness.
Furthermore, certain transactions or events that would give holders of our convertible notes the right to put our convertible notes back to us or to convert our convertible notes with an increased conversion rate may constitute events of default under our credit agreement. Our failure to repay the principal amount of our convertible notes, repurchase convertible notes at a time when the repurchase is required by the indenture (including, among other things, if our common stock ceases to be listed or quoted on Nasdaq), or to settle conversions of our convertible notes would constitute a default under the indenture. A default under the indenture or the fundamental change itself could also lead to a default under our other debt agreements (such as our credit agreement) or agreements governing our future indebtedness. If the repayment of the related indebtedness were to be accelerated after any applicable notice or grace periods, we may not have sufficient funds to repay the indebtedness and repurchase our convertible notes or make cash payments upon conversion thereof.
The conditional conversion feature of our convertible notes, if triggered, may adversely affect our financial condition and operating results.
In the event the conditional conversion feature of our convertible notes is triggered (including, among other things, if our common stock ceases to be listed or quoted on Nasdaq), holders of convertible notes will be entitled to convert our convertible notes at any time during specified periods at their option. If one or more holders elect to convert their convertible notes, unless we elect to satisfy our conversion obligation by delivering solely shares of our common stock (other than cash in lieu of any fractional share), we would be required to settle a portion or all of our conversion obligation through the payment of cash, which could adversely affect our liquidity. In addition, even if holders do not elect to convert their convertible notes, we could be required under applicable accounting rules to reclassify all or a portion of the outstanding principal of the notes as a current rather than long-term liability, which may result in a material reduction of our net working capital.
The accounting method for convertible debt securities that may be settled in cash could have a material adverse effect on our reported financial results.
Under Accounting Standards Codification 470-20, Debt with Conversion and Other Options, or ASC 470-20, we are required to separately account for the liability and equity components of our convertible notes because they may be settled entirely or partially in cash upon conversion in a manner that reflects our economic interest cost. The effect of ASC 470-20 on the accounting for our convertible notes is that the equity component is required to be included in the additional paid-in capital section of stockholders’ equity on our Consolidated Balance Sheets, and the value of the equity component would be treated as original issue discount for purposes of accounting for the debt component of our convertible notes. As a result, we will be required to record a greater amount of non-cash interest expense in current period presented as a result of the amortization of the discounted carrying value of our convertible notes to their face amount over the term of our convertible notes. We will report lower net income in our financial results because ASC 470-20 will require interest to include both the current period’s amortization of the debt discount and the instrument’s coupon interest, which could adversely affect our reported or future financial results, the trading price of our common stock and the trading price of our convertible notes.
In addition, because our convertible notes may be settled entirely or partly in cash, under certain circumstances, our convertible notes are currently accounted for utilizing the treasury stock method, the effect of which is that the shares issuable upon conversion of our convertible notes are not included in the calculation of diluted earnings per share except to the extent that the conversion value of our convertible notes exceeds their principal amount. Under the treasury stock method, for diluted earnings per share purposes, the transaction is accounted for as if the number of shares of common stock that would be necessary to settle such excess, if we elected to settle such excess in shares, are issued. We cannot be sure that the accounting standards in the future will continue to permit the use of the treasury stock method. If we are unable to use the treasury stock method in accounting for the shares issuable upon conversion of our convertible notes, then our diluted earnings per share would be adversely affected.
The fundamental change repurchase feature of the indenture governing our convertible notes may increase the price of or prevent an otherwise beneficial takeover attempt of us.
The indenture governing our convertible notes requires us to repurchase our convertible notes for cash upon the occurrence of a fundamental change and, in certain circumstances, to increase the conversion rate for a holder that converts its notes in connection with a make-whole fundamental change. A takeover may trigger the requirement that we repurchase our convertible notes and/or increase the conversion rate, which could make it more costly for a potential acquirer to engage in a combinatory transaction with us. Such additional costs may have the effect of preventing a Company takeover that would otherwise be beneficial to investors.
Conversion of our convertible notes may dilute the ownership interest of our existing stockholders, including holders who had previously converted their notes, or may otherwise depress the price of our common stock.
The conversion of some or all of our convertible notes will dilute the ownership interests of existing stockholders to the extent we deliver shares upon conversion of any of our convertible notes. Any sales in the public market of the common stock issuable upon such conversion or any anticipated conversion of our convertible notes into shares of our common stock could adversely affect prevailing market prices of our common stock. In addition, the existence of our convertible notes may encourage short selling by market participants because the conversion of our convertible notes could be used to satisfy short positions.
Risks Related to Our Common Stock
We are currently not compliant with Nasdaq rules. Although Nasdaq has granted us an extension to become compliant, if we are unable to satisfy the terms of that extension, Nasdaq may determine to delist our common stock. A delisting would give rise to a repurchase obligation under the indenture for our convertible notes and could have an adverse impact on the trading volume, liquidity and market price of our common stock.
Beginning in May 2017, we received several notifications from the Listing Qualifications Department of The Nasdaq Stock Market LLC stating that we are in continued noncompliance with Nasdaq Listing Rule 5250(c)(1) because we have not yet filed our Quarterly Reports on Form 10-Q for the fiscal quarter ended March 31, 2017 and for the fiscal quarter ended June 30, 2017 (the “2017 Quarterly Reports”) and remained delinquent in filing our 2016 Form 10-K. We expect to receive a similar non-compliance notice in November 2017 in respect of our Quarterly Report on Form 10-Q for the fiscal quarter ended September 30, 2017. Following discussions with Nasdaq, we were given an extension until September 12, 2017 to make these filings. When we failed to do so by that deadline, the Listing Qualifications Department sent us a notice (on September 13, 2017) that it had determined to delist our securities. We had an appeals hearing before a Nasdaq Hearings Panel relating to this determination on October 26, 2017, and on November 3, 2017, Nasdaq granted our requested extension to regain compliance with its listing rules. Under the extension, we had until November 30, 2017 to file this Form 10-K and now have until January 31, 2018 to file our Quarterly Reports on Form 10-Q for the quarterly periods ended March 31, June 30, and September 30, 2017. If we are unable to meet these extended deadlines for our Quarterly Reports on Form 10-Q, or due to any other non-compliance with Nasdaq rules, then Nasdaq may decide to delist our securities.
If our common stock ceases to be listed or quoted on Nasdaq, this would constitute a “fundamental change”, as defined in the indenture governing our convertible notes, pursuant to which the holders of convertible notes would have the right to require us to repurchase all or a portion of their convertible notes at a repurchase price equal to 100% of the principal amount of our convertible notes to be repurchased. We may not have sufficient funds or be able to obtain financing if we are required to repurchase the convertible notes, which could cause us to default under the indenture. A default under the indenture would also cause a default under our credit agreement, which could cause all outstanding indebtedness under our credit agreement to become immediately due and payable.
In addition, a delisting and/or trading suspension of our securities from Nasdaq would negatively impact us because it could, among other things: (i) reduce the liquidity and market price of our common stock; (ii) reduce the number of investors willing to hold or acquire our common stock, which could negatively impact our ability to raise equity financing; (iii) limit our ability to use a registration statement to offer and sell freely tradable securities, thereby preventing us from accessing the public capital markets; (iv) impair our ability to provide liquid equity incentives to our employees; and (v) have negative reputational impact for us with our customers, suppliers, employees and other persons with whom we transact from time to time.
The delayed filing of some of our periodic SEC reports has made us currently ineligible to use a registration statement on Form S-3 to register the offer and sale of securities, which could adversely affect our ability to raise future capital or complete acquisitions.
As a result of the delayed filing of our periodic reports with the SEC, we will not be eligible to register the offer and sale of our securities using a registration statement on Form S-3 until late 2018, at the earliest. Should we wish to register the offer and sale of our securities to the public prior to the time we are eligible to use Form S-3, both our transaction costs and the amount of time required to complete the transaction could increase, making it more difficult to execute any such transaction quickly and successfully, and as a result potentially harming our financial condition.
The interests of our largest stockholders may conflict with our interests and the interests of our other stockholders.
Based on the information available to us, PAR Investment Partners, L.P. (“PAR”) beneficially owned approximately 31.9% of our outstanding common stock as of October 31, 2017, and was our largest stockholder on that date; entities affiliated with ABRY Partners beneficially owned approximately 10.6% of our outstanding common stock as of that date; and entities affiliated with Frontier Capital Management Co. beneficially owned approximately 8.3% of our outstanding common stock as of that date. As such, our shares are highly concentrated within a limited group of institutional stockholders. Our largest stockholders may have the ability to influence the election of our directors and the outcome of corporate actions of the Company requiring stockholder approval, including approval of significant corporate transactions. This concentration of ownership may have the effect of delaying or preventing a change in control and might adversely affect the market price of our common stock. The interests of these stockholders may conflict with our interests or those of other stockholders.
The market price of our securities may be volatile and may decline as a result of a number of factors, some of which are beyond our control.
The trading price of our securities could be volatile and subject to wide fluctuations in response to various factors, some of which are beyond our control. Any of the factors listed below could have a material adverse effect on an investment in our securities, and our securities may trade at prices significantly below the price that you paid for them. In such circumstances, the trading price of our securities may not recover and may experience a further decline. Due to various factors, the trading price of our securities over the last 24 months has experienced a notable decline. Factors that may affect the trading price of our securities in the future may include:
| |
• | our inability to timely file our SEC reports; |
| |
• | our material weaknesses in our internal controls; |
| |
• | actual or anticipated fluctuations in our financial results or the financial results of companies perceived to be similar to us; |
| |
• | changes in the market’s expectations about our operating results; |
| |
• | our inability to consummate beneficial investment and M&A transactions, including due to our inability to obtain any required regulatory or national security approvals; |
| |
• | our operating results failing to meet the expectation of securities analysts or investors in a particular period; |
| |
• | changes in financial estimates and recommendations by securities analysts concerning the Company, the market for in-flight entertainment, the airline industry, or the travel market in general; |
| |
• | operating and stock price performance of other companies that investors deem comparable to us; |
| |
• | our ability to market new and enhanced products on a timely basis; |
| |
• | changes in laws and regulations affecting our business or our industry; |
| |
• | commencement of, or involvement in, litigation involving the Company; |
| |
• | changes in our capital structure, such as future issuances of securities or the incurrence of additional debt; |
| |
• | the volume of shares of our common stock available for public sale; |
| |
• | any major change in our Board or management; and |
| |
• | sales of substantial amounts of common stock by our directors, executive officers or significant stockholders or the perception that such sales could occur. |
The trading market for our common stock will be influenced by the research and reports that industry or securities and credit-ratings analysts may publish about us, our business, our market, or our competitors. If insufficient securities or industry analysts cover us, our stock price and trading volume would likely be negatively impacted. If any of the analysts covering us change their recommendation regarding our stock adversely, or provide more favorable relative recommendations about our competitors, the price of our common stock would likely decline. If any analyst who covers us were to cease coverage of us or fail to regularly publish reports on us, we could lose visibility in the financial markets, which in turn could cause our stock price or trading volume to decline.
Warrants currently exercisable for our common stock could significantly increase the number of shares eligible for future resale in the public market and result in dilution to our stockholders.
Outstanding warrants purchasing an aggregate of 6,173,228 shares of our common stock are exercisable for a like number of shares of our common stock. These warrants have a five-year term and will expire in January 31, 2018. The exercise price of these warrants is $11.50 per share. To the extent that such warrants are exercised, additional shares of our common stock will be issued, which will result in dilution to the holders of common stock of the Company and increase the number of shares eligible for resale in the public market. Sales of substantial numbers of such shares in the public market could adversely affect the market price of our common stock.
We have the ability to redeem outstanding warrants at any time prior to their expiration, at a price of $0.01 per warrant, provided that the last reported sales price of the common stock equals or exceeds $17.50 per share for any 20 trading days within a 30-trading-day period ending on the third trading day prior to proper notice of such redemption, provided that on the date we give notice of redemption and during the entire period thereafter until the time that we redeem the warrants, we have an effective registration statement under the Securities Act of 1933 (the “Securities Act”) covering the shares of common stock issuable upon exercise of the warrants and a current prospectus relating to them is available. A registration statement covering the shares of common stock issuable upon exercise of the warrants was declared effective by the SEC on August 22, 2013, but has been suspended due to our failure to be current in our periodic reporting obligations. If and when the warrants become redeemable by us, we may exercise our redemption right even if we are unable to register or qualify the underlying securities for sale under all applicable state securities laws. Redemption of the outstanding warrants could force warrant holders (i) to exercise warrants and pay the exercise price therefor at a time when it may be disadvantageous to do so, (ii) to sell warrants at the then-current market price when a holder might otherwise wish to hold such warrants or (iii) to accept the nominal redemption price which, at the time the outstanding warrants are called for redemption, is likely to be substantially less than the market value of such holder’s warrants.
In addition, the warrant agreement for the warrants provides that the terms thereof may be amended without the consent of any holder to cure any ambiguity or correct any defective provision, but requires the approval by the holders of at least 65% of the then outstanding warrants sold as part of the units in our initial public offering to make any change that adversely affects the interests of the registered holders. Accordingly, we may amend the terms of the warrants in a manner adverse to a holder if holders of at least 65% of the then outstanding warrants sold as part of the units in our initial public offering approve of such amendment. Although our ability to amend the terms of the warrants with the consent of at least 65% of the then outstanding warrants is unlimited, examples of such amendments could be amendments to, among other things, increase the exercise price of the warrants, shorten the exercise period or decrease the number of shares of our common stock purchasable upon exercise of a warrant.
Anti-takeover provisions contained in our certificate of incorporation and bylaws, as well as provisions of Delaware law, could impair a takeover attempt.
Our charter and bylaws contain provisions that could have the effect of delaying or preventing changes in control or changes in our management without the consent of our Board. These provisions include:
| |
• | a classified Board with three-year staggered terms, which may delay the ability of stockholders to change the membership of a majority of our Board; |
| |
• | no cumulative voting in the election of directors, which limits the ability of minority stockholders to elect director candidates; |
| |
• | the exclusive right of our Board to elect a director to fill a vacancy created by the expansion of the Board or the resignation, death, or removal of a director, which prevents stockholders from being able to fill vacancies on our Board; |
| |
• | the ability of our Board to determine to issue shares of preferred stock and to determine the price and other terms of those shares, including preferences and voting rights, without stockholder approval, which could be used to significantly dilute the ownership of a hostile acquirer; |
| |
• | a prohibition on stockholder action by written consent, which forces stockholder action to be taken at an annual or special meeting of our stockholders; |
| |
• | the requirement that an annual meeting of stockholders may be called only by the chairman of the Board, the chief executive officer, or the Board, which may delay the ability of our stockholders to force consideration of a proposal or to take action, including the removal of directors; |
| |
• | limiting the liability of, and providing indemnification to, our directors and officers; |
| |
• | controlling the procedures for the conduct and scheduling of stockholder meetings; |
| |
• | providing the Board with the express power to postpone previously scheduled annual meetings of stockholders and to cancel previously scheduled annual meetings of stockholders; |
| |
• | providing that directors may be removed prior to the expiration of their terms by stockholders only for cause; and |
| |
• | advance notice procedures that stockholders must comply with in order to nominate candidates to our Board or to propose matters to be acted upon at a stockholders’ meeting, which may discourage or deter a potential acquirer from conducting a solicitation of proxies to elect the acquirer’s own slate of directors or otherwise attempting to obtain control of the Company. |
These provisions, alone or together, could delay hostile takeovers and changes in control of the Company or changes in our management.
As a Delaware corporation, we are also subject to provisions of Delaware law, including Section 203 of the DGCL, which prevents some stockholders holding more than 15% of our outstanding common stock from engaging in certain business combinations without approval of the holders of substantially all of the Company’s outstanding common stock. Any provision of our certificate of incorporation or bylaws or Delaware law that has the effect of delaying or deterring a change in control could limit the opportunity for our stockholders to receive a premium for their shares of our common stock, and could also affect the price that some investors are willing to pay for our common stock.
We may issue additional equity or convertible debt securities in the future, which may result in additional dilution to investors.
To the extent that any of our convertible notes are converted into shares of common stock or we need to raise additional capital in the future and we issue additional shares of common stock or securities convertible or exchangeable for our common stock, our then existing stockholders may experience dilution and the new securities may have rights senior to those of our common stock offered. In addition, to the extent we settle the conversion of the convertible notes with shares of our common stock, such conversion would be dilutive to our current stockholders. The conversion of a significant amount of our convertible notes, if settled in shares, could cause a decline in the market price of our common stock, which could adversely affect your ability to sell your shares in the market or our ability to raise capital in the future or both. Our charter authorizes our Board to issue one or more series of preferred stock and set the terms of the preferred stock without seeking any further approval from our stockholders. Any preferred stock that is issued may rank ahead of our common stock in terms of dividends, liquidation rights or voting rights. If we issue preferred stock, it may adversely affect the market price of our common stock.
ITEM 1B. UNRESOLVED STAFF COMMENTS
None.
ITEM 2. PROPERTIES
The following table sets forth certain information concerning our principal properties related to our Connectivity and Media & Content segments and our administrative functions (“Corporate”) as of December 31, 2016. We own and lease facilities in the U.S. and abroad. We believe that our facilities are well maintained and are sufficient to meet our current and projected needs.
|
| | | | | | | |
Location | | Segment(s) | | Square Footage | | Description / Lease Expiration Date |
Los Angeles, CA, USA | | Corporate/Media & Content | | 19,730 |
| | Leased office space / May 31, 2017 (1) |
Lombard, IL, USA | | Connectivity | | 23,320 |
| | Leased office space / February 28, 2025 |
Irvine, CA, USA | | Media & Content | | 22,000 |
| | Leased office space / June 30, 2020 |
Montréal, QC, Canada | | Media & Content/Connectivity | | 22,305 |
| | Leased office space / June 30, 2025 |
London, United Kingdom | | Media & Content | | 14,500 |
| | Leased office space / March 24, 2017 (2) |
Mumbai, India | | Media & Content | | 13,278 |
| | Leased office space / 95 year lease, 85 years remaining |
Knutsford, United Kingdom | | Media & Content | | 13,533 |
| | Owned building / mortgage to be paid off in 2032 |
Raisting, Germany | | Connectivity | | 120,000 |
| | Owned teleport facility / no mortgage |
Kapolei, HI, USA | | Connectivity | | 113,118 |
| | Leased teleport facility / July 31, 2019 |
Holmdel, NJ, USA | | Connectivity | | 114,913 |
| | Leased teleport facility / December 31, 2023 |
Miramar, FL, USA | | Connectivity | | 59,367 |
| | Leased office space / December 31, 2017 |
| |
(1) | The Company exited this office space in May 2017, and signed a new lease agreement in April 2017 for a 21,312 square-foot office space in Los Angeles, CA expiring in July 2022. |
| |
(2) | The Company exited this office space in September 2016, and signed a new lease agreement in September 2016 for a 9,550 square-foot office space in London, United Kingdom, expiring in September 2026. |
ITEM 3. LEGAL PROCEEDINGS
ITEM 4. MINE SAFETY DISCLOSURES
None.
PART II
ITEM 5. MARKET FOR REGISTRANT’S COMMON EQUITY, RELATED STOCKHOLDER MATTERS AND ISSUER PURCHASES OF EQUITY SECURITIES
Market Information
Our common stock is traded on the Nasdaq Capital Market (“Nasdaq”) under the symbol “ENT.”
The following table sets forth, for the period indicated and on a per-share basis, the high and low closing prices of our common stock as reported by Nasdaq.
|
| | | | | | | |
Year Ended December 31, 2016 | High | | Low |
Fourth Quarter | $ | 9.65 |
| | $ | 6.15 |
|
Third Quarter | $ | 9.13 |
| | $ | 6.61 |
|
Second Quarter | $ | 9.00 |
| | $ | 6.18 |
|
First Quarter | $ | 10.40 |
| | $ | 7.94 |
|
| | | |
Year Ended December 31, 2015 | High | | Low |
Fourth Quarter | $ | 13.74 |
| | $ | 9.70 |
|
Third Quarter | $ | 13.36 |
| | $ | 10.77 |
|
Second Quarter | $ | 14.23 |
| | $ | 12.26 |
|
First Quarter | $ | 15.74 |
| | $ | 12.95 |
|
Holders of Record
As of October 31, 2017, there were 90,743,565 shares of our common stock outstanding, which were held by approximately 94 stockholders of record, as reported by our transfer agent (excluding 3,053,634 shares of common stock held by our wholly-owned subsidiary). The number of holders of record does not include a substantially greater number of “street name” holders or beneficial holders of our common stock whose shares are held of record by banks, brokers and other financial institutions.
Dividend Policy
We have never declared or paid cash dividends on our common stock. We currently do not anticipate paying any cash dividends in the foreseeable future. Instead, we anticipate that all of our earnings on our common stock will be used to provide working capital to support our operations and to finance the growth and development of our business. Any future determination to declare cash dividends will be made at the discretion of our Board and will depend on our financial condition, any limitations contained in agreements governing our indebtedness, results of operations, capital requirements, general business conditions and other factors that our Board may deem relevant.
Purchases of Equity Securities by the Issuer and Affiliated Purchasers
We did not purchase any of our equity securities in the fourth quarter of 2016.
Securities Authorized for Issuance Under Equity Compensation Plans
Recent Sales of Unregistered Securities; Use of Proceeds from Registered Offerings
None.
Performance Graph
The following graph and table show comparison of the cumulative total stockholder return on Global Eagle’s common stock with the cumulative total return of the Russell 2000 Index and the Standard & Poor’s 500 Stock Index (S&P 500 Index) for the five years ended December 31, 2016. The graph and table assume that $100 was invested on the last day of trading for the fiscal year December 31, 2011 in Global Eagle's common stock, the Russell 2000 Index, and the S&P 500 Index, and that all dividends were reinvested.
Comparison of Five-Year Cumulative Return for Global Eagle, the Russell 2000 Index and the S&P 500 Index
|
| | | | | | | | | | | | | | | | | | | | | | | |
| December 31, |
| 2011 | | 2012 | | 2013 | | 2014 | | 2015 | | 2016 |
Global Eagle Entertainment Inc. | $ | 100.00 |
| | $ | 103.64 |
| | $ | 154.57 |
| | $ | 141.48 |
| | $ | 102.60 |
| | $ | 67.15 |
|
Russell 2000 Index | $ | 100.00 |
| | $ | 114.63 |
| | $ | 157.05 |
| | $ | 162.60 |
| | $ | 153.31 |
| | $ | 183.17 |
|
S&P 500 Index | $ | 100.00 |
| | $ | 113.41 |
| | $ | 146.98 |
| | $ | 163.72 |
| | $ | 162.53 |
| | $ | 178.02 |
|
The material in this performance graph is not soliciting material, is not deemed filed with the SEC, and is not incorporated by reference in any filing of the Company under the Securities Act or the Securities Exchange Act of 1934, as amended (the “Exchange Act”), whether made on, before or after the date of this filing and irrespective of any general incorporation language in such filing.
ITEM 6. SELECTED FINANCIAL DATA
The Consolidated Statements of Operations data for the years ended December 31, 2016, 2015, 2014, 2013, and 2012 and the Consolidated Balance Sheet data as of December 31, 2016, 2015, 2014, 2013, and 2012 are derived from our audited consolidated financial statements included in Item 15. Exhibits and Financial Statement Schedules and previous Annual Reports on Form 10-K. See the explanatory notes to the table for further information.
The historical results presented below are not necessarily indicative of financial results to be achieved in future periods, and certain prior year amounts have been reclassified to conform to the current year presentation. The following selected financial data should be read in conjunction with Item 7. Management's Discussion and Analysis of Financial Condition and Results of Operations and our consolidated financial statements and the related notes included elsewhere in this Form 10-K (in thousands, except per share amounts):
|
| | | | | | | | | | | | | | | | | | | |
| Year Ended December 31, |
| 2016 (1) | | 2015 (2) | | 2014 (3) | | 2013 (4) | | 2012 (5) (6) |
Consolidated Statement of Operations Data: | | | | | | | | | |
Revenue | $ | 529,755 |
| | $ | 426,030 |
| | $ | 387,735 |
| | $ | 259,722 |
| | $ | 69,210 |
|
Operating expenses: | | | | | | | | | |
Cost of sales | 365,470 |
| | 279,156 |
| | 281,873 |
| | 197,938 |
| | 76,897 |
|
Sales and marketing expenses | 30,941 |
| | 17,705 |
| | 13,287 |
| | 10,330 |
| | 3,935 |
|
Product development | 37,718 |
| | 28,610 |
| | 23,010 |
| | 9,068 |
| | 2,646 |
|
General and administrative (7) | 115,195 |
| | 77,715 |
| | 69,743 |
| | 70,629 |
| | 14,534 |
|
Provision for legal settlements (7) | 43,446 |
| | 4,250 |
| | 8,030 |
| | — |
| | — |
|
Amortization of intangible assets | 35,648 |
| | 26,994 |
| | 24,552 |
| | 17,281 |
| | 34 |
|
Goodwill impairment (8) | 64,000 |
| | — |
| | — |
| | — |
| | — |
|
Restructuring charges | — |
| | 411 |
| | 4,223 |
| | — |
| | — |
|
Total operating expenses | 692,418 |
| | 434,841 |
| | 424,718 |
| | 305,246 |
| | 98,046 |
|
Loss from operations | (162,663 | ) | | (8,811 | ) | | (36,983 | ) | | (45,524 | ) | | (28,836 | ) |
Other income (expense): | | | | | | | | | |
Interest (expense) income, net | (18,198 | ) | | (2,492 | ) | | 88 |
| | (2,417 | ) | | (10,368 | ) |
Income (loss) from equity method investments (9) | 3,829 |
| | — |
| | (1,500 | ) | | — |
| | — |
|
Change in fair value of derivatives | 25,515 |
| | 11,938 |
| | (6,955 | ) | | (63,961 | ) | | (3,576 | ) |
Other expense, net (9) | (6,326 | ) | | (1,140 | ) | | (1,270 | ) | | (1,000 | ) | | (23 | ) |
Loss before income taxes | (157,843 | ) | | (505 | ) | | (46,620 | ) | | (112,902 | ) | | (42,803 | ) |
Income tax (benefit) expense | (44,911 | ) | | 1,621 |
| | 10,574 |
| | 1,839 |
| | — |
|
Net loss | (112,932 | ) | | (2,126 | ) | | (57,194 | ) | | (114,741 | ) | | (42,803 | ) |
Net income attributable to noncontrolling interest | — |
| | — |
| | 194 |
| | 290 |
| | — |
|
Net loss attributable to Global Eagle Entertainment Inc. common stockholders | $ | (112,932 | ) | | $ | (2,126 | ) | | $ | (57,388 | ) | | $ | (115,031 | ) | | $ | (42,803 | ) |
| | | | | | | | | |
Net loss per share: | | | | | | | | | |
Basic | $ | (1.39 | ) | | $ | (0.03 | ) | | $ | (0.78 | ) | | $ | (2.17 | ) | | $ | (2.24 | ) |
Diluted | $ | (1.39 | ) | | $ | (0.18 | ) | | $ | (0.78 | ) | | $ | (2.17 | ) | | $ | (2.24 | ) |
| | | | | | | | | |
Weighted average shares outstanding: | | | | | | | | | |
Basic | 81,269 |
| | 77,558 |
| | 73,300 |
| | 53,061 |
| | 19,148 |
|
Diluted | 81,269 |
| | 78,394 |
| | 73,300 |
| | 53,061 |
| | 19,148 |
|
|
| | | | | | | | | | | | | | | | | | | |
| December 31, |
| 2016 (1) | | 2015 (2) | | 2014 (3) | | 2013 (4) | | 2012 (5) (6) |
Consolidated Balance Sheet Data: | | | | | | | | | |
Cash and cash equivalents and marketable securities | $ | 50,686 |
| | $ | 223,552 |
| | $ | 197,648 |
| | $ | 258,796 |
| | $ | 2,088 |
|
Working capital (10) | $ | (7,537 | ) | | $ | 193,293 |
| | $ | 146,028 |
| | $ | 169,558 |
| | $ | (3,799 | ) |
Total assets (11) | $ | 1,099,435 |
| | $ | 637,861 |
| | $ | 533,595 |
| | $ | 578,883 |
| | $ | 29,437 |
|
Long term liabilities (10) | $ | 539,301 |
| | $ | 118,185 |
| | $ | 46,654 |
| | $ | 39,577 |
| | $ | 3,111 |
|
Total stockholders' equity | $ | 298,997 |
| | $ | 353,761 |
| | $ | 312,629 |
| | $ | 356,184 |
| | $ | 1,417 |
|
| |
(1) | The presented financial information as of and for the year ended December 31, 2016 includes the financial information and activities of EMC (Maritime & Land Connectivity segment) for the period July 27, 2016 to December 31, 2016. |
| |
(2) | The presented financial information as of and for the year ended December 31, 2015 includes the financial information and activities of Western Outdoor Interactive Private Limited (“WOI”) (now part of our Media & Content segment) and certain assets and assumed certain liabilities of RMG Networks Holding Corporation (“RMG”) (now part of our Media & Content segment) for the period July 1, 2015 to December 31, 2015 and Marks Systems, Inc. (or “masFlight”) and NavAero Holding AB (“navAero”) (now part of our Aviation Connectivity segment) for the period August 6, 2015 to December 31, 2015. |
| |
(3) | The presented financial information as of and for the year ended December 31, 2014 includes the financial information and activities of Purple Inflight Entertainment Private Ltd. (“Purple Inflight Entertainment” or “Purple”) (now part of our Media & Content segment) for the period from August 2, 2014 to December 31, 2014. |
| |
(4) | The presented financial information as of and for the year ended December 31, 2013 includes the financial information and activities of Row 44 (Aviation Connectivity segment) for the period January 1, 2013 to December 31, 2013 as well as the financial information and activities of the Company and AIA (Media & Content segment) for the period January 31, 2013 to December 31, 2013, Post Modern Edit, LLC and related entities (PMG) (now part of our Media & Content segment) for the period July 9, 2013 to December 31, 2013 and Travel Entertainment Group Equity Limited and subsidiaries (“IFES”) (now part of our Media & Content segment) for the period October 18, 2013 to December 31, 2013. |
| |
(5) | Row 44 was the accounting acquirer in our business combination with Row 44 and Advanced Inflight Alliance AG completed on January 31, 2013. As a result, the presented financial information as of and for the year ended December 31, 2012 reflects the financial information and activities only of Row 44. |
| |
(6) | On January 31, 2013 and in conjunction with our business combination with Row 44 and Advanced Inflight Alliance AG, Row 44 common stock $0.0001 par value per share was converted into Global Eagle Entertainment Inc. common stock par value $0.0001 per share. Immediately prior to that business combination, Row 44’s proportional adjustment to the existing conversion ratios for each series of preferred stock outstanding was effected in January 2009. Accordingly, the share and per share amounts for 2012 presented herein have been adjusted retrospectively to reflect the respective exchange ratios. For details on the Row 44 share conversion to Global Eagle common stock, refer to the Company’s definitive proxy statement on Schedule 14A filed with the SEC on January 17, 2013. |
| |
(7) | General and Administrative expenses for years preceding December 31, 2016, where applicable, have been adjusted to reflect the reclassification of the provision for legal settlements to a separate line item to conform to the presentation for the year ended December 31, 2016. |
| |
(8) | Subsequent to December 31, 2016, the Company recognized goodwill impairment preliminarily estimated between $75 million and $80 million during the quarter ended March 31, 2017. |
| |
(9) | Other expense, net for the year ended December 31, 2014 has been adjusted to reflect the reclassification of losses from an equity method investment to a separate line item to conform to the presentation for the year ended December 31, 2016. |
| |
(10) | During the fourth quarter of 2015, the Company elected to early-adopt the provision of ASU No. 2015-17, Income Taxes (Topic 740): Balance Sheet Classification of Deferred Taxes, which simplified the presentation of deferred income taxes by requiring deferred tax assets and liabilities be classified as non-current on the balance sheet. Since this standard was adopted prospectively, the working capital balances for year-end periods preceding December 31, 2015 include the current portion of deferred tax assets and liabilities. The net current deferred tax asset position included above was $4,639 and $2,060 as of December 31, 2014 and 2013, respectively. There was no deferred tax working capital balance as of December 31, 2012. |
During 2016, the presentation of content library was reclassified from current assets to non-current assets. Accordingly, working capital balances as of December 31, 2015, 2014 and 2013 have been adjusted to conform to the December 31, 2016 presentation. This reclassification did not affect the December 31, 2012 working capital balance.
| |
(11) | Total assets and total liabilities as of December 31, 2015 have been adjusted retrospectively to reflect our adoption of Financial Accounting Standards Board Accounting Standards Update (“ASU”) No. 2015-03, Interest - Imputation of Interest: Simplifying the Presentation of Debt Issuance Costs, in the first quarter of 2016. This ASU requires debt issuance costs related to a recognized debt liability to be presented in the balance sheet as a direct deduction from the carrying amount of that debt liability, consistent with the treatment of debt discount. The adoption of this standard did not affect year end periods presented above preceding December 31, 2015. |
ITEM 7. MANAGEMENT’S DISCUSSION AND ANALYSIS OF FINANCIAL CONDITION AND RESULTS OF OPERATIONS
The following discussion and analysis of our business, financial condition and results of operations for the year ended December 31, 2016, and our financial conditions at that date, should be read in conjunction with the consolidated financial statements and the notes thereto included in Item 15. Exhibits and Financial Statement Schedules of this Form 10-K. This discussion contains forward-looking statements that reflect our plans, estimates and beliefs and involve numerous risks and uncertainties, including, but not limited to, those described in the “Risk Factors” section of this Form 10-K. Actual results may differ materially from those contained in any forward-looking statements. You should carefully read the “Cautionary Note Regarding Forward-Looking Statements” and “Risk Factors” sections of this Form 10-K.
Overview of the Company
We are a leading provider of satellite-based connectivity and media to fast-growing, global mobility markets across air, sea and land. Our principal operations and decision-making functions are located in North America, South America and Europe. Following the EMC Acquisition, we managed and reported our businesses in three operating segments: Media & Content, Aviation Connectivity and Maritime & Land Connectivity. Accordingly, our financial statements for the fiscal year ended December 31, 2016, and as well as this discussion and analysis, were prepared based on these three operating segments. Our chief operating decision maker regularly reviews our operating results by our operating segments, principally to make decisions about how we allocate our resources and to measure our segment and consolidated operating performance. During the second quarter of 2017, following changes in our senior management (including our chief operating decision maker) and organizational changes across our business, we reorganized our business into two operating segments: Media & Content and Connectivity. Our chief operating decision maker determined this was appropriate based on the similarities and synergies between our Aviation Connectivity and Maritime & Land Connectivity segments relating to satellite bandwidth and equipment used in such businesses as well as on our restructured reporting lines across all of our business departments. See Part I. Introductory Note – Our Operating Segments and Note 16. Segment Information to our consolidated financial statements included in Item 15. Exhibits and Financial Statement Schedules for further discussion on our operating segments.
We generate revenue primarily through licensing and related services from our Media & Content segment and from the delivery of satellite-based Internet service and content to the aviation, maritime and land markets and the sale of equipment to airlines from our prior Aviation Connectivity and Maritime & Land Connectivity segments. Our chief operating decision maker regularly analyzes revenue and profit on a segment basis, and our results of operations and pre-tax income or loss on a consolidated basis in order to understand the key business metrics driving our business. Accordingly, we report revenue and contribution profit for 2016 for our three segments separately.
For the years ended December 31, 2016, 2015, and 2014, we reported consolidated revenue of $529.8 million, $426.0 million and $387.7 million, respectively. For the years ended December 31, 2016, 2015, and 2014, our Media & Content segment accounted for 60%, 72% and 72% of our total revenue, respectively, our Aviation Connectivity segment accounted for 26%, 28% and 28%, respectively, and our Maritime & Land Connectivity segment accounted for 14%, 0% and 0%, respectively. For the years ended December 31, 2016, 2015, and 2014, one airline customer, Southwest Airlines, accounted for 22%, 23% and 24% of our consolidated revenue, respectively.
2016 Transactions
In March 2016, our Board of Directors authorized a stock repurchase program under which the Company may repurchase up to $50.0 million of its common stock. During the three months ended June 30, 2016, we repurchased 0.6 million shares of our common stock for an aggregate consideration of $5.2 million. As of December 31, 2016, the remaining authorization under the stock repurchase plan was $44.8 million.
On July 27, 2016, we acquired EMC. The aggregate purchase price was $100.5 million in cash; $40.6 million of the Company’s common stock issued at closing; $25 million in deferred consideration that could be settled in July 2017 in cash, common stock or a combination thereof at the Company’s election (and which was ultimately settled in July 2017 by the issuance of 5.1 million shares of our common stock); plus $0.2 million for the settlement of a pre-existing relationship with an EMC subsidiary. We also assumed approximately $370.8 million of EMC indebtedness. EMC, which became our Maritime & Land Connectivity segment in 2016, is a communications services provider that offers land-based sites and marine vessels globally a multimedia platform delivering communications, Internet, live television, on-demand video, voice, and backhaul services. EMC leverages its satellite-terrestrial-cellular broadband network with fully meshed MPLS interconnected teleports. EMC has a portfolio of patented
technologies. EMC owns and operates its own ground infrastructure and global field support centers, permitting EMC to deploy support to customers around the world.
On November 8, 2016, we entered into an investment agreement (the “Investment Agreement”) with Shareco Group of America, Inc. (“Shareco”), which is a subsidiary of HNA Group, and certain affiliates of Shareco, to sell approximately 9.9% of our common stock to Shareco (the “Initial Investment”) for $11.00 per share subject to satisfaction of customary closing conditions (including regulatory approvals). The parties also negotiated a term sheet that contemplated negotiation of definitive documentation for additional purchases of the Company’s common stock by Shareco and the formation of a joint venture to provide in-flight connectivity and passenger monetization services to HNA Group-affiliated airlines. On July 25, 2017, the Company and Shareco terminated the Investment Agreement as a result of the parties’ inability to obtain the required approval of the Committee on Foreign Investment in the United States (“CFIUS”) prior to the outside date under the Investment Agreement. As a result of this termination, the other related agreements that we entered into in connection with the Investment Agreement were also terminated in accordance with their terms.
Basis of Presentation
The financial statements are presented on a consolidated basis. In addition, we provide a brief description of significant transactions and events that have an impact on the comparability of the results being analyzed. The financial information presented for the year ended December 31, 2016 includes the financial information and activities of EMC from the acquisition date to December 31, 2016 and therefore is only partially comparable to the financial information for the years ended December 31, 2015 and 2014. The financial information presented for the year ended December 31, 2015 includes the financial information and activities of Western Outdoor Interactive Private Limited (“WOI”) (acquired in July 2015), certain assets and assumed liabilities of RMG Networks Holding Corporation (“RMG”) (also acquired in July 2015), Marks Systems, Inc. (or “masFlight”) and navAero Holding AB (“navAero”) (both acquired in August 2015) and therefore is only partially comparable to the financial information for the year ended December 31, 2014. The impact of these transactions on comparability should be taken in account when reading the discussion and analysis of our results of operations and cash flows. Furthermore, the presented financial information for the years ended December 31, 2016, 2015 and 2014 also reflect other one-time costs that are directly associated with the business combinations discussed herein.
Opportunities, Challenges and Risks
We believe our operating results and performance are driven by various factors that affect the commercial travel industry and the mobility markets serving hard-to-reach places on land, sea and in the air. These include general macroeconomic trends affecting the mobility markets, such as travel and maritime trends affecting our target user base, regulatory changes, competition and the rate of customer adoption of our services as well as factors that affect Wi-Fi Internet service providers in general. Growth in our overall business is principally dependent upon the number of customers that purchase our services, our ability to negotiate favorable economic terms with our customers and partners and the number of travelers who use our services. Growth in our margins is dependent on our ability to manage the costs associated with implementing and operating our services, including the costs of licensing and distributing content, equipment and satellite service. Our ability to attract and retain customers is highly dependent on our ability to timely implement our services and continually improve our network and operations as technology changes and we experience increased network capacity constraints.
As technology continues to evolve, we believe there are opportunities to expand our services by adding more content in a greater variety of formats. During 2016, our former Aviation Connectivity, Maritime & Land Connectivity and Media & Content segments were separate platforms, which we reorganized in 2017 into our Connectivity and Media & Content segments. We believe there is an opportunity to diversify our revenue long term by cross leveraging the services of these segments, including offering a greater variety of premium paid content across our Connectivity platform. For example, the EMC Acquisition in July 2016 expanded our Connectivity offerings and offered us the ability to provide more content to the maritime and land mobility verticals. Conversely, the evolution of technology presents an inherent risk to our business because our current technology may become obsolete, too expensive and/or outdated.
With respect to our Media & Content segment, its growth is dependent upon a number of factors, including the growth of IFE systems, our customers' demand for content and games across global mobility markets, the general availability of content to license from our studio partners, pricing from our competitors and our ability to manage the underlying economics of content licensing by studio. We believe that the amount of IFE systems and customer demand for content and games will continue to grow in the foreseeable future.
In our aviation connectivity business, the use of our connectivity equipment on our customers’ aircraft is subject to regulatory approvals, such as a Supplemental Type Certificate, or “STC,” that are imposed by agencies such as the Federal Aviation
Administration (“FAA”), the European Aviation Safety Agency (“EASA”) and the Civil Aviation Administration of China (“CAAC”). The costs to obtain and/or validate an STC can be significant and vary by plane type and customer location. We have STCs to operate our equipment on several plane types, including Boeing’s 737, 757, 767 and 777 families, and for the Airbus A320 family. While we believe we will be successful in obtaining STC approvals in the future as needed, there is a risk that the FAA, EASA or CAAC do not approve or validate an STC on a timely basis, if at all, which could negatively impact our growth, relationships and ability to sell our connectivity services. To partially address the risk and costs of obtaining STCs in the future, we signed an agreement with Boeing to offer our connectivity equipment on a “line-fit basis” for Boeing’s 737 MAX and 787 models, and our connectivity equipment became available on a line-fit basis in August 2017 as an option on new Boeing 737 MAX airplanes. We also expect to undertake similar line-fit initiatives with other aircraft manufacturers such as Airbus in the near term. As a result, we expect to continue to incur significant product development expenses in the foreseeable future as we invest in these long-term line-fit opportunities, which we believe will improve our long-term ability to onboard our connectivity equipment on new plane types in a more scalable and cost-effective manner.
Our Connectivity segment is significantly dependent on satellite-capacity providers for satellite bandwidth and certain equipment and servers required to deliver the satellite stream, rack space at the supplier's data centers to house the equipment and servers and network operations service support. Through the EMC Acquisition, we expanded the number of our major suppliers of satellite capacity and became a party to an agreement with Intelsat. We also purchase radomes, satellite antenna systems and rings from “sole source” suppliers. Any interruption in supply from these important vendors could have a material impact on our ability to provide connectivity services to our customers.
The growth of our Connectivity segment is dependent upon a number of factors, including the rates at which we grow the number of installed connectivity systems from new and existing customers, customer demand for connectivity services, government regulations and approvals, customer adoption, growth, take rates (or overall usage of our connectivity services by end-users), the general availability and pricing of satellite bandwidth globally, pricing pressures from our competitors, general travel industry trends, new and competing connectivity technologies and our ability to manage the underlying economics of connectivity services on a global basis.
Our cost of sales, the largest component of our operating expenses, varies from period to period, particularly as a percentage of revenue, based upon the mix of the underlying equipment and service revenue we generate. Cost of sales also varies period to period as we acquire new customers and to accommodate the growth of our Connectivity segment. During 2016, we continued to increase our investment in satellite capacity over North America and the Middle East to facilitate the growth of our existing and new connectivity customer base, which included purchases of satellite transponders. Depending on the timing of our satellite expenditures, our cost of sales as a percentage of our revenue may fluctuate from period to period.
For the three years in the period ended December 31, 2016, a substantial amount of our former Aviation Connectivity segment’s revenue was derived from Southwest Airlines, a U.S. based airline. In December 2016, we entered into a new contract with Southwest Airlines that extends the term of services through 2025, and includes a commitment for live television services. Through 2017, we have continued to install our connectivity systems on additional Southwest Airlines aircraft. Under the new contract, we committed to deploy new service capacity and our patented technology to deliver a significantly enhanced passenger experience. Starting July 1, 2017, we transitioned to a monthly recurring charge revenue model that provides long-term revenue visibility. The new contract also provides for additional rate cards for ancillary services and the adoption of a fleet management plan.
We plan to further expand our connectivity operations internationally to address opportunities in non-U.S. markets. As we expand our business further internationally in places such as the Middle East, Asia Pacific and Latin America, we will continue to incur significant incremental upfront expenses associated with these growth opportunities.
Our Maritime & Land business, which contributed approximately 26% of our consolidated revenue for the fourth quarter of 2016, has recently experienced a challenged business environment and difficulty in achieving its business objectives. Specifically, that business faces increased competition in some geographies and vertical markets in which parts of the business operate, operational impediments relating to delayed new deal executions and slower than anticipated installations and upgrades, and difficulties in timely achieving acquisition synergies. As a result, during the fourth quarter of 2016 and first quarter of 2017, we recorded non-cash charges related to the impairment of goodwill in our former Maritime & Land Connectivity segment. Since then, we made substantial efforts to achieve acquisition synergies by consolidating our Aviation and Maritime & Land Connectivity segments, appointing new management to the business unit, and formalizing our engineering and program management functions to accelerate deal execution.
We also must expend significant time and resources remediating material weaknesses in our internal controls over financial reporting. These weaknesses relate to our entity level control environment, financial statement close and reporting process, intercompany process, business combination, significant and unusual non-routine transactions, inventory, content library, internally developed software, long lived assets, goodwill impairment, accounts payable and accrued liabilities, revenue processes, license fee accruals, income taxes, payroll, stock-based compensation, treasury, and information technology processes. We are strongly committed to addressing these material weaknesses, which we believe will strengthen our business. But, if we are unable to establish and maintain effective internal control over financial reporting, we may be unable to timely identify and forecast certain business trends and certain aspects of our financial performance, and our ability to focus on and execute our business objectives.
Key Components of Consolidated Statements of Operations
The following briefly describes certain key components of revenue and expenses as presented in our Consolidated Statements of Operations.
Revenue
Following the EMC Acquisition in July 2016, we derived our revenue from three operating segments: Media & Content, Aviation Connectivity and Maritime & Land Connectivity. As discussed above, during the second quarter of 2017, following changes to our senior management (including our chief operating decision maker) and organizational changes throughout our business, we reorganized our business into two operating segments: Media & Content and Connectivity.
Media & Content Segment Revenue
A significant amount of our Media & Content revenue is generated from licensing of acquired and third party media content, video and music programming, applications, and video games to the mobility industry, and to a lesser extent from services ranging from selection, purchase, production, customer support and technical adjustment of content in connection with the integration and servicing of programming for our customers. Our Media & Content licensing revenue is based upon individual licensing agreements with customers to deliver and air content over specified terms. Media & Content services revenue, such as technical services, the encoding of video products, development of graphical interfaces or the provision of materials, is priced on specific services contracted for and recognized as services are performed.
Aviation Connectivity and Maritime & Land Connectivity Segments Revenue
We currently generate our Aviation Connectivity revenue through the sale of equipment and through our satellite-based Internet and related service offerings. Our equipment revenue is based on the sale and corresponding support of our connectivity equipment to our commercial airline customers. Our service revenue is based on the fees paid by customers and/or their passengers for the delivery of in-flight services, such as Internet access and live television, and to a lesser extent from revenue sharing arrangements with customers for Internet based services used by their passengers, such as shopping.
Where we enter into revenue sharing arrangements with our customers, and we act as the principal, we report the underlying revenue on a gross basis in our Consolidated Statements of Operations, and record the revenue-sharing payments in costs of sales. In determining whether to report revenue gross for the fees received from our customers, we assess whether we are the primary obligor, have general inventory risk, bear credit risk and have latitude in establishing prices with the airlines.
Included in our connectivity service revenue are periodic service level credits, which vary from customer to customer and are based on the contracted service levels we provide over any given period.
For our Maritime & Land Connectivity segment, we provide integrated data, voice, Internet and data center services to companies and organizations globally where terrestrial communications infrastructure is poor or nonexistent. Our services are typically contracted with the customers for a monthly recurring charge (“MRC”). Through our Maritime Telecommunications Network business, we provide our customers with communication, entertainment, and networking services including private network solutions, passenger, administrative and crew telephone services, full-time dedicated data circuits, full-time voice and fax services, stored value telephone access cards, and Internet cafe solutions. Our Maritime & Land Connectivity segment services primarily cruise ship, energy, commercial shipping, government and non-governmental organizations, yacht, mobile network operators and enterprise industries.
Operating Expenses
Operating expenses consist of cost of sales, sales and marketing expenses, product development, general and administrative, provision for legal settlements, amortization of intangible assets and restructuring charges. Included in our operating expenses are stock based compensation and depreciation expenses associated with our capital expenditures.
Cost of Sales
Media & Content Segment Cost of Sales
Media & Content segment cost of sales principally consists of licensing fees paid to acquire content rights for the airline industry, and to a lesser extent service and personnel costs to support our content business.
Aviation Connectivity and Maritime & Land Connectivity Segments Cost of Sales
Aviation Connectivity and Maritime & Land Connectivity segments cost of sales consists of the costs of our services and equipment.
Services. Service costs of sales principally consist of the costs of satellite service and support, revenue recognized by us and shared with others as a result of our revenue-sharing arrangements, Internet connection and co-location charges and other platform operating expenses including depreciation of the systems and hardware used to build and operate our platform; and personnel costs related to our network operations, customer service and information technology. As we continue to build out our connectivity services platform and expand our satellite coverage globally, including due to the EMC Acquisition, we anticipate that our service costs will increase when compared to historical periods. Our services cost of sales are dependent on a number of factors, including the amount of satellite coverage and bandwidth required to operate our services and the number of partners with whom we share our corresponding revenue.
Equipment. Equipment costs of sales are substantially comprised of the costs we pay to third parties to acquire our equipment orders, and are originally classified as inventories on our Consolidated Balance Sheet upon receipt of goods. Upon sale, equipment costs of sales are recorded when title and risk of loss pass to the customer, which is aligned with our equipment revenue recognition.
Sales and Marketing
Sales and marketing expenses consist primarily of sales and marketing personnel costs, sales support, public relations, advertising, marketing and general promotional expenditures. Fluctuations in our sales and marketing expenses are generally the result of our efforts to support the growth in our businesses, including expenses required to support the expansion of our direct sales force. With the EMC Acquisition and as we continue to grow our sales and marketing organizations and invest in marketing activities to support the growth of our businesses, we anticipate that our sales and marketing expenses will continue to increase.
Product Development
Product development expenses consist primarily of expenses incurred in our software engineering, product development and web portal design activities and related personnel costs. Fluctuations in our product development expenses are generally the result of hiring personnel to support and develop our platform, including the costs to further develop our Connectivity segment platform, timing and scope of our STC efforts, new connectivity product offerings, expenses associated with line-fit offerability and network operations. We currently anticipate that our product development expenses will continue to increase as we hire more product development personnel and further develop our products and offerings to support the growth of our business. However, we anticipate to realize future synergies savings as a result of the completion of our business integration projects following the EMC acquisition.
General and Administrative
General and administrative expenses consist primarily of personnel costs from our executive, legal, finance, human resources and information technology organizations and facilities related expenditures, as well as third party professional fees, insurance and bad debt expenses. Professional fees are largely comprised of outside legal, accounting and information technology consulting services. We currently anticipate that our general and administrative expenses will continue to increase in the near term due to increased finance and accounting professional fees associated with the EMC Acquisition and our Finance department restructuring and remediation efforts relating to our material weaknesses. However, we expect such increases to be partially offset by savings resulting from the completion of our business integration projects following the EMC acquisition.
Provision for Legal Settlements
During the year ended December 31, 2016, the Company incurred charges aggregating to $43.4 million as Provision for legal settlements. This included $38.6 million to settle litigation with major record labels relating to sound recording liabilities, which we refer in this Form 10-K from time to time to as our “Sound-Recording Settlements.” In addition, in October 2016, the Company entered into a settlement agreement with American Airlines pursuant to which the Company paid approximately $3.7 million to settle its outstanding litigation with American Airlines. (This litigation was also related to our sound-recording liabilities.) The remaining $1.1 million reflected in the Provision for legal settlements includes charges for other loss contingencies.
Amortization of Intangible Assets
The Company determines the appropriate useful life of intangible assets by performing an analysis of expected cash flows based on its historical experience of intangible assets of similar quality and value. With the increase in identifiable intangible assets from the EMC Acquisition in July 2016 and the acquisitions made in the second half of 2015, we expect amortization expense to increase in the near term. Amortization as a percentage of revenue will depend upon a variety of factors, such as the amounts and mix of our identifiable intangible assets acquired in business combinations and the amount of our revenue.
Goodwill Impairment
In connection with our annual goodwill impairment test during the fourth quarter of 2016, we concluded that the carrying value of goodwill associated with the Maritime & Land Connectivity reporting unit exceeded its implied fair value. As a result, we recorded a goodwill impairment of $64.0 million in the fourth quarter of 2016. The implied fair value declined due to our reduced financial projections for the reporting unit as a result of, among other things: lower than expected actual financial results from this business due to margin compression resulting from competition in our cellular backhaul land business in Africa, resulting in diminished financial performance relative to our original expectations; delayed new deal executions and slower than anticipated installations and upgrades, also resulting in diminished financial performance relative to our original expectations; and operational challenges in integrating a legacy EMC acquiree in 2015 into this reporting unit, resulting in delayed acquisition synergies. Given the foregoing, we determined there was greater uncertainty in achieving our prior financial projections and so applied a higher discount rate for purposes of our goodwill impairment analysis. The higher discount rate affected the fair value of the Maritime & Land Connectivity reporting unit.
In addition, for the quarter ended March 31, 2017, we expect to record an additional non-cash goodwill impairment charge of between $75.0 and $80.0 million related to this segment. This additional impairment is due to continuing challenges in the business operations at this segment as well as delay in realizing our expected synergies, which resulted in lower results than the projections as of December 31, 2016. We determined that there is a higher degree of uncertainty in achieving our financial projections and as such, increased our discount rate, which reduced the fair value of the Maritime & Land Connectivity reporting unit. Also, the adoption of ASU 2017-04, Intangibles-Goodwill and Others (Topic 350): Simplifying the Test for Goodwill Impairment, changed the measurement of the goodwill impairment which increased the impairment. We have not closed our books for any periods subsequent to December 31, 2016. As stated above, we expect to have a significant impairment during the quarter ended March 31, 2017, and we may have additional impairment charges in later periods after completing our impairment assessments for these periods.
Restructuring Charges
During the third quarter ended September 30, 2014, we implemented a plan to improve operational efficiencies, which included the closure of our German-based operations and facilities, centralization of our international financial operations, and realignment of our international and U.S. tax structure (the “Restructuring Plan”). During 2014, in conjunction with the Restructuring Plan, we committed to a reduction in force. We completed the implementation of our Restructuring Plan before the end of 2015 and incurred a total of $4.6 million of restructuring charges, including:
| |
(1) | $2.7 million total expenses relating to employee termination benefits, which primarily included severance and transitional-related expenses. |
| |
(2) | $0.4 million of facilities disposal charges in connection with the closure of our German operation. Pursuant to the Restructuring Plan, we exited approximately 11,000 square feet of leased facilities in Duisburg and Munich, Germany, representing approximately 6% of our global facilities square footage. |
| |
(3) | $1.5 million of legal and professional fees. |
Stock-Based Compensation
Included in our operating expenses are expenses associated with stock-based compensation, which are allocated and included in cost of sales, sales and marketing, product development and general and administrative expenses as necessary. Stock-based compensation expense is largely comprised of costs associated with stock options and restricted stock units granted to our directors, employees and consultants. We record the fair value of these equity-based awards and stock-based compensation expenses at their cost ratably over related vesting periods. In addition, stock-based compensation expense includes the cost of options to purchase common stock issued to certain senior non-employees and resources.
As of December 31, 2016, we had approximately $23.1 million of unrecognized employee related stock-based compensation, net of estimated forfeitures, which we expect to recognize over a weighted average period of approximately 2.70 years. Stock-based compensation expense is expected to increase throughout 2017 compared to 2016 as a result of additional stock-based awards that we expect to issue to continue to attract and retain employees and non-employee directors.
Other Income (Expense)
Other income (expense) principally consists of the following:
| |
• | Interest income expense (net) – interest expense on outstanding debt, net of interest earned on cash balances and short-term investments. We typically invest our available cash balances in money market funds and short-term United States Treasury obligations; |
| |
• | Income from equity method investments acquired in the 2016 EMC Acquisition; |
| |
• | Changes in the fair value of our derivative financial instruments; and |
| |
• | Other expense, net – primarily comprised of certain unrealized transaction gains and losses on foreign currency denominated assets and liabilities, which fluctuates depending upon movements in underlying currency exchange rates, primarily movement of the U.S. dollar against the Euro, Pound Sterling and Canadian dollar. |
Provision for Income Taxes
We have been subject to income taxes principally in the United States since inception. With the acquisitions of AIA, PMG and IFES in 2013, WOI and navAero in 2015 and EMC in 2016, we have a legal presence in various countries, including Germany, the United Kingdom, the Netherlands, Sweden, Norway, Spain, Canada, China, India, Hong Kong, the United Arab Emirates, Argentina, Brazil, Kenya, Singapore, Australia, New Zealand, Luxembourg and South Africa. We anticipate that as we continue to expand our operations outside the United States, we will become subject to additional taxation based on foreign statutory rates and our effective tax rate could fluctuate accordingly.
Income taxes are computed using the asset and liability method, under which deferred tax assets and liabilities are determined based on the difference between the financial statement and tax bases of assets and liabilities using enacted tax rates in effect for the year in which the differences are expected to affect taxable income. Valuation allowances are established when necessary to reduce deferred tax assets to the amount expected to be realized.
We recognize the tax benefit from an uncertain tax position only if it is more likely than not that the tax position will be sustained upon examination by the taxing authorities based on the technical merits of the position. The tax benefit recognized in the financial statements for a particular tax position is based on the largest benefit that is more likely than not to be realized. The amount of unrecognized tax benefits (“UTB”) is adjusted as appropriate for changes in facts and circumstances, such as significant amendments to existing tax law, new regulations or interpretations by the taxing authorities, new information obtained during a tax examination, or resolution of an examination. We recognize both accrued interest and penalties associated with uncertain tax positions as a component of Income tax (benefit) expense in our Consolidated Statements of Operations.
We currently believe that based on the available information, it is more likely than not that some of our deferred tax assets will not be realized, and accordingly we have recorded a valuation allowance against certain of our federal, state and foreign deferred tax assets. As of December 31, 2016 and 2015 we had approximately $152.7 million and $91.9 million, respectively, of federal operating loss carry-forward and $84.9 million and $40.5 million, respectively, of state operating loss carry-forward available to offset future taxable income which expire in varying amounts beginning in 2026 for federal and 2017 for state purposes if unused. In addition, we had foreign net operating losses carryforward from various jurisdictions of $56.4 million and $44.9 million as of December 31, 2016 and 2015, respectively. Federal and state laws impose substantial restrictions on the utilization of net operating loss and tax credit carry-forwards in the event of an “ownership change,” as defined in Section 382 of the Internal Revenue Code of 1986, as amended, or the Internal Revenue Code. Currently, we expect the utilization of our net operating loss and tax credit carry-forwards in the near term to be affected by certain limitations placed on these carry-forwards as a result of our previous ownership changes with PAR, our largest stockholder. We have determined that $2.7 million of our net operating losses will expire because of the annual limitation.
Critical Accounting Policies and Estimates
Our consolidated financial statements are prepared in accordance with accounting principles generally accepted in the United States. The preparation of these consolidated financial statements requires us to make estimates and assumptions that affect the reported amounts of assets, liabilities, revenue, expenses and related disclosures. We evaluate our estimates and assumptions on an ongoing basis. Our estimates are based on historical experience and various other assumptions that we believe to be reasonable under the circumstances. Our actual results could differ from these estimates.
We believe that the assumptions and estimates associated with our revenue recognition, allowance for doubtful accounts, the assigned value of acquired tangible and intangible assets and assumed and contingent liabilities associated with business combinations, provision for legal settlements, valuation of media content library and equipment inventory, useful lives and impairment of property and equipment, intangible assets, goodwill and other assets, the fair value of the Company's equity-based compensation awards and convertible debt instruments, and valuation of deferred income tax assets and liabilities, have the greatest potential impact on our consolidated financial statements. Therefore, we consider these to be our critical accounting policies and estimates.
Revenue Recognition
We recognize revenue when persuasive evidence of a sales arrangement exists, the services have been rendered or goods have been delivered, the sales price is fixed or determinable, and collectability is reasonably assured. If any of these criteria are not met, revenue recognition is deferred until such time as all of the criteria are met. We consider persuasive evidence of a sales arrangement to be the receipt of a signed contract or purchase order. Collectability is assessed based on a number of factors, including transaction history and the creditworthiness of a customer. If it is determined that collection is not reasonably assured, revenue is not recognized until collection becomes reasonably assured, which is generally upon receipt of cash.
For arrangements with multiple deliverables, we allocate revenue to each deliverable if the delivered item(s) has value to the customer on a standalone basis and, if the arrangement includes a general right of return relative to the delivered item, delivery or performance of the undelivered item(s) is considered probable and substantially in our control. The fair value of the selling price for a deliverable is determined using a hierarchy of (1) Company-specific objective and reliable evidence, then (2) third-party evidence, then (3) best estimate of selling price. We allocate any arrangement fee to each of the elements based on their relative selling prices.
When we enter into revenue sharing arrangements where we act as the principal, we recognize the underlying revenue on a gross basis. In determining whether to report revenue gross for the fees received from its customers, we assess whether we are the primary obligor, responsible for fulfillment, have generally inventory risk, bear credit risk and have latitude in establishing prices with our customers, among other factors.
Our revenue is principally derived from the following services:
Media & Content
Licensing and Service Revenue.
Content licensing revenue is principally generated through the sale or license of media content, video and music programming, applications and video games to customers in the aviation, maritime and non-theatrical markets, and to a lesser extent through various services such as encoding and editing of media content. Revenue from the sale or license of content is recognized when the content has been delivered and the contractual performance obligations have been fulfilled, generally at the time a customer's license period begins. In certain cases, we estimate licensing revenue from customers typically for revenue which is based on usage, including fees based on number of flights or number of aircraft or pay-per-view. We believe that we have the ability to reasonably estimate the amounts that will ultimately be collected and therefore recognize these amounts when earned.
Content services, such as technical services, delivery of digital media advertising, the encoding of video and music products, development of graphical interfaces or the provision of materials, are billed and revenue is recognized as services are performed and/or when the committed advertisement impressions have been delivered. Obligations pursuant to our advertising revenue arrangements typically include a minimum number of impressions or the satisfaction of other performance criteria. Revenue from performance-based arrangements is recognized as the related performance criteria are met. We assess whether performance criteria have been met and whether the fees are fixed or determinable based on a reconciliation of the performance criteria and an analysis of the payment terms associated with the transaction. The reconciliation of the performance criteria generally includes a comparison of third-party performance data to the contractual performance obligation and to internal or customer performance data in circumstances where that data is available. Where we enter into revenue-sharing arrangements with our customers, such as those relating to advertising, and when we are considered the principal, we report the underlying revenue on a gross basis in our Consolidated Statements of Operations, and record these revenue-sharing payments to our customers in service costs.
Aviation Connectivity and Maritime & Land Connectivity
Licensing and Service Revenue.
Licensing and service revenue includes satellite-based Internet services, live television, on-demand content, music streaming, shopping and click-through advertising revenue from travel-related information. Service revenue is recognized after the service has been rendered and the customer can use such service, which customarily is in the form of (i) enplanement for boarded passengers, (ii) the number of passengers that use our service, depending upon the specific customer contract, and/or (iii) other revenue such as advertising sponsorship. We assess whether performance criteria have been met and whether our service fees are fixed or determinable based on a reconciliation of the performance criteria and an analysis of the payment terms associated with the customer transaction. The reconciliation of the performance criteria generally includes a comparison of third-party performance data to the contractual performance obligation and to internal or customer performance data in circumstances where that data is available.
In certain cases, we record service revenue based on available and preliminary information from our network operations. Amounts collected on the related receivables may vary from reported information based upon third party reported amounts owed that typically occurs within thirty days of the end of the period end. For all periods presented, the difference between the amounts recognized based on preliminary information and cash collected was not material.
Equipment revenue.
Equipment revenue is recognized when title and risk pass to the buyer, which is generally upon shipment or arrival at destination depending on the contractual arrangement with the customer. In determining whether an arrangement exists, we ensure that a binding arrangement is in place, such as a purchase order or a fully executed customer-specific agreement. In cases where a customer has the contractual ability to return equipment within a specific time frame, we will provide for return reserves when and if (based upon historical experience) necessary. We generally believe the acceptance clauses in our contracts are perfunctory and will recognize revenue upon shipment provided that all other criteria have been met including delivery of the Supplemental Type Certificates (“STC”). In certain cases where we sell our equipment to an aviation customer on a stand-alone basis, we may charge a fee for obtaining the STC from the FAA, which allow our equipment to operate on certain model/type of aircraft. To the extent that we contract to charge STC fees in equipment-only sales, we will record these fees as revenue.
Allowance for Doubtful Accounts
We extend credit to our customers. An allowance for doubtful accounts is maintained for estimated losses resulting from the inability of our customers to make required payments. Management specifically analyzes the age of customer balances, historical
bad debt experience, customer credit-worthiness, and changes in customer payment terms when making estimates of the collectability of our trade accounts receivable balances. If we determine that the financial condition of any of our customers has deteriorated, whether due to customer specific or general economic issues, an increase in the allowance may be made. After all attempts to collect a receivable have failed, the receivable is written off.
The Assigned Value of Acquired Tangible and Intangible Assets and Assumed and Contingent Liabilities Associated with Business Combinations
We account for acquisitions of businesses using the acquisition method of accounting where the cost is allocated to the underlying net tangible and intangible assets acquired, based on their respective estimated fair values. The excess of the purchase price over the estimated fair values of the net assets acquired is recorded as goodwill. Determining the fair value of certain acquired assets and liabilities is subjective in nature and often involves the use of significant estimates and assumptions, including, but not limited to, the selection of appropriate valuation methodology, projected revenue, expenses and cash flows, weighted average cost of capital, discount rates, estimates of advertiser and publisher turnover rates and estimates of terminal values. Additionally, any non-controlling interests in an acquired business are recorded at their acquisition date fair values. Business acquisitions are included in our consolidated financial statements as of the date of the acquisition.
Provision for Legal Settlements
We are involved in a number of legal proceedings concerning matters arising in connection with the conduct of our business activities and from stockholders regarding alleged material misstatements and omissions regarding our business and performance. Many of these proceedings are at preliminary stages and/or seek an indeterminate amount of damages. We regularly evaluate the status of the legal proceedings in which we are involved to (i) assess whether a material loss is probable or there is at least a reasonable possibility that a material loss or an additional material loss in excess of a recorded accrual may have been incurred and (ii) determine if accruals are appropriate. We record an accrual for litigation and other loss contingencies when we determine that a material loss is probable and the amount of the loss can be reasonably estimated. If accruals are not appropriate, we further evaluate each legal proceeding to assess whether an estimate of possible loss or range of loss can be made. There can be no assurance that legal proceedings against us will be resolved in amounts that will not differ from the amounts of our recorded accruals. Legal fees and other costs of defending litigation are charged to expense as incurred.
Valuation of Content Library and Equipment Inventory
The content library is periodically tested for impairment, but no less than annually. The marketability of the individual film right can determine whether an impairment loss is necessary. If the estimated future cash flows for an individual film right are lower than its carrying amount as of the reporting date, an impairment loss is recognized in such period.
We provide equipment inventory write-downs based on excess and obsolete inventories determined primarily by future demand forecasts. The write-down is measured as the difference between the cost of the inventory and market, based upon assumptions about future demand and charged to the provision for inventory, which is a component of cost of goods sold. At the point of the loss recognition, a new, lower cost basis for that inventory is established, and subsequent changes in facts and circumstances do not result in the restoration or increase in that newly established cost basis.
Useful Lives and Impairment of Property and Equipment, Intangible Assets, Goodwill and Other Assets
We perform valuations of assets acquired and liabilities assumed on each acquisition accounted for as a business combination, and allocate the purchase price of each acquired business to its respective net tangible and intangible assets. Acquired intangible assets principally comprise of customer relationships and technology. We determine the appropriate useful life by performing an analysis of expected cash flows based on historical experience of the acquired businesses. Intangible assets are amortized over their estimated useful lives using the straight-line method, which approximates the pattern in which the majority of the economic benefits is expected to be consumed.
Goodwill represents the excess of the cost of an acquired entity over the fair value of the acquired net assets. Goodwill is not amortized, and is instead tested for impairment when events or circumstances change that would indicate that goodwill might be impaired. Events or circumstances that could trigger an impairment review include, but are not limited to, a significant adverse change in legal factors or in the business climate, an adverse action or assessment by a regulator, unanticipated competition, a loss of key personnel, significant changes in the manner of our use of the acquired assets or the strategy for our overall business, significant negative industry or economic trends or significant under-performance relative to expected historical or projected future results of operations.
Goodwill is tested for impairment at the reporting unit level, which is one level below or the same as an operating segment. Following the EMC Acquisition in July 2016, we managed and reported our businesses in three reporting units, Media & Content, Aviation Connectivity and Maritime & Land Connectivity. When testing goodwill for impairment, we first perform a qualitative assessment to determine whether it is necessary to perform step one of a two-step annual goodwill impairment test for each reporting unit. We are required to perform step one only if we conclude that it is more likely than not that a reporting unit's fair value is less than its carrying value. If this is the case, the first step of the two-step process is to identify whether a potential impairment exists by comparing the estimated fair values of our reporting units with their respective book values, including goodwill. If the estimated fair value of the reporting unit exceeds book value, goodwill is considered not to be impaired, and no additional steps are necessary. If, however, the fair value of the reporting unit is less than book value, then the second step is performed to measure the amount of impairment loss, if any. The amount of the impairment loss is the excess of the carrying amount of the goodwill over its implied fair value. The estimate of implied fair value of goodwill is primarily based on an estimate of the discounted cash flows expected to result from that reporting unit, but may require valuations of certain internally generated and unrecognized intangible assets such as our software, technology, patents and trademarks. If the carrying amount of goodwill exceeds the implied fair value of that goodwill, an impairment loss is recognized in an amount equal to the excess.
We evaluate the recoverability of our long-lived assets with finite useful lives for impairment when events or changes in circumstances indicate that the carrying amount of an asset group may not be recoverable. Such trigger events or changes in circumstances may include: a significant decrease in the market price of a long-lived asset, a significant adverse change in the extent or manner in which a long-lived asset is being used, a significant adverse change in legal factors or in the business climate, including those resulting from technology advancements in the industry, the impact of competition or other factors that could affect the value of a long-lived asset, a significant adverse deterioration in the amount of revenue or cash flows we expect to generate from an asset group, an accumulation of costs significantly in excess of the amount originally expected for the acquisition or development of a long-lived asset, current or future operating or cash flow losses that demonstrate continuing losses associated with the use of a long-lived asset, or a current expectation that, more likely than not, a long-lived asset will be sold or otherwise disposed of significantly before the end of its previously estimated useful life. We perform impairment testing at the asset group level that represents the lowest level for which identifiable cash flows are largely independent of the cash flows of other assets and liabilities. If events or changes in circumstances indicate that the carrying amount of an asset group may not be recoverable and the expected undiscounted future cash flows attributable to the asset group are less than the carrying amount of the asset group, an impairment loss equal to the excess of the asset's carrying value over its fair value is recorded. Fair value is determined based upon estimated discounted future cash flows. Assets to be disposed of would be separately presented on the Consolidated Balance Sheets and reported at the lower of their carrying amount or fair value less costs to sell, and would no longer be depreciated or amortized.
The Fair Value of Our Equity-Based Compensation Awards and Convertible Debt Instruments
Stock-based compensation cost is measured at the grant date based on the fair value of the award and is recognized as an expense over the requisite service period, which is the vesting period, on a straight-line basis. We use the Black-Scholes option pricing model to determine the grant date fair value of stock options. This model requires us to estimate the expected volatility and the expected term of the stock options, which are highly complex and subjective variables. The variables take into consideration, among other things, actual and projected employee stock option exercise behavior. We use an expected volatility of our stock price during the expected life of the options that is based on the historical performance of our stock price as well as including an estimate using similar companies. Expected term is computed using the simplified method as our best estimate given the lack of actual exercise history. We have selected a risk-free rate based on the implied yield available on U.S. Treasury securities with a maturity equivalent to the expected term of the stock option. Stock-based awards are comprised principally of stock options and restricted stock units.
Stock option awards issued to non-employees (e.g., our consultants) are accounted for at fair value determined using the Black-Scholes option-pricing model. Management believes that the fair value of the stock options is more reliably measured than the fair value of the services received. The fair value of each non-employee stock-based compensation award is re-measured each period until performance is completed, which generally is on each vesting date.
The estimated fair value of the convertible debt instruments is determined based on the price of the debt instruments in an over-the-counter market trade on the reporting date.
Deferred Income Tax Assets and Liabilities
Deferred income tax assets and liabilities are recognized for temporary differences between the financial statement carrying amounts of assets and liabilities and the amounts that are reported in the income tax returns. Deferred taxes are evaluated for realization on a jurisdictional basis. We record valuation allowances to reduce deferred tax assets to the amount that is more likely
than not to be realized. In making this assessment, management analyzes future taxable income, reversing temporary differences and ongoing tax planning strategies. Should a change in circumstances lead to a change in judgment about the realizability of deferred tax assets in future years, we will adjust related valuation allowances in the period that the change in circumstances occurs, along with a corresponding increase or charge to income. We are subject to the accounting guidance for uncertain income tax positions. Our policy for recording interest and penalties associated with uncertain tax positions is to record such items as a component of income tax expense.
Results of Operations
The following table sets forth our results of operations for the periods presented. The information contained in the tables below should be read in conjunction with our consolidated financial statements and related notes included in Item 15. Exhibits and Financial Statements Schedules. The period-to-period comparisons of financial results in the table below are not necessarily indicative of future results (in thousands, except per share amounts):
|
| | | | | | | | | | | |
| Year Ended December 31, |
| 2016 | | 2015 | | 2014 |
Revenue | $ | 529,755 |
| | $ | 426,030 |
| | $ | 387,735 |
|
Operating expenses: | | | | | |
Cost of sales | 365,470 |
| | 279,156 |
| | 281,873 |
|
Sales and marketing | 30,941 |
| | 17,705 |
| | 13,287 |
|
Product development | 37,718 |
| | 28,610 |
| | 23,010 |
|
General and administrative | 115,195 |
| | 77,715 |
| | 69,743 |
|
Provision for legal settlements | 43,446 |
| | 4,250 |
| | 8,030 |
|
Amortization of intangible assets | 35,648 |
| | 26,994 |
| | 24,552 |
|
Goodwill impairment | 64,000 |
| | — |
| | — |
|
Restructuring charges | — |
| | 411 |
| | 4,223 |
|
Total operating expenses | 692,418 |
| | 434,841 |
| | 424,718 |
|
Loss from operations | (162,663 | ) | | (8,811 | ) | | (36,983 | ) |
Other income (expense): | | | | | |
Interest (expense) income, net | (18,198 | ) | | (2,492 | ) | | 88 |
|
Income (loss) from equity method investments | 3,829 |
| | — |
| | (1,500 | ) |
Change in fair value of derivatives | 25,515 |
| | 11,938 |
| | (6,955 | ) |
Other expense, net | (6,326 | ) | | (1,140 | ) | | (1,270 | ) |
Loss before income taxes | (157,843 | ) | | (505 | ) | | (46,620 | ) |
Income tax (benefit) expense | (44,911 | ) | | 1,621 |
| | 10,574 |
|
Net loss | (112,932 | ) | | (2,126 | ) | | (57,194 | ) |
Net income attributable to non-controlling interest | — |
| | — |
| | 194 |
|
Net loss attributable to Global Eagle Entertainment Inc. common stockholders | $ | (112,932 | ) | | $ | (2,126 | ) | | $ | (57,388 | ) |
| | | | | |
Net loss per share: | | | | | |
Basic | $ | (1.39 | ) | | $ | (0.03 | ) | | $ | (0.78 | ) |
Diluted | $ | (1.39 | ) | | $ | (0.18 | ) | | $ | (0.78 | ) |
| | | | | |
Weighted average shares outstanding: | | | | | |
Basic | 81,269 |
| | 77,558 |
| | 73,300 |
|
Diluted | 81,269 |
| | 78,394 |
| | 73,300 |
|
The following table provides the depreciation expense included in the above line items (in thousands):
|
| | | | | | | | | | | |
| Year Ended December 31, |
| 2016 | | 2015 | | 2014 |
Depreciation expense: | | | | | |
Cost of sales | $ | 10,855 |
| | $ | 2,957 |
| | $ | 2,820 |
|
Sales and marketing | 1,793 |
| | 893 |
| | 471 |
|
Product development | 2,186 |
| | 1,443 |
| | 858 |
|
General and administrative | 6,677 |
| | 4,154 |
| | 3,030 |
|
Total | $ | 21,511 |
| | $ | 9,447 |
| | $ | 7,179 |
|
The following table provides the stock-based compensation expense included in the above line items (in thousands):
|
| | | | | | | | | | | |
| Year Ended December 31, |
| 2016 | | 2015 | | 2014 |
Stock-based compensation expense: | | | | | |
Cost of sales | $ | 313 |
| | $ | 322 |
| | $ | 36 |
|
Sales and marketing | 629 |
| | 701 |
| | 46 |
|
Product development | 994 |
| | 1,020 |
| | 268 |
|
General and administrative | 8,811 |
| | 6,192 |
| | 7,717 |
|
Total | $ | 10,747 |
| | $ | 8,235 |
| | $ | 8,067 |
|
The following table provides our results of operations, as a percentage of revenue, for the periods presented:
|
| | | | | | | | |
| Year Ended December 31, |
| 2016 | | 2015 | | 2014 |
Revenue | 100 | % | | 100 | % | | 100 | % |
Operating expenses: | | | | | |
Cost of sales | 69 | % | | 66 | % | | 73 | % |
Sales and marketing | 6 | % | | 4 | % | | 3 | % |
Product development | 7 | % | | 7 | % | | 6 | % |
General and administrative | 22 | % | | 18 | % | | 18 | % |
Provision for legal settlements | 8 | % | | 1 | % | | 2 | % |
Amortization of intangible assets | 7 | % | | 6 | % | | 6 | % |
Goodwill impairment | 12 | % | | — | % | | — | % |
Restructuring charges | — | % | | — | % | | 1 | % |
Total operating expenses | 131 | % | | 102 | % | | 110 | % |
Loss from operations | (31 | )% | | (2 | )% | | (10 | )% |
Other expense, net | 1 | % | | 2 | % | | (2 | )% |
Loss before income taxes | (30 | )% | | — | % | | (12 | )% |
Income tax (benefit) expense | (8 | )% | | — | % | | 3 | % |
Net loss | (21 | )% | | — | % | | (15 | )% |
Net income attributable to non-controlling interest | — | % | | — | % | | — | % |
Net loss attributable to Global Eagle Entertainment Inc. common stockholders | (21 | )% | | — | % | | (15 | )% |
Operating Segments
The following tables set forth our contribution profit for each operating segment in the periods presented (in thousands):
|
| | | | | | | | | | | |
| Year Ended December 31, |
| 2016 | | 2015 | | 2014 |
Revenue: | | | | | |
Media & Content | | | | | |
Licensing | $ | 261,912 |
| | $ | 252,775 |
| | $ | 231,521 |
|
Services | 56,152 |
| | 55,292 |
| | 45,868 |
|
Total | 318,064 |
| | 308,067 |
| | 277,389 |
|
Aviation Connectivity | | | | | |
Services | 109,507 |
| | 96,912 |
| | 74,839 |
|
Equipment | 28,977 |
| | 21,051 |
| | 35,507 |
|
Total | 138,484 |
| | 117,963 |
| | 110,346 |
|
Maritime & Land Connectivity | | | | | |
Services | 68,964 |
| | — |
| | — |
|
Equipment | 4,243 |
| | — |
| | — |
|
Total | 73,207 |
| | — |
| | — |
|
Total revenue | $ | 529,755 |
| | $ | 426,030 |
| | $ | 387,735 |
|
Cost of sales: | | | | | |
Media & Content | | | | | |
Licensing and services | $ | 214,028 |
| | $ | 203,693 |
| | $ | 194,996 |
|
Aviation Connectivity | | | | | |
Services | 67,155 |
| | 57,942 |
| | 54,882 |
|
Equipment | 24,590 |
| | 17,521 |
| | 31,995 |
|
Total | 91,745 |
| | 75,463 |
| | 86,877 |
|
Maritime & Land Connectivity | | | | | |
Services | 55,519 |
| | — |
| | — |
|
Equipment | 4,178 |
| | — |
| | — |
|
Total | 59,697 |
| | — |
| | — |
|
Total cost of sales | $ | 365,470 |
| | $ | 279,156 |
| | $ | 281,873 |
|
Contribution profit: | | | | | |
Media & Content | $ | 104,036 |
| | $ | 104,374 |
| | $ | 82,393 |
|
Aviation Connectivity | 46,739 |
| | 42,500 |
| | 23,469 |
|
Maritime & Land Connectivity | 13,510 |
| | — |
| | — |
|
Total contribution profit | 164,285 |
| | 146,874 |
| | 105,862 |
|
Other operating expenses | 326,948 |
| | 155,685 |
| | 142,845 |
|
Loss from operations | $ | (162,663 | ) | | $ | (8,811 | ) | | $ | (36,983 | ) |
Revenue
Media & Content
The revenue for Media & Content for each of the three years ended December 31, 2016 was as follows (in thousands):
|
| | | | | | | | | | | | | | | | | |
| Year Ended December 31, | | % Change |
| 2016 | | 2015 | | 2014 | | 2015 to 2016 | | 2014 to 2015 |
Licensing and services | $ | 318,064 |
| | $ | 308,067 |
| | $ | 277,389 |
| | 3 | % | | 11 | % |
Licensing and Services Revenue
2016 compared to 2015. Licensing and services revenue for Media & Content increased by $10.0 million or 3% to $318.1 million for the year ended December 31, 2016 compared to $308.1 million for the year ended December 31, 2015. The increase was primarily due to the additional revenue from companies acquired in the third quarter of 2015, revenue from new airline customers, new advertising campaigns and higher tablets and pay-per-view revenue. The increase was partially offset by the loss of the American Airlines business in the third quarter of 2016.
2015 compared to 2014. Licensing and services revenue for Media & Content increased by $30.7 million or 11%, to $308.1 million for the year ended December 31, 2015 compared to $277.4 million for the year ended December 31, 2014. The increase was principally due to the timing of on-boarding certain significant Media & Content customers, period-over-period revenue growth from existing Media & Content customers and revenue from companies acquired in the third quarter of 2015.
Aviation Connectivity
The revenue for Aviation Connectivity for each of the three years ended December 31, 2016 was as follows (in thousands):
|
| | | | | | | | | | | | | | | | | |
| Year Ended December 31, | | % Change |
| 2016 | | 2015 | | 2014 | | 2015 to 2016 | | 2014 to 2015 |
Services | $ | 109,507 |
| | $ | 96,912 |
| | $ | 74,839 |
| | 13 | % | | 29 | % |
Equipment | 28,977 |
| | 21,051 |
| | 35,507 |
| | 38 | % | | (41 | )% |
Total | $ | 138,484 |
| | $ | 117,963 |
| | $ | 110,346 |
| | 17 | % | | 7 | % |
Services Revenue
2016 compared to 2015. Services revenue for Aviation Connectivity increased $12.6 million or 13%, to $109.5 million for the year ended December 31, 2016, compared to $96.9 million for the year ended December 31, 2015. The increase was due to various factors, including a larger base of Wi-Fi installed planes, increases in passenger usage rates and overall improvements in network performance, offset by a decline in sponsorship revenue for the year ended December 31, 2016 compared to the year ended December 31, 2015.
2015 compared to 2014. Services revenue for Aviation Connectivity increased $22.1 million, or 29%, to $96.9 million for the year ended December 31, 2015, as compared to $74.8 million for the year ended December 31, 2014. The increase was principally due to higher take rates and the growth in users of our satellite-based Internet services on Southwest Airlines, which was driven by a higher number of Southwest Airlines planes offering our connectivity services for the year ended December 31, 2015 compared to the year ended December 31, 2014.
Equipment Revenue
2016 compared to 2015. Equipment revenue for Aviation Connectivity increased by $7.9 million, or 38%, to $29.0 million for the year ended December 31, 2016 compared to $21.1 million for the year ended December 31, 2015. The increase was primarily due to the number and timing of equipment installations on newly commissioned planes and additional revenue from the companies acquired during the third quarter of 2015.
2015 compared to 2014. Equipment revenue for Aviation Connectivity decreased by $14.5 million, or 41%, to $21.1 million for the year ended December 31, 2015, as compared to $35.5 million for the year ended December 31, 2014. The decrease was primarily due to the timing of equipment installations on newly commissioned planes.
Maritime & Land Connectivity
The revenue for Maritime & Land Connectivity for each of the three years ended December 31, 2016 was as follows (in thousands):
|
| | | | | | | | | | | | | | | | | |
| Year Ended December 31, | | % Change |
| 2016 | | 2015 | | 2014 | | 2015 to 2016 | | 2014 to 2015 |
Services | $ | 68,964 |
| | $ | — |
| | $ | — |
| | — | % | | — | % |
Equipment | 4,243 |
| | — |
| | — |
| | — | % | | — | % |
Total | $ | 73,207 |
| | $ | — |
| | $ | — |
| | — | % | | — | % |
As a result of the EMC Acquisition in July 2016, the Company formed a Maritime & Land Connectivity operating segment during 2016, and EMC became part of that segment. For the year ended December 31, 2016, Maritime & Land Connectivity contributed services and equipment revenue of $69.0 million and $4.2 million, respectively. There was no revenue for Maritime & Land Connectivity during the years ended December 31, 2015 and 2014.
Cost of Sales
Media & Content
The cost of sales for Media & Content for each of the three years ended December 31, 2016 was as follows (in thousands):
|
| | | | | | | | | | | | | | | | | |
| Year Ended December 31, | | % Change |
| 2016 | | 2015 | | 2014 | | 2015 to 2016 | | 2014 to 2015 |
Cost of sales | $ | 214,028 |
| | $ | 203,693 |
| | $ | 194,996 |
| | 5 | % | | 4 | % |
2016 compared to 2015. Cost of sales for Media & Content increased by $10.3 million to $214.0 million for the year ended December 31, 2016, as compared to $203.7 million for the year ended December 31, 2015. This increase was mainly driven by higher cost of sales to support increased volume from new and existing customers and new advertising costs as a result of the acquisition of the assets of RMG, which was completed in the third quarter of 2015.
As a percentage of Media & Content revenue, cost of sales for Media & Content was relatively flat at 67% for the year ended December 31, 2016 compared to 66% for the year ended December 31, 2015.
2015 compared to 2014. Cost of sales for Media & Content increased $8.7 million to $203.7 million for the year ended December 31, 2015, as compared to $195.0 million for the year ended December 31, 2014. This increase was mainly driven by the period-over-period growth from existing Media & Content customers as well as acquisitions in the third quarter of 2015.
As a percentage of Media & Content revenue, cost of sales for Media & Content of 66% for the year ended December 31, 2015 decreased compared to 70% for the year ended December 31, 2014.
Aviation Connectivity
The cost of sales for Aviation Connectivity for each of the three years ended December 31, 2016 was as follows (in thousands):
|
| | | | | | | | | | | | | | | | | |
| Year Ended December 31, | | % Change |
| 2016 | | 2015 | | 2014 | | 2015 to 2016 | | 2014 to 2015 |
Services | $ | 67,155 |
| | $ | 57,942 |
| | $ | 54,882 |
| | 16 | % | | 6 | % |
Equipment | 24,590 |
| | 17,521 |
| | 31,995 |
| | 40 | % | | (45 | )% |
Total | $ | 91,745 |
| | $ | 75,463 |
| | $ | 86,877 |
| | 22 | % | | (13 | )% |
2016 compared to 2015. Cost of sales for Aviation Connectivity increased $16.3 million or 22%, to $91.7 million for the year ended December 31, 2016 compared to $75.5 million for the year ended December 31, 2015. The increase was due to a $9.2
million increase in licensing and services cost of sales and a $7.1 million increase in equipment cost of sales. The increase in licensing and services cost of sales was primarily due to higher satellite bandwidth expenses to support customer growth offset by bandwidth synergies realized as a result of the renegotiation of satellite bandwidth contracts with certain vendors subsequent to the EMC Acquisition. The increase in equipment cost of sales was the result of higher equipment shipments on newly commissioned airplanes.
As a percentage of services revenue for Aviation Connectivity, licensing and services cost of sales for Aviation Connectivity remained relatively flat at 61% for the year ended December 31, 2016 compared to 60% for the year ended December 31, 2015.
As a percentage of equipment revenue for Aviation Connectivity, equipment cost of sales for Aviation Connectivity remained relatively flat at 85% for the year ended December 31, 2016 compared to 83% for the year ended December 31, 2015.
2015 compared to 2014. Cost of sales for Aviation Connectivity decreased $11.4 million, or 13%, to $75.5 million for the year ended December 31, 2015 compared to $86.9 million for the year ended December 31, 2014. The decrease was due to a $14.5 million decrease in equipment cost of sales, partially offset by a $3.1 million increase in licensing and services cost of sales. The decrease in equipment cost of sales was principally due to a decrease in equipment revenue over the same period as a result of the timing of equipment shipments on newly commissioned planes. The decrease was offset by an increase in licensing and services cost of sales largely due to higher licensing fees to support the growth in licensing and services revenue over the same period.
As a percentage of licensing and services revenue for Aviation Connectivity, licensing and services cost of sales for Aviation Connectivity was 60% for the year ended December 31, 2015 as compared to 73% for the year ended December 31, 2014, an improvement of 1,300 basis points. The period-to-period improvement in Connectivity services margin was largely due to improved optimization of our satellite bandwidth costs for the year ended December 31, 2015, coupled with higher services revenue from increased take rates and passenger usage on Southwest Airlines for the year ended December 31, 2015 versus the year ended December 31, 2014.
As a percentage of equipment revenue for Aviation Connectivity, equipment cost of sales for Aviation Connectivity was 83% for the year ended December 31, 2015 as compared to 90% for the year ended December 31, 2014, a decrease of 500 basis points. The period-over-period change in contribution margin was primarily due to a lower mix of equipment installations on the Southwest Airlines fleet in 2015, as compared to 2014, which were sold at more favorable margins as compared to other airlines.
Maritime & Land Connectivity
The cost of sales for Maritime & Land Connectivity for each of the three years ended December 31, 2016 was as follows (in thousands):
|
| | | | | | | | | | | | | | | | | |
| Year Ended December 31, | | % Change |
| 2016 | | 2015 | | 2014 | | 2015 to 2016 | | 2014 to 2015 |
Services | $ | 55,519 |
| | $ | — |
| | $ | — |
| | — | % | | — | % |
Equipment | 4,178 |
| | — |
| | — |
| | — | % | | — | % |
Total | $ | 59,697 |
| | $ | — |
| | $ | — |
| | — | % | | — | % |
During the year ended December 31, 2016, Maritime & Land Connectivity, which was formed as a result of the EMC Acquisition, recorded services and equipment costs of sales of $55.5 million and $4.2 million, respectively. There were no cost of sales for Maritime & Land Connectivity during the years ended December 31, 2015 and 2014. As a percentage of licensing and services revenue for Maritime & Land Connectivity, licensing and services cost of sales for Maritime & Land Connectivity was 81% during the year ended December 31, 2016. Compared to our other operating segments, our Maritime & Land Connectivity segment is more capital intensive and has larger numbers of vessels to serve, which results in the higher depreciation and other indirect costs. As such, this segment has a lower contribution margin than our other segments.
Other Operating Expenses
Other operating expenses for each of the three years ended December 31, 2016 were as follows (in thousands):
|
| | | | | | | | | | | | | | | | | |
| Year Ended December 31, | | % Change |
| 2016 | | 2015 | | 2014 | | 2015 to 2016 | | 2014 to 2015 |
Sales and marketing | $ | 30,941 |
| | $ | 17,705 |
| | $ | 13,287 |
| | 75 | % | | 33 | % |
Product development | 37,718 |
| | 28,610 |
| | 23,010 |
| | 32 | % | | 24 | % |
General and administrative | 115,195 |
| | 77,715 |
| | 69,743 |
| | 48 | % | | 11 | % |
Provision for legal settlements | 43,446 |
| | 4,250 |
| | 8,030 |
| | 922 | % | | (47 | )% |
Amortization of intangible assets | 35,648 |
| | 26,994 |
| | 24,552 |
| | 32 | % | | 10 | % |
Goodwill impairment | 64,000 |
| | — |
| | — |
| | — | % | | — | % |
Restructuring charges | — |
| | 411 |
| | 4,223 |
| | (100 | )% | | (90 | )% |
Total | $ | 326,948 |
| | $ | 155,685 |
| | $ | 142,845 |
| | 110 | % | | 9 | % |
Sales and Marketing
2016 compared to 2015. Sales and marketing expenses increased by $13.2 million, or 75%, to $30.9 million for the year ended December 31, 2016 compared to $17.7 million for the year ended December 31, 2015. The year-over-year increase was due to the EMC Acquisition, which contributed $9.3 million of such increase. The remaining increase is primarily due to a $2.8 million increase in personnel costs, and an increase of $1.1 million for depreciation expense.
2015 compared to 2014. Sales and marketing expenses increased by $4.4 million, or 33%, to $17.7 million for the year ended December 31, 2015 compared to $13.3 million for the year ended December 31, 2014. The increase was largely due to a net increase of $3.0 million in personnel and related costs as a result of acquisitions and to support the growth in our business and an increase of $1.1 million in non-cash stock-based compensation and depreciation expenses.
Product Development
2016 compared to 2015. Product development expenses increased by $9.1 million, or 32%, to $37.7 million for the year ended December 31, 2016 compared to $28.6 million for the year ended December 31, 2015. The year-over-year increase was due to the EMC Acquisition, which contributed $1.6 million of such increase, impairment of internally developed software of $3.2 million, an increase of $2.9 million for personnel costs, an increase of $2.7 million for consulting and professional services related to product development initiatives and a $0.8 million increase in depreciation expense, partially offset by $2.0 million in lower Ka and Ku development costs and advanced antenna technology.
2015 compared to 2014. Product development expenses increased by $5.6 million, or 24%, to $28.6 million for the year ended December 31, 2015 compared to $23.0 million for the year ended December 31, 2014. The increase was largely due to an increase of approximately $4.3 million in personnel costs and professional fees largely related to development initiatives such as Boeing line-fit, global antenna development, ongoing trial and STC expenses for Air China and Orange/Air France, and acquisitions, coupled with a $1.3 million increase in non-cash stock-based compensation and depreciation expenses.
General and Administrative
2016 compared to 2015. General and administrative expense increased by $37.5 million or 48% to $115.2 million for the year ended December 31, 2016 compared to $77.7 million for the year ended December 31, 2015. EMC accounted for $9.9 million of the increase. The remaining increase of $27.6 million was primarily due to a $15.4 million of transaction costs in connection with the EMC Acquisition, $13.4 million in professional and consulting fees associated with business integration, the 2016 integrated audit, and the fees associated with legal settlements, a $2.5 million increase in depreciation expense and a $2.6 million increase in stock-based compensation expense, partially offset by $2.5 million in lower personnel costs and $3.8 million of change in fair value of earn-out liability.
2015 compared to 2014. General and administrative expense increased by $8.0 million, or 11%, to $77.7 million for the year ended December 31, 2015 compared to $69.7 million for the year ended December 31, 2014. The increase was largely due to a $5.0 million increase in facility, depreciation and insurance expenses and a net $3.8 million increase in personnel and travel related
costs to support our growth over the period and from acquisitions, coupled with a net increase of $2.0 million from our February 2015 offering, integration and acquisition-related activities. Offsetting these were decreases of $4.8 million in bad debt as the result of a one-time $4.1 million impairment of accounts receivable during the year ended December 31, 2014 and $1.7 million in stock-based compensation.
Provision for Legal Settlements
2016 compared to 2015. Provision for legal settlements increased by $39.2 million, or 922%, to $43.4 million for the year ended December 31, 2016 compared to $4.3 million for the year ended December 31, 2015. The increase was largely due to the settlement with Universal Music Group totaling $38.6 million. See Note 11. Commitments and Contingencies to our consolidated financial statements contained herein for a discussion of our Sound-Recording Settlements.
2015 compared to 2014. Provision for legal settlements decreased by $3.7 million, or 47%, to $4.3 million for the year ended December 31, 2015 compared to $8.0 million for the year ended December 31, 2014. The decrease was due to the decrease in litigations in 2015. During the year ended December 31, 2014, there were settlements with various counterparties totaling $8.0 million, while there were litigations with American Airlines and United Airlines totaling $4.3 million during the year ended December 31, 2015.
Amortization of Intangible Assets
2016 compared to 2015. Amortization expense increased by $8.7 million, or 32%, to $35.6 million for the year ended December 31, 2016 compared to $27.0 million for the year ended December 31, 2015. The increase was due to the amortization of intangible assets acquired in connection with the EMC Acquisition.
2015 compared to 2014. Amortization expense increased by $2.4 million, or 10% to $27.0 million for the year ended December 31, 2015 compared to $24.6 million for the year ended December 31, 2014. The increase was due to the amortization of acquired intangible assets acquired via the 2015 acquisitions of WOI and RMG on July 1, 2015 and masFlight and navAero on August 4, 2015, which were not part of our operations for 2014.
Goodwill Impairment
2016 compared to 2015. In connection with our annual goodwill impairment test during the fourth quarter of 2016, we concluded that the carrying value of goodwill associated with the Maritime & Land Connectivity reporting unit exceeded its implied fair value. As a result, we recorded a goodwill impairment charge of $64.0 million in the fourth quarter of 2016. The implied fair value declined due to our conclusion during the quarter that our estimated internal financial projections for this reporting unit would be lower than we had previously anticipated. We reduced the projections due to, among other things: lower than expected actual financial results from this business due to margin compression resulting from competition in our cellular backhaul land business in Africa; delayed new deal executions and slower than anticipated installations and upgrades; and operational challenges in integrating a legacy EMC acquiree in 2015 into this reporting unit that resulted in lower than previously estimated synergies. See Note 2. Basis of Presentation and Summary of Significant Accounting Policies to the consolidated financial statements included in Item 15. Exhibits and Financial Statement Schedules.
2015 compared to 2014. The Company did not record a goodwill impairment charge during the years ended December 31, 2015 and 2014.
Restructuring Charges
2016 compared to 2015. There were no restructuring charges for the year ended December 31, 2016, since we completed our restructuring plan during the year ended December 31, 2015.
2015 compared to 2014. Restructuring charges decreased by $3.8 million, or 90%, to $0.4 million for the year ended December 31, 2015, compared to $4.2 million for the year ended December 31, 2014. The decrease was due to the completion of our restructuring plan during the year ended December 31, 2015.
Other Income (Expense)
Other income (expense) for each of the three years ended December 31, 2016 was as follows (in thousands):
|
| | | | | | | | | | | | | | | | | |
| Year Ended December 31, | | % Change |
| 2016 | | 2015 | | 2014 | | 2015 to 2016 | | 2014 to 2015 |
Interest (expense) income, net | $ | (18,198 | ) | | $ | (2,492 | ) | | $ | 88 |
| | 630 | % | | (2,932 | )% |
Income (loss) from equity method investments | 3,829 |
| | — |
| | (1,500 | ) | | — | % | | (100 | )% |
Change in fair value of derivatives | 25,515 |
| | 11,938 |
| | (6,955 | ) | | 114 | % | | (272 | )% |
Other expense, net | (6,326 | ) | | (1,140 | ) | | (1,270 | ) | | 455 | % | | (10 | )% |
Total | $ | 4,820 |
| | $ | 8,306 |
| | $ | (9,637 | ) | | (42 | )% | | (186 | )% |
2016 compared to 2015. Other income decreased by $3.5 million, or 42%, to $4.8 million for the year ended December 31, 2016 compared to $8.3 million for the year ended December 31, 2015. The decrease of $3.5 million was driven by an increase in interest expense of $15.7 million as a result of the assumption of EMC’s legacy senior secured credit facility and an increase in other expense, net due to the impairment of a loan receivable from a related party of $4.4 million, partially offset by a $13.6 million increase in the change in fair value of derivatives as a result of the change in the fair value of the Company’s public warrants and by income from equity method investments of $3.8 million.
2015 compared to 2014. For the year ended December 31, 2015, Other income was $8.3 million compared to Other expense of $9.6 million for the year ended December 31, 2014. The $17.9 million increase in net other income was primarily attributable to a $11.9 million favorable fair value adjustment for the Company's Public SPAC Warrants for the year ended December 31, 2015 compared to an unfavorable fair value adjustment of $7.0 million for the year ended December 31, 2014, resulting in an increase in net other income of $18.9 million between years. In addition, a loss of $1.5 million from an equity method affiliate was incurred during the year ended December 31, 2014 while no such loss was incurred for the year ended December 31, 2015. These favorable changes were partially offset by an increase in net interest expense of $2.6 million for the year ended December 31, 2015 compared to the year ended December 31, 2014.
Income Tax (Benefit) Expense
2016 compared to 2015. Income tax benefit was $44.9 million for the year ended December 31, 2016 compared to income tax expense of $1.6 million for the year ended December 31, 2015. The tax benefit during the year ended December 31, 2016 is primarily attributable to the release of valuation allowance on deferred tax assets, which was offset against the deferred tax liabilities recorded in connection with the EMC Acquisition. The 2016 income tax benefit was further reduced by other permanent tax differences primarily related to goodwill impairment charges in the Maritime & Land Connectivity reporting unit.
2015 compared to 2014. Income tax expense was $1.6 million for the year ended December 31, 2015 compared to $10.6 million for the year ended December 31, 2014. The decrease in income tax expense was largely due to a $3.0 million one-time benefit as a result of internal tax restructuring, and a decrease of $4.0 million in uncertain tax position expense compared to 2014.
Liquidity and Capital Resources
Current Financial Condition
As of December 31, 2016, our principal sources of liquidity were our cash and cash equivalents $50.7 million, which primarily are invested in cash and money market funds in banking institutions in the U.S., Canada and Europe and to a lesser extent in Asia Pacific. Our cash position decreased during the year ended December 31, 2016 primarily as a result of the EMC Acquisition, for which we used $92.2 million in cash, net of cash acquired, as partial consideration for the acquisition, $54.2 million to purchase property and equipment, $22.0 million payments made in connection with the litigation settlements (including our settlement with Universal Music Group and entities affiliated with the foregoing (collectively “UMG”), which is discussed in Note 11. Commitments and Contingencies to our consolidated financial statements contained herein), and $5.2 million of stock repurchases. As of December 31, 2016, we had a working capital deficiency of $7.5 million primarily due to Accounts payable and accrued liabilities of $240.3 million. For the year ended December 31, 2016, we had a negative cash flows from operating activities of $36.6 million primarily due to net loss of $112.9 million.
As of December 31, 2016, we had approximately $18.0 million of restricted cash, a significant portion of which represented cash held in an escrow account for a previous EMC acquisition that was released to the former stockholders of the acquired company during 2017, net of any claims that arose prior to such date. The remaining restricted cash is primarily attached to letters of credit agreements between our subsidiaries and certain customers. As of December 31, 2016, we had $398.0 million in bank term and revolver loans outstanding, most of which were assumed in the EMC Acquisition, outstanding convertible senior notes of $69.0 million, net of the discount associated with the equity component, and other debts of $3.3 million.
Our cash flows from operating activities are significantly affected by our investments in operations, including working capital and corporate infrastructure to support our ability to generate revenue and conduct operations through cost of services, product development, sales and marketing and general and administrative activities. Cash used in investing activities has historically been, and is expected to be, impacted significantly by our investments in business combinations, our platform, Company infrastructure and equipment for our business offerings. Historically, cash used for financing activities included Company common stock and warrant repurchases and the repayment of debt.
During the year ended December 31, 2016, we invested significant cash to make additional strategic acquisitions across our Aviation Connectivity, Maritime & Land Connectivity and Media & Content segments to further grow our business. We expect to make additional strategic acquisitions over time to further grow our business, which may require significant investments in the near and long term. Moreover, during the year ended December 31, 2016, we acquired additional satellite transponders over North and Central America for an aggregate cost of $31.9 million. Over the next twelve months, our net use of our working capital could be substantially higher or lower depending on the number and timing of new customers that we add to our business.
On July 27, 2016, we acquired EMC, which created a new Maritime & Land Connectivity segment. The acquisition-date fair value of consideration transferred for the acquisition totaled $166.3 million, which consisted of (i) $100.5 million in cash, (ii) approximately 5.5 million shares of our common stock issued at the closing and valued at $40.6 million based on the closing price of our common stock less a 7.5% discount for restriction on transferability, (iii) $25 million in deferred consideration that could be settled in July 2017 in cash, common stock or a combination thereof at the Company’s election (and which was ultimately settled in July 2017 by the issuance of 5.1 million shares of our common stock) and (iv) $0.2 million for the settlement of a pre-existing relationship with an EMC subsidiary. We also assumed approximately $370.8 million aggregate principal amount of EMC's indebtedness, discussed further below. The revenue and net loss of EMC included in our Consolidated Statements of Operations were $73.2 million and $94.8 million, respectively, from the acquisition date through December 31, 2016.
In July and August 2015, the Company completed four acquisitions: WOI, RMG advertising assets, Marks Systems, Inc. (doing business as “masFlight”) and navAero AB for an aggregate purchase price of approximately $55.2 million in cash, net of cash acquired, $5.0 million in additional contingent consideration paid and additional contingent consideration which may total up to $24.0 million based upon the performance of the acquired companies through the end of 2019.
In December 2016, the Company entered into an agreement with SES to purchase Tranche 1 and 2 satellite transponders in exchange for $13.5 million in cash paid in 2016 with $13.5 million payable in 2017 for Tranche 1 transponders and $23.0 million payable in 2017 for Tranche 2 transponders. The satellite transponders operate over certain parts of North and Central Americas, and have an estimated useful life of 6 years beginning in December 2016.
In July 2015, the Company entered into an agreement with SES to purchase satellite transponders and certain equipment in exchange for $6.7 million in cash with $6.0 million payable in 2015 and the remaining $0.7 million payable in January 2016. In
addition, the Company deferred approximately $2.5 million in prepaid payment obligations to SES from June 2015 to January 2016. The satellite transponders operate over certain parts of the U.S., and have an estimated useful life of 7 years beginning in July 2015.
To strengthen our current liquidity position, we may implement cost reduction initiatives to meet our short-term cash needs. In the future, we may raise additional funds through commercial financings, bonds, debentures, equity and equity-linked capital raises, lines of credit and term loans with a syndicate of commercial banks or other bank syndicates and/or issue equity securities (publicly or privately) for general corporate purposes, fund our ongoing operations and/or invest in new business opportunities. In addition to our existing cash and cash equivalents, we may need to utilize available capacity under our revolving credit facility to fund our operations for at least the next 12 months. However, as of the filing date of this Form 10-K, other than approximately $1 million of available cushion for foreign currency fluctuations on outstanding letters of credit, we had no capacity remaining under our revolving credit facility.
Cash and Cash Equivalents
Our cash and cash equivalents are maintained at several financial institutions. Deposits held may exceed the amount of insurance provided on such deposits. Generally, our deposits may be redeemed upon demand and are maintained with a financial institution of reputable credit and, therefore, bear minimal credit risk. Of our cash and cash equivalents as of December 31, 2016, approximately $36.2 million was held by our foreign subsidiaries. Under current tax laws, if these funds were repatriated for use in our U.S. operations, we may be required to pay additional income taxes at the tax rates then in effect.
Cash Flows
A summary of our cash flow activities was as follows (in thousands):
|
| | | | | | | | | | | |
| Year Ended December 31, |
| 2016 | | 2015 | | 2014 |
Net cash (used in) provided by operating activities | $ | (36,600 | ) | | $ | 21,855 |
| | $ | (23,395 | ) |
Net cash used in investing activities | (150,819 | ) | | (80,895 | ) | | (9,723 | ) |
Net cash provided by (used in) financing activities | 13,898 |
| | 84,558 |
| | (28,031 | ) |
Effects of exchange rate changes on cash and cash equivalents | 655 |
| | 386 |
| | 1 |
|
Net increase (decrease) in cash and cash equivalents | (172,866 | ) | | 25,904 |
| | (61,148 | ) |
CASH AND CASH EQUIVALENTS AT BEGINNING OF YEAR | 223,552 |
| | 197,648 |
| | 258,796 |
|
CASH AND CASH EQUIVALENTS AT END OF YEAR | $ | 50,686 |
| | $ | 223,552 |
| | $ | 197,648 |
|
Operating Activities
Year ended December 31, 2016
Net cash used in our operating activities of $36.6 million primarily resulted from our net loss during the year of $112.9 million, which included non-cash charges of $82.3 million largely comprised of depreciation and amortization of property, equipment and intangibles, amortization of content library, goodwill impairment, deferred income taxes, changes in the fair value of derivative financial instruments, issuance of shares for legal settlements and stock-based compensation. The remainder of our sources of cash used in operating activities of $6.0 million was from changes in working capital, including $44.7 million of cash outflows from increases in accounts receivable, prepaid expenses, content library and other assets, and decreases in deferred revenue and taxes payable. Offsetting these were $38.7 million in cash inflows from increases in accounts payable and accrued liabilities and decreases in restricted cash, inventories and other current assets.
Year ended December 31, 2015
Net cash provided by our operating activities of $21.9 million primarily resulted from our net loss during the year of $2.1 million, which included non-cash charges, net of $43.2 million largely comprised of changes in the fair value of our derivative financial instruments, depreciation and amortization of property, equipment and intangibles, amortization of content library, changes in our deferred income taxes, and stock-based compensation. Net cash used in operating activities of $19.2 million was attributable to changes in our working capital, including $29.2 million cash outflows from increases in accounts receivable, inventories, content library and prepaid expenses, and a decrease in deferred revenue. Offsetting these were $10.1 million in cash inflows from increases in accounts payable and accrued liabilities, taxes payable and other liabilities and decreases in deposits and other assets.
Year ended December 31, 2014
Net cash used in our operating activities of $23.4 million primarily resulted from our net loss during the year of $57.2 million, which included non-cash charges of $66.8 million largely comprised of depreciation and amortization of property, equipment and intangibles, amortization of content library, stock based compensation, changes in the fair value of our derivative financial instruments, changes in our deferred income taxes, provision for bad debt and loss on equity method investments. Additional uses of cash for operating activities of $56.1 million was from changes in our working capital, including accounts receivable, prepaid expenses, and content library and inventory investments used to grow our operations in 2014. The increase in accounts receivable was reflective of the growth in our corresponding revenue in the period, coupled with the timing of payments from key customers in the period. The increases in prepaid expenses and inventory and content purchases were from continued investments to support the growth in our Connectivity equipment installations and content licensing acquisition. Offsetting these uses of cash in operating activities was a net cash inflow of $23.1 million from increases in accounts payable and accrued liabilities reflective of timing of payments to vendors, deferred revenue and taxes payable.
Investing Activities
Year ended December 31, 2016
Net cash used in investing activities of $150.8 million was primarily due to $92.2 million for our acquisition of EMC in July 2016, net of cash acquired, $54.2 million of purchase of property and equipment primarily relating to the purchase of connectivity equipment and satellite transponders and a $4.4 million loan to a related party.
Year ended December 31, 2015
Net cash used in investing activities of $80.9 million was due to cash out flows of $60.2 million relating to recent acquisitions and $20.7 million in investments in property and equipment to build out our internal infrastructure.
Year ended December 31, 2014
Net cash used in investing activities of $9.7 million was largely due to $9.1 million investments in property and equipment to build-out our internal infrastructure, $0.5 million relating to the Purple asset purchase and $0.7 million relating to other, offset by proceeds of approximately $0.6 million received from the sale of certain marketable securities.
Financing Activities
Year ended December 31, 2016
Net cash provided by financing activities of $13.9 million was primarily due to cash received from draws from the revolving line of credit of $27.5 million, offset by cash used to repurchase the Company’s common stock totaling $5.2 million, to repay debt of $3.8 million and $4.1 million in earn-out payments made to the sellers of the entities acquired during 2015.
Year ended December 31, 2015
Net cash provided by financing activities of $84.6 million was primarily due to cash received from the issuance of the convertible senior notes of $81.3 million and net proceeds from the exercise of stock options and warrants of $5.6 million, offset by debt issuance costs of $0.8 million, other financing activities of $0.3 million, and repayments on debts of $1.1 million.
Year ended December 31, 2014
Net cash used in financing activities of $28.0 million was primarily due to cash consideration of $21.7 million to acquire the remaining 6% interest in AIA, $9.7 million in payments of certain debt obligations associated with AIA and $1.4 million in payments to purchase our outstanding public warrants, offset by the net proceeds from the Former Citibank Term Loans (as defined below) of $2.0 million and the exercise of stock options and warrants of $3.1 million.
Stock Repurchase Program
In March 2016, our Board of Directors (the “Board”) authorized a stock repurchase program under which we may repurchase up to $50.0 million of our common stock. Under the stock repurchase program, we may repurchase shares from time to time using a variety of methods, which may include open-market purchases and privately negotiated transactions. The extent to which we repurchase our shares, and the timing and manner of such repurchases, will depend upon a variety of factors, including market conditions, regulatory requirements and other corporate considerations, as determined by management. We measure all potential buybacks against other potential uses of capital which may arise from time to time. The repurchase program does not obligate us to repurchase any specific number of shares, and may be suspended or discontinued at any time. As of December 31, 2016, the remaining authorization under the stock repurchase plan was $44.8 million. In addition, we are subject to contractual limitations on stock repurchases under our credit agreement entered into in January 2017.
Warrants
During the year ended December 31, 2014, the Board authorized us to repurchase warrants previously issued in our initial public offering (“Public SPAC Warrants”) for an aggregate purchase price, payable in cash and/or shares of common stock, of up to $25.0 million (inclusive of certain prior warrant purchases). In August 2015, the Board increased this amount by an additional $20.0 million. During the year ended December 31, 2016, we did not acquire any warrants under this authorization. As of December 31, 2016, $16.7 million was available for warrant repurchases under this authorization. The amount we spend and the number of warrants repurchased varies based on a variety of factors including the warrant price. In addition, we are subject to contractual limitations on warrant repurchases under our credit agreement entered into in January 2017.
Sound Recording Settlements
During the three months ended September 30, 2016, we entered into settlement agreements with major record labels and publishers, including UMG, to settle music copyright infringement and related claims (the “Sound-Recording Settlements”). As a result of the Sound-Recording Settlements, we paid approximately $18.0 million in cash and issued approximately 1.8 million shares of our common stock to settle lawsuits and other claims. Under our settlement agreement with UMG, we also paid UMG an additional $5.0 million in cash in March 2017 and are obligated to issue 500,000 shares of our common stock when and if the closing price of our common stock exceeds $10.00 per share and 400,000 shares of our common stock when and if the closing price of our common stock exceeds $12.00 per share.
In October 2016, we entered into a settlement agreement with American Airlines pursuant to which we paid $3.7 million to settle our outstanding litigation with American Airlines. This litigation was also related to our sound-recording liabilities.
Debt Instruments
The carrying values of our debt as of December 31, 2016 and 2015 were as follows (in thousands):
|
| | | | | | | |
| 2016 | | 2015 |
EMC Senior secured credit facility (refinanced in January 2017) | $ | 397,977 |
| | $ | — |
|
Convertible senior notes | 69,024 |
| | 68,335 |
|
Other debt | 3,299 |
| | 2,819 |
|
| $ | 470,300 |
| | $ | 71,154 |
|
Convertible Senior Notes
In February 2015, the Company issued $82.5 million principal amount of convertible senior notes due in 2035 (the “Convertible Notes”) in a private placement. The Convertible Notes were issued at par, pay interest semi-annually in arrears at an annual rate of 2.75% and mature on February 15, 2035, unless earlier repurchased, redeemed or converted. The Convertible Notes are convertible in certain circumstances and subject to certain conditions, based on an initial conversion rate of 53.9084 shares of common stock per $1,000 principal amount of notes (which represents an initial conversion price of approximately $18.55 per share), subject to adjustment. Holders of the Convertible Notes may convert their Convertible Notes at their option at any time prior to the close of business on the business day immediately preceding November 15, 2034, only if one or more of the following conditions has been satisfied: 1) during any calendar quarter beginning after March 31, 2015 if the closing price of the Company’s common stock equals or exceeds 130% of the respective conversion price per share during a defined period at the end of the previous quarter, 2) during the five consecutive business day period immediately following any five consecutive trading day period in which the trading price per $1,000 principal amount of Convertible Notes for each trading day was less than 98% of the product of the last reported sale price of the Company’s common stock and the conversion rate on each such trading day, 3) if specified corporate transactions occur, or 4) if the Company calls any or all of the Convertible Notes for redemption, at any time prior to the close of business on the second business day immediately preceding the redemption date. On or after November 15, 2034, until the close of business on the second scheduled trading day immediately preceding the maturity date, a holder may convert all or a portion of its Convertible Notes at any time, regardless of the foregoing circumstances.
On February 20, 2022, February 20, 2025 and February 20, 2030 and if the Company undergoes a “fundamental change” (as defined in the indenture governing the Convertible Notes (the “Indenture”)), subject to certain conditions, a holder will have the option to require the Company to repurchase all or a portion of its Convertible Notes for cash at a repurchase price equal to 100% of the principal amount of the Convertible Notes to be repurchased, plus any accrued and unpaid interest, if any, to, but excluding, the relevant repurchase date. In addition, upon the occurrence of a “make-whole fundamental change” (as defined in the Indenture) or if the Company delivers a redemption notice prior to February 20, 2022, the Company will, in certain circumstances, increase the conversion rate for a holder that converts its Convertible Notes.
The Company may not redeem the Convertible Notes prior to February 20, 2019. The Company may, at its option, redeem all or part of the Convertible Notes at any time (i) on or after February 20, 2019 if the last reported sale price per share of the Company’s common stock has been at least 130% of the conversion price then in effect for at least 20 trading days during any 30 consecutive trading day period ending on, and including, the trading day immediately preceding the date on which the Company provides written notice of redemption and (ii) on or after February 20, 2022 regardless of the sale price condition described in clause (i), in each case, at a redemption price equal to 100% of the principal amount of the Convertible Notes to be redeemed, plus accrued and unpaid interest to, but excluding, the redemption date. Upon conversion of any Convertible Note, the Company shall pay or deliver to the converting Holder, cash, shares of Common Stock or a combination of cash and shares of the Company’s common stock, at the Company’s election.
The Company separated the notes into liability and equity components. The carrying amount of the liability component of $69.5 million was calculated by measuring the fair value of similar liabilities that do not have an associated convertible feature. The carrying amount of the equity component was calculated to be $13.0 million, and represents the conversion option which was determined by deducting the fair value of the liability component from the principal amount of the notes. This difference represents a debt discount that is amortized to interest expense over the term of the Convertible Notes. The equity component is not remeasured as long as it continues to meet the conditions for equity classification.
In accounting for the direct transaction costs (the “issuance costs”) related to the Convertible Notes, the Company allocated the total amount of issuance costs incurred to the liability and equity components based on their relative values. The Company recorded issuance costs of $1.8 million and $0.3 million to the liability and equity components, respectively. Issuance costs, including fees paid to the initial purchasers who acted as intermediaries in the placement of the Convertible Notes, attributable to the liability component are presented in the Consolidated Balance Sheets as a direct deduction from the carrying amount of the debt instrument and are amortized to interest expense over the term of the Convertible Notes in the Consolidated Statements of Operations, and the issuance costs attributable to the equity component were netted with the equity component and included within Additional paid-in capital in the Consolidated Balance Sheets. Interest cost related to the amortization expense of the issuance costs associated with the liability component was not material for the years ended December 31, 2016 and 2015.
As of December 31, 2016 and 2015, the outstanding principal on the Convertible Notes was $82.5 million, and the carrying amount of the liability component, net of the unamortized debt issuance costs and discount associated with the equity component, was $69.0 million and $68.3 million, respectively.
EMC Senior Secured Credit Facility
In connection with the EMC Acquisition, the Company assumed and became guarantor of legacy EMC indebtedness comprising (i) a First Lien Credit Agreement, dated as of July 1, 2015, as amended, by and among EMC, Morgan Stanley Senior Funding, Inc., as the Administrative Agent, the guarantors party thereto and the lenders from time to time party thereto (as amended, modified or otherwise supplemented from time to time, the “EMC First Lien Credit Agreement”) and (ii) a Second Lien Credit Agreement, dated as of July 1, 2015, as amended, by and among EMC, Morgan Stanley Senior Funding, Inc., as the Administrative Agent, the guarantors party thereto and the lenders from time to time party thereto (as amended, modified or otherwise supplemented from time to time, the “EMC Second Lien Credit Agreement” and together with the First Lien Credit Agreement, the “EMC Credit Facilities”).
The EMC First Lien Credit Agreement provided for loans in an original aggregate principal amount not to exceed $303.0 million, comprised of term loans (the “EMC First Lien Term Loans”) and revolving loans (the “First Lien Revolving Loans” and together with the First Lien Term Loans, the “First Lien Loans”). Under an Incremental Amendment dated June 29, 2016, the total revolving facility capacity under the EMC First Lien Credit Agreement was increased from $35.0 million to $75.5 million. As of the closing of the EMC Acquisition, the outstanding principal amounts of First Lien Term Loans and First Lien Revolving Loans were $265.3 million and $28.0 million, respectively. The remaining availability under First Lien Revolving Loans as of December 31, 2016 was $16.7 million. Subject to certain exceptions, First Lien Term Loans bore interest on the outstanding principal amount thereof from the applicable borrowing date at a rate per annum equal to (i) the Base Rate (as defined in the EMC First Lien Credit Agreement) plus 4.75% or (ii) at a rate per annum equal to the Eurocurrency Rate for each Interest Period (as defined in the First Lien Credit Agreement) plus 5.75%. Amounts borrowed under the First Lien Term Loans that were repaid or prepaid could not be re-borrowed. In addition, the EMC First Lien Credit Agreement required quarterly principal payments of 0.25% of the aggregate principal amount outstanding of First Lien Term Loans, subject to reduction as a result of the application of prepayments or cancellation of indebtedness in accordance with the terms of the EMC First Lien Credit Agreement. First Lien Revolving Loans bore interest at a rate based on the Base Rate, Eurocurrency Rate or EURIBOR Rate, each as defined in the EMC First Lien Credit Agreement (each such loan a “EURIBOR Rate Loan”). Subject to certain exceptions, First Lien Revolving Loans bore interest at varying rates based on the Consolidated First Lien Net Leverage Ratio (as defined in the First Lien Credit Agreement), which ratio ranged from greater than 3.50:1.00 (corresponding to a higher interest rate) to less than or equal to 3.00:1.00 (corresponding to a lower interest rate). The obligations of the First Lien Lenders to make loans under the EMC First Lien Credit Agreement were subject to customary conditions precedent. Subject to certain conditions, the First Lien Loans could have been voluntarily prepaid at any time without penalty or premium. The EMC First Lien Credit Agreement also provided for mandatory prepayments relating to excess cash flow, asset dispositions, and incurrence of indebtedness and casualty events, all subject to customary exceptions, conditions and qualifications. The EMC First Lien Credit Agreement also provided for the issuance of letters of credit in the amount equal to the lesser of $10.0 million and the aggregate amount of revolving facility capacity. As of December 31, 2016, the Company had outstanding letters of credit of $3.3 million under the EMC First Lien Credit Agreement.
The EMC First Lien Credit Agreement contained customary affirmative and negative covenants, as well as a financial covenant which required that the Company maintain a certain maximum Consolidated First Lien Net Leverage Ratio (as defined in the EMC First Lien Credit Agreement) measured at the end of each fiscal quarter for the life of the First Lien Loans, which Consolidated First Lien Net Leverage Ratio could not exceed 3.75 to 1.00 through the fourth fiscal quarter of 2017, 3.50 to 1.00 for each fiscal quarter in 2018, 3.25 to 1.00 for each fiscal quarter in 2019 and 3.00 to 1.00 for each fiscal quarter thereafter until the Latest Maturity Date (as defined in the EMC First Lien Credit Agreement). The First Lien Term Loans were set to mature on June 30, 2021. The First Lien Revolving Loans were set to mature on June 30, 2022.
The EMC Second Lien Credit Agreement provided for term loans (each such loan a “Second Lien Term Loan”) in an original aggregate principal amount not to exceed $92.0 million. As of the closing of the EMC Acquisition, the outstanding principal amount of Second Lien Term Loans was $92.0 million.
Second Lien Term Loans bore interest at a rate based on (i) the Base Rate, as defined in the EMC Second Lien Credit Agreement (each such loan, a “Second Lien Base Rate Loan”), or (ii) the Eurocurrency Rate, as defined in the EMC Second Lien Credit Agreement (each such loan, a “Second Lien Eurocurrency Loan”). Subject to certain exceptions set forth in the EMC Second Lien Credit Agreement, (i) each Second Lien Base Rate Loan bore interest on the outstanding principal amount thereof from the applicable borrowing date at a rate equal to the Base Rate plus 8.625% and (ii) each Second Lien Eurocurrency Loan bore interest on the outstanding principal amount thereof for each Interest Period (as defined in the EMC Second Lien Credit Agreement) at a rate equal to the Eurocurrency Rate for such Interest Period plus 9.625%. Amounts borrowed under the EMC Second Lien Credit Agreement that were repaid or prepaid could not be re-borrowed.
The EMC Second Lien Credit Agreement provided for mandatory prepayments relating to excess cash flow, asset dispositions, and incurrence of indebtedness and casualty events, all subject to customary exceptions, conditions and qualifications. The EMC Second Lien Credit Agreement contained customary affirmative and negative covenants of the Second Lien Loan Parties, as well as a financial covenant which required that the Company maintain a certain maximum Consolidated Total Net Leverage Ratio (as defined in the EMC Second Lien Credit Agreement) measured at the end of each fiscal quarter for the life of the Second Lien Loans, which Consolidated Total Net Leverage Ratio could not exceed 5.75 to 1.00 through the fourth fiscal quarter in 2017, 5.50 to 1.00 for each fiscal quarter in 2018, 5.25 to 1.00 for each fiscal quarter in 2019 and 5.00 to 1:00 for each fiscal quarter thereafter until the Latest Maturity Date (as defined in the EMC Second Lien Credit Agreement). The Second Lien Term Loan were set to mature on June 30, 2020.
2017 Credit Agreement
On January 6, 2017, the Company refinanced the EMC Senior Secured Credit Facility with a six-year $500 million senior-secured term-loan facility (“2017 Term Loans”) and a five-year $85 million senior-secured revolving credit facility (“2017 Revolving Loans”) (collectively “2017 Credit Agreement”). The 2017 Term Loans initially bore interest on the outstanding principal amount thereof at a rate per annum equal to (i) the Eurocurrency Rate (as defined) plus 6.00% or (ii) the Base Rate (as defined) plus 5.00% for each Interest Period (as defined). The 2017 Credit Agreement requires quarterly principal amortization payments equal to 0.25% of the original aggregate principal amount of the 2017 Term Loans, with such amortization payments reduced for prepayments in accordance with the terms of the Credit Agreement. The 2017 Revolving Loans initially bore interest at a rate per annum equal to (i) the Base Rate plus 5.00% or (ii) the Eurocurrency Rate or EURIBOR (as defined) plus 6.00% until the delivery of financial statements for the first full fiscal quarter ending after the date of the 2017 Credit Agreement (the “Closing Date”). After the delivery of the financial statements, 2017 Revolving Loans bear interest at a rate based on the Base Rate, Eurocurrency Rate or EURIBOR (each as defined) plus an interest-rate spread thereon that varies based on the Consolidated First Lien Net Leverage Ratio (as defined). The spread thereon initially ranged from 4.50% to 5.00% for the Base Rate and 5.50% to 6.00% for the Eurocurrency Rate and EURIBOR. In May 2017 and October 2017, the interest rates and required quarterly principal amortization payments for the 2017 Term Loans and the interest rates and interest-rate spreads for the 2017 Revolving Loans were amended as described below. The 2017 Credit Agreement provides for the issuance of letters of credit in the amount equal to the lesser of $15.0 million and the aggregate amount of the revolving loan commitment.
The 2017 Credit Agreement is secured by substantially all of the Company’s and its subsidiaries’ tangible and intangible assets, including a pledge of all of the outstanding capital stock of substantially all of our domestic subsidiaries and 65% of the shares or equity interests of foreign subsidiaries, subject to certain exceptions.
The 2017 Credit Agreement contains various customary restrictive covenants that limit the Company’s ability to, among other things: create or incur liens on assets; make any investments, loans or advances; incur additional indebtedness, engage in mergers, dissolutions, liquidations or consolidations; engage in transactions with affiliates; make dispositions; and declare or make dividend payments. The 2017 Credit Agreement requires the Company to maintain compliance with a maximum consolidated first lien net leverage ratio, as set forth in the 2017 Credit Agreement. In addition, the 2017 Credit Agreement contains various customary representations and warranties, including whether a material adverse effect on the Company has occurred since January 6, 2017, the closing date of the credit agreement. One of the conditions to drawing on the revolving credit facility is confirmation that the representations and warranties in the 2017 Credit Agreement are true as of the date of borrowing, and if the Company is unable to make that confirmation, including that no material adverse effect has occurred, it will be unable to draw down further on the revolver.
First Amendment to Credit Agreement and Limited Waiver
On May 4, 2017, the Company signed a First Amendment and Limited Waiver to Credit Agreement (the “May 2017 Amendment”), whereby the lenders waived the following default events under the affirmative covenants. Failure to comply with the below requirements by the respective due dates would constitute an immediate event of default.
| |
• | Failure to deliver the 2016 annual financial statements by March 31, 2017: the waiver was to remain effective so long as the Company issued an earnings release for the fiscal quarter ended December 31, 2016 (“Earnings Release”) on or prior to June 30, 2017 and delivered its 2016 audited consolidated financial statements by July 31, 2017. The June 2017 Amendment, September 2017 Extension, First October 2017 Amendment, October 2017 Extension and Second October 2017 Amendment further amended this waiver as described below. |
| |
• | Failure to deliver the quarterly financial statements for the quarter ended March 31, 2017 by May 15, 2017: the waiver was to remain effective so long as the Company issued the Earnings Release on or prior to June 30, 2017 and delivered the unaudited consolidated financial statements for the quarter ended March 31, 2017 on or prior to July 31, 2017. The June 2017 Amendment, September 2017 Extension, First October 2017 Amendment and Second October 2017 Amendment further amended this waiver as described below. |
| |
• | Failure to deliver the Company’s budget to the Administrative Agent by April 30, 2017: the waiver was to remain effective so long as the Company delivered certain 2017 financial projections by May 31, 2017. The Company delivered its budget to the Administrative Agent by the required deadline. |
The following affirmative covenant was added requiring the Company furnish the following information on a Current Report on Form 8-K by May 31, 2017, and the failure to comply with the requirement would constitute an immediate event of default:
| |
• | estimated consolidated adjusted EBITDA of the Company for the fiscal quarter ended December 31, 2016 with a range of no greater than $5,000,000; and |
| |
• | the current consolidated cash balance, current cash balance of the Company’s foreign subsidiaries, and the current outstanding balance under the 2017 Revolving Loans. |
The Company compiled with this affirmative covenant by the required deadline.
Under the 2017 Credit Agreement (as amended by the May 2017 Amendment), the Initial Term Loans (as defined) bore interest on the outstanding amount at a rate per annum equal to either (i) the Base Rate plus 6.00% or (ii) the Eurocurrency Rate for each Interest Period plus 7.00%, but those interest rates increased in October 2017 as described below.
The 2017 Revolving Loans bore interest at a rate equal to either (i) the Base Rate plus 6.00% or (ii) the Eurocurrency Rate or EURIBOR plus 7.00% until the Company delivers its unaudited financial statements for the quarter ending June 30, 2017, but those interest rates increased in October 2017 as described below. After the delivery of the unaudited financial statements, the 2017 Revolving Loans will bear interest at a rate based on the Base Rate, Eurocurrency Rate or EURIBOR plus an interest-rate spread thereon that varies on the Consolidated First Lien Net Leverage Ratio. The spread thereon ranges from 5.50% to 6.00% for the Base Rate and 6.50% to 7.00% for the Eurocurrency Rate and EURIBOR, but those spreads increased in October 2017 as described below.
The 2017 Credit Agreement (as amended by the May 2017 Amendment) requires quarterly principal amortization payments equal to (i) 0.625% of the original aggregate principal amount of the Initial Term Loans for each of the first eight quarterly payment dates after May 4, 2017 and (ii) 1.25% of the original aggregate principal amount of the Initial Term Loans for each quarterly payment date occurring thereafter.
The May 2017 Amendment modified certain restrictive covenants and a maximum Consolidated First Lien Net Leverage Ratio. In connection with the May 2017 Amendment, the Company paid each lender that consented to the amendment a consent fee equal to 1.0% of the aggregate principal amount of the Revolving Credit Commitments and outstanding Term Loans held by such lenders as of May 4, 2017. The fee paid totaled $5.6 million.
Amendment to First Amendment and Limited Waiver to Credit Agreement and Second Amendment to Credit Agreement
On June 29, 2017, the Company entered into an Amendment to First Amendment and Limited Waiver to Credit Agreement and Second Amendment to Credit Agreement (the “June 2017 Amendment”). Pursuant to the June 2017 Amendment:
| |
• | The Company was no longer required to deliver an earnings release for the fiscal quarter ended December 31, 2016 by June 30, 2017. |
| |
• | The Company had until September 15, 2017 (rather than July 31, 2017 as required under the May 2017 Amendment) to deliver its audited annual financial statements for the year ended December 31, 2016 (together with the related audit report and opinion from the Company’s independent accountants and the other items required by the Credit Agreement (as amended) to be delivered therewith, the “Annual Financial Statement Deliverables”). The September 2017 Extension, First October 2017 Amendment and Second October 2017 Amendment amended this requirement as described below. |
| |
• | The Company had up to 30 days following the date on which it delivers the Annual Financial Statement Deliverables to deliver its unaudited financial statements for both (i) the quarter ended March 31, 2017 (versus a required delivery date of July 31, 2017 under the 2017 Credit Agreement) and (ii) the quarter ended June 30, 2017. The September 2017 Extension, First October 2017 Amendment and Second October 2017 Amendment amended this requirement as described below. |
Under the June 2017 Amendment, the Company agreed to pay to the lenders that consented to the June 2017 Amendment (“June 2017 Consenting Lenders”): (i) if the Company has not delivered the Annual Financial Statement Deliverables on or prior to June 30, 2017, a fee in an amount equal to 0.25% of the aggregate principal amount of the revolving credit commitments and term loans held by the June 2017 Consenting Lenders as of June 30, 2017, payable on or prior to July 6, 2017 ; (ii) if the Company has not delivered the Annual Financial Statement Deliverables on or prior to July 31, 2017, a fee in an amount equal to 0.25% of the aggregate principal amount of the revolving credit commitments and term loans held by the June 2017 Consenting Lenders as of July 31, 2017, payable on or prior to August 3, 2017; and (iii) if the Company has not delivered the Annual Financial Statement Deliverables on or prior to August 31, 2017, a fee in an amount equal to 0.25% of the aggregate principal amount of the revolving credit commitments and term loans held by the June 2017 Consenting Lenders as of August 31, 2017, payable on or prior to September 6, 2017. The fees paid pursuant to this paragraph totaled $3.9 million.
Second Amendment to Limited Waiver to Credit Agreement
On September 13, 2017, the Company entered into a Second Amendment to Limited Waiver to Credit Agreement (the “September 2017 Extension”) that amends the June 2017 Amendment as follows:
| |
• | The Company would have until September 30, 2017 (rather than September 15, 2017 as previously required under the June 2017 Amendment) to deliver the Annual Financial Statement Deliverables. |
| |
• | The Company would also continue to have up to 30 days (as provided for in the June 2017 Amendment) following the date on which it delivers the Annual Financial Statement Deliverables to deliver its unaudited financial statements for both the quarter ended March 31, 2017 and the quarter ended June 30, 2017. |
The First October 2017 Amendment and Second October 2017 Amendment amended these requirements as described below.
Under the September 2017 Extension, the Company agreed to pay to the lenders that consented to the September 2017 Extension (the “September 2017 Consenting Lenders”) a fee in an amount equal to 0.25% of the aggregate principal amount of the Revolving Credit Commitments and Term Loans held by the September 2017 Consenting Lenders as of September 13, 2017. The fee paid totaled $1.4 million.
Third Amendment to Limited Waiver and Third Amendment to Credit Agreement
On October 2, 2017, the Company entered into a Third Amendment to Limited Waiver to Credit Agreement and Third Amendment to Credit Agreement (the “First October 2017 Amendment”) that amends the Credit Agreement and May 2017 Amendment as follows:
| |
• | The Company would have until October 31, 2017 (rather than September 30, 2017 as previously required under the September 2017 Extension) to deliver the Annual Financial Statement Deliverables. The Company would also continue to have up to 30 days following the date on which it delivers the Annual Financial Statement Deliverables to deliver its unaudited financial statements for both the quarter ended March 31, 2017 and the quarter ended June 30, 2017. The Second October 2017 Amendment amended this requirement as described below. |
| |
• | The Company would have up to 30 days following the date on which it delivers its unaudited financial statements for both the quarter ended March 31, 2017 and the quarter ended June 30, 2017 to deliver its unaudited financial statements for the quarter ended September 30, 2017. The Second October 2017 Amendment amended this requirement as described below. |
| |
• | Under the 2017 Credit Agreement (as amended by the First October 2017 Amendment), the Initial Term Loans (as defined) bear interest on the outstanding amount at a rate per annum equal to either (i) the Base Rate plus 6.25% or (ii) the Eurocurrency Rate for each Interest Period plus 7.25%. The Second October 2017 Amendment further amended these interest rates as described below. |
| |
• | Under the 2017 Credit Agreement, the 2017 Revolving Loans bear interest at a rate equal to either (i) the Base Rate plus 6.25% or (ii) the Eurocurrency Rate or EURIBOR plus 7.25% until the Company delivers its unaudited financial statements for the quarter ending March 31, 2018. After the delivery of those unaudited financial statements, the 2017 Revolving Loans will bear interest at a rate based on the Base Rate, Eurocurrency Rate or EURIBOR plus an interest-rate spread thereon that varies on the Consolidated First Lien Net Leverage Ratio. The spread thereon ranged from 5.75% to 6.25% for the Base Rate and 6.75% to 7.25% for the Eurocurrency Rate and EURIBOR. The Second October 2017 Amendment further amended these interest rates as described below. |
| |
• | The “non-call period” would now extend until: (i) if the Company prepays any Term Loans prior to the date that it delivers the Annual Financial Statement Deliverables, October 31, 2019; and (ii) if the Company prepays any Term Loans on or after the date that it delivers the Annual Financial Statement Deliverables, the earlier of (x) the second anniversary of the date of that delivery and (y) October 31, 2019. (The “non-call period” (as so extended) is referred to as the “Extended Non-Call Period.”) This period previously expired in May 2019 under the terms of the May 2017 Amendment. We remain subject to 2.0% and 1.0% prepayment premiums through the first and second anniversaries, respectively, of the end of the Extended Non-Call Period, which periods previously expired in May 2020 and May 2021, respectively. |
| |
• | The Company would issue on or prior to October 6, 2017 an earnings release for the fiscal quarter and fiscal year ended December 31, 2016, including a related balance sheet, statement of income and statement of cash flows. This is a new affirmative covenant under the 2017 Credit Agreement. The October 2017 Extension amended this requirement as described below. |
| |
• | The Company would furnish on a Current Report on Form 8-K on or prior to October 12, 2017: (i) the range of its (A) total estimated revenue and (B) estimated adjusted EBITDA, in each case for the fiscal quarters ended March 31, 2017 and June 30, 2017, with the difference between the high end and low end of the ranges to be no greater than $5.0 million; and (ii) a forecast of its consolidated cash balance as of December 31, 2017. This is a new affirmative covenant for the Company under the 2017 Credit Agreement. The Company complied with this affirmative covenant by the due date. |
| |
• | The Company will continue (on a bi-weekly basis commencing October 11, 2017 until it has delivered the Annual Financial Statement Deliverables) to furnish or file on a Current Report on Form 8-K its current consolidated cash balance, the current cash balance of its foreign subsidiaries and the current outstanding balance under the Revolving Credit Facility. The Company will also participate in one conference call with the Administrative Agent and the Lenders with respect to the information contained in that Current Report on Form 8-K. |
Under the First October 2017 Amendment, the Company agreed to pay to the lenders that consented to the October 2017 Amendment (the “First October 2017 Amendment Consenting Lenders”) a fee in an amount equal to 0.25% of the aggregate principal amount of the Revolving Credit Commitments and Term Loans held by the First October 2017 Amendment Consenting Lenders as of October 2, 2017. The fee paid totaled $1.4 million.
October Extension Letter Agreement
Under the First October 2017 Amendment, the Company was required to issue an earnings release for the fiscal quarter and fiscal year ended December 31, 2016 by October 6, 2017. On October 6, 2017, the Company entered into a letter agreement (the “October 2017 Extension”) permitting it to have until the date that it delivers the Annual Financial Statement Deliverables to issue the earnings release. The Company complied with this affirmative covenant on October 18, 2017.
Fourth Amendment to Limited Waiver and Fourth Amendment to Credit Agreement
On October 31, 2017, the Company entered into a Fourth Amendment to Limited Waiver to Credit Agreement and Fourth Amendment to Credit Agreement (the “Second October 2017 Amendment”) that amends the 2017 Credit Agreement and May 2017 Amendment as follows:
| |
• | The Company would have until November 15, 2017 (rather than October 31, 2017 as previously required under the First October 2017 Amendment) to deliver the Annual Financial Statement Deliverables. The November Extension Letter Agreement amended this requirement as described below. |
| |
• | The Company would have until January 2, 2018 to deliver its unaudited financial statements for the quarters ended March 31, 2017, June 30, 2017 and September 30, 2017. |
| |
• | Under the 2017 Credit Agreement (as amended by the Second October 2017 Amendment), the Initial Term Loans (as defined) bear interest on the outstanding amount at a rate per annum equal to either (i) the Base Rate plus 6.50% or (ii) the Eurocurrency Rate for each Interest Period plus 7.50%. |
| |
• | Under the 2017 Credit Agreement (as amended by the Second October 2017 Amendment), the 2017 Revolving Loans bear interest at a rate equal to either (i) the Base Rate plus 6.50% or (ii) the Eurocurrency Rate or EURIBOR plus 7.50% until the Company delivers its unaudited financial statements for the quarter ending March 31, 2018. After the delivery of those unaudited financial statements, the 2017 Revolving Loans will bear interest at a rate based on the Base Rate, Eurocurrency Rate or EURIBOR plus an interest-rate spread thereon that varies on the Consolidated First Lien Net Leverage Ratio. The spread thereon ranged from 6.00% to 6.50% for the Base Rate and 7.00% to 7.50% for the Eurocurrency Rate and EURIBOR. |
The Company will furnish on a Current Report on Form 8-K on or prior to December 5, 2017: (i) the range of its (A) total estimated revenue and (B) estimated adjusted EBITDA for the fiscal quarter ended September 30, 2017, with the difference between the high end and low end of the ranges to be no greater than $5.0 million. This is a new affirmative covenant for the Company under the 2017 Credit Agreement.
November Extension Letter Agreement
Under the Second October 2017 Amendment, the Company was required to deliver the Annual Financial Statement Deliverables by November 15, 2017. On November 15, 2017, the Company entered into a letter agreement permitting it to have until November 17, 2017 to deliver the Annual Financial Statement Deliverables.
Other Debts
In connection with the acquisition of IFES on October 18, 2013, the Company assumed approximately $1.3 million of debt in the form of two facility letters for a commercial mortgage loan with a bank for $0.2 million and $1.1 million. The commercial mortgage loan for $0.2 million matured in October 2014 and the remaining outstanding balance and accrued interest was repaid at the maturity. The $1.1 million mortgage letter matures in October 2032 and bears interest at a rate equal to 1.75%. Interest is paid on a monthly basis. There was no accrued interest on the mortgage letter as of December 31, 2016 and 2015. As of December 31, 2016 and 2015, there were $0.7 million and $0.9 million in borrowings outstanding under the remaining facility letter, respectively.
In addition, in connection with the EMC Acquisition in July 2016, the Company assumed approximately $1.1 million of capital lease obligations. The Company recorded an additional $1.0 million capital lease obligation during 2016, which along with the capital lease obligation assumed in connection with the EMC Acquisition, expires in 2020. As of December 31, 2016 and 2015, the Company had $2.0 million and $0.6 million of capital lease obligations, respectively, included in Other debt.
Citibank Loans
On December 22, 2014, the Company entered into a Credit Agreement with Citibank (the “Former Citibank Credit Agreement”), providing for $2.4 million of term loans (the “Former Citibank Term Loans), which the Company used to repay in full the term loan held by PMG (the “PMG Term Loan”) and the letter of credit held by PMG (the “PMG LOC”), and a revolving line of credit (the “Former Citibank Revolving Loans”) in an amount not to exceed $20.0 million. The Former Citibank Term Loans bore interest at a floating rate based on LIBOR plus an applicable interest margin per annum and were to mature on December 22, 2017. A total of $0.2 million of the principal amount of the Former Citibank Term Loans plus any accrued and unpaid interest
was to be repaid at the end of each quarter. The outstanding balance of the Citibank Term Loans was prepayable in whole or in part at any time without penalty. As of December 31, 2015, there was $1.3 million outstanding under the Citibank Term Loans and $20.0 million available for future borrowings under the Citibank Revolving Loans. The Company repaid the outstanding balance and terminated the Citibank Credit Agreement on July 27, 2016.
Contractual Obligations
The following table summarizes our contractual obligations as of December 31, 2016 that require us to make future cash payments. The future contractual requirements include payments required for our operating leases and contractual purchase agreements.
|
| | | | | | | | | | | | | | | | | | | |
| Payments due by period |
(in thousands, except as stated in footnotes to table) | Total | | Less than 1 year | | 1-3 years | | 3-5 years | | More than 5 years |
Operating lease obligations | $ | 23,840 |
| | $ | 5,407 |
| | $ | 6,267 |
| | $ | 5,124 |
| | $ | 7,042 |
|
Capital lease obligations | 2,162 |
| | 758 |
| | 1,065 |
| | 339 |
| | — |
|
EMC deferred consideration (1) | 25,000 |
| | 25,000 |
| | — |
| | — |
| | — |
|
Satellite commitments (2) | 447,518 |
| | 94,269 |
| | 139,924 |
| | 78,635 |
| | 134,690 |
|
Deferred revenue arrangements (3) | 8,506 |
| | 6,970 |
| | 1,032 |
| | 362 |
| | 142 |
|
Long-term debt obligations (4), (5) | 495,291 |
| | 2,968 |
| | 5,825 |
| | 311,520 |
| | 174,978 |
|
Contingent consideration obligations (6) | 1,988 |
| | 1,883 |
| | — |
| | 105 |
| | — |
|
Content and television license fees and guarantees (7) | 69,062 |
| | 46,207 |
| | 20,804 |
| | 1,901 |
| | 150 |
|
Equipment and engineering purchase commitments (8) | 39,994 |
| | 38,994 |
| | 1,000 |
| | — |
| | — |
|
Total | $ | 1,113,361 |
| | $ | 222,456 |
| | $ | 175,917 |
| | $ | 397,986 |
| | $ | 317,002 |
|
| |
(1) | In connection with the EMC Acquisition, the Company was required to pay the former EMC equity holders up to an additional $25.0 million on July 27, 2017 in, at the Company’s option: cash, newly issued shares of the Company’s common stock or a combination of cash and newly issued shares of the Company’s common stock. The Company elected to pay such amounts in shares of common stock and issued 5,080,049 shares of common stock to the former EMC equity holders on July 27, 2017. |
| |
(2) | Amounts represent future satellite cost commitments to Intelsat Corporation, Hughes Network Systems and SES over the period January 1, 2017 through December 31, 2028. |
| |
(3) | Amounts represent obligations to provide service for which we have already received cash from our customers. |
| |
(4) | Includes amounts pertaining to the Convertible Senior Notes, debt assumed with the EMC Acquisition and related interest and other debts. The Company refinanced the debt assumed with the EMC Acquisition on January 6, 2017. The amounts included in the table above reflect the scheduled maturities without consideration of the refinancing. Interest payments were calculated based upon the interest rate in effect at December 31, 2016. See also Note 10. Financing Arrangements. |
| |
(5) | Includes amounts pertaining to a mortgage loan assumed for a building acquired in the IFES acquisition. |
| |
(6) | The amounts above include earn-out liabilities for business combinations. These amounts also include future obligations relating to employee compensation as part of the masFlight acquisition. Amounts above represent estimated payouts, while actual maximum payouts total $13.5 million. |
| |
(7) | Amounts represent minimum guarantees and contractual obligations associated with licensing and providing our content and Internet protocol television services to our customers. |
| |
(8) | Equipment and engineering purchase commitments represent purchase commitments for Connectivity equipment inventory and antenna and engineering development projects. The Company has purchase commitments with various providers of equipment for the Company’s connectivity services. As of December 31, 2016, the Company has committed to purchase $36.5 million of future products which it expects to purchase during the year ended December 31, 2017. |
Excluded from the table above is $16.1 million related to our uncertain tax positions due to the uncertainty of their timing. Also excluded is $4.5 million of the obligation to issue shares of our common stock or the equivalent in cash, at our discretion, associated with a legal settlement whereby our share issuance/payment is contingent upon the share price of our common stock exceeding certain thresholds.
Off-Balance Sheet Arrangements
We do not have any off-balance sheet arrangements that have or are reasonably likely to have a current or future effect on our financial condition, changes in financial condition, revenue or expenses, results of operations, liquidity, capital expenditures or capital resources that is material to investors.
ITEM 7A. QUANTITATIVE AND QUALITATIVE DISCLOSURE ABOUT MARKET RISKS
Market risk is the sensitivity of income to changes in interest rates, foreign exchange rates, commodity prices, equity prices and other market driven rates or prices.
Market Risk
Media & Content Segment
Our Media & Content segment has exposure primarily to two types of market risk: changes in foreign currency exchange rates and interest rates. We do not hold or issue financial instruments for trading purposes.
The following sections provide information on exposure to foreign currency exchange rate risk and interest rate risks. Parts of our Media & Content segment make use of sensitivity analysis that are inherently limited in estimating actual losses in fair value that can occur from changes in market conditions.
Connectivity Segment
Our Connectivity segment (formerly our Aviation Connectivity and Maritime & Land Connectivity segments) is generally not exposed to any material risk associated with foreign currency exchange rates or equity prices. We do not hold or issue financial instruments for trading purposes. The Connectivity segment has indirect exposure to changes in commodity prices (i.e., the price of jet fuel) because a key aspect of the decision by our potential customers to purchase the connectivity products is the effect such products may have on an aircraft’s fuel burn.
Interest Rate Risk
We are exposed to the impact of interest rate changes and manage this exposure through the use of variable-rate and fixed-rate debt. We do not enter into derivative contracts for trading purposes and do not use leveraged instruments. The information below summarizes our market risks associated with debt obligations as of December 31, 2016. See Note 10. Financing Arrangements to the consolidated financial statements in Item 15. Exhibits and Financial Statement Schedule. Fair values were computed using market quotes. For debt obligations, the table presents principal cash flows and related interest rates by contractual year of maturity. Variable interest rates disclosed represent the weighted-average rates of the portfolio at December 31, 2016.
|
| | | | | | | | | | | | | | | | | | | | | | | | | | | | | | | |
| Expected Year of Maturity |
(in millions) | 2017 | | 2018 | | 2019 | | 2020 | | 2021 | | Thereafter | | Total | | Fair Value |
Debt: | | | | | | | | | | | | | | | |
Fixed rate | $ | — |
| | $ | — |
| | $ | — |
| | $ | — |
| | $ | — |
| | $ | 82.5 |
| | $ | 82.5 |
| | $ | 67.4 |
|
Average interest rate | — | % | | — | % | | — | % | | — | % | | — | % | | 2.8 | % | | 2.8 | % | | |
Variable rate | $ | 2.7 |
| | $ | 2.7 |
| | $ | 2.7 |
| | $ | 58.2 |
| | $ | 253.2 |
| | $ | 92.0 |
| | $ | 411.5 |
| | $ | 403.0 |
|
Average interest rate | 6.8 | % | | 6.8 | % | | 6.8 | % | | 5.9 | % | | 6.8 | % | | 10.6 | % | | 7.5 | % | | |
Foreign Currency Exchange Rate Risk
Our foreign Media & Content segment operations are exposed to fluctuations in foreign currency exchange rates. Currency risks arise from the fact that both sales to customers and most of their film license costs or film rights purchases are largely effected in U.S. dollars while a significant portion of our Media & Content segment’s fixed and overhead costs are incurred in Euros, British pounds and Canadian dollars. We may engage in hedging transactions from time to time to counteract direct currency risks. However, there can be no assurance that all currency risks have been or will be hedged in full, and we currently do not have a formal hedging program. Severe currency fluctuations could also cause the hedging transactions to fail if agreed thresholds are not met or exceeded. Therefore, substantial negative foreign currency effects may occur due to unforeseen exchange rate fluctuations and/or inaccurate assessments of market developments. Historically, we have not engaged in hedging transactions.
There are also intercompany receivables and liabilities such as loans that can generate significant foreign currency effects. Changes in the exchange rates of a number of foreign currencies against the Euro, especially the U.S. dollar and the Canadian dollar, could lead to the recognition of unrealized foreign exchange gains and losses in some cases, particularly as a result of intercompany transactions, including short term borrowings. We have sought to minimize the impact of intercompany borrowings by reducing the magnitude and quantity of intercompany borrowings. As of December 31, 2016, the Company had less than 40% of cash in foreign denominated currencies. A hypothetical 20% adverse movement in foreign currency exchange rates compared with the U.S. dollar relative to exchange rates at December 31, 2016, would have resulted in a decrease in fair value of cash of approximately $4.1 million on this date and an increase in net loss of the same amount.
ITEM 8. FINANCIAL STATEMENTS AND SUPPLEMENTARY DATA
ITEM 9. CHANGES IN AND DISAGREEMENTS WITH ACCOUNTANTS ON ACCOUNTING AND FINANCIAL DISCLOSURE
None.
ITEM 9A. CONTROLS AND PROCEDURES
Evaluation of Disclosure Controls and Procedures
Our management, with the participation of our Chief Executive Officer (“CEO”) and our Chief Financial Officer (“CFO”), evaluated the effectiveness of our disclosure controls and procedures as of December 31, 2016. The term “disclosure controls and procedures,” as defined in Rules 13a-15(e) and 15d-15(e) under the Securities Exchange Act of 1934, as amended (the “Exchange Act”), means controls and other procedures of a company that are designed to ensure that information required to be disclosed in the reports that it files or submits under the Exchange Act are recorded, processed, summarized and reported, within the time periods specified in the SEC’s rules and forms. Disclosure controls and procedures include, without limitation, controls and procedures designed to ensure that information required to be disclosed by a company in the reports that it files or submits under the Exchange Act is accumulated and communicated to the company’s management, including its principal executive officer and principal financial officer, as appropriate to allow timely decisions regarding required disclosure. In designing and evaluating the disclosure controls and procedures, management recognizes that any controls and procedures, no matter how well designed and operated, can provide only reasonable assurance of achieving the desired control objectives. In addition, the design of disclosure controls and procedures must reflect the fact that there are resource constraints and that management is required to apply its judgment in evaluating the benefits of possible controls and procedures relative to their costs.
As of the end of the period covered by this Annual Report on Form 10-K for the fiscal year ended December 31, 2016 (this “2016 Form 10-K”), we carried out an evaluation, under the supervision and with the participation of our management, including our CEO and CFO, of the effectiveness of our disclosure controls and procedures pursuant to Rule 13a-15 under the Exchange Act. Based upon that evaluation, as a result of the material weakness in our internal control over financial reporting identified in our Annual Report on Form 10-K for the fiscal year ended December 31, 2015 (the “2015 Form 10-K”) and additional material weaknesses in our internal control over financial reporting identified in 2016, as discussed below, our CEO and CFO have concluded that, as of the end of the period covered by this 2016 Form 10-K, our disclosure controls and procedures were not effective.
In light of the material weaknesses in our internal control over financial reporting, we performed additional analyses and other procedures to ensure that our consolidated financial statements included in this 2016 Form 10-K were prepared in accordance with accounting principles generally accepted in the United States (“GAAP”). Following such analyses and procedures, our management, including our CEO and CFO, has concluded that our consolidated financial statements present fairly, in all material respects, our financial position, results of our operations and our cash flows for the periods presented in this 2016 Form 10-K, in conformity with GAAP.
Management’s Report on Internal Control over Financial Reporting
Management is responsible for establishing and maintaining adequate “internal control over financial reporting,” as defined in Rules 13a-15(f) and 15d-15(f) under the Exchange Act. Our internal control over financial reporting is a process designed to provide reasonable assurance regarding the reliability of financial reporting and the preparation and fair presentation of our
published financial statements. All internal control systems, no matter how well designed, have inherent limitations. Therefore, even those systems determined to be effective can provide only reasonable assurance with respect to financial statement preparation and presentation. Because of its inherent limitations, a system of internal control over financial reporting may not prevent or detect misstatements.
Management assessed the effectiveness of our internal control over financial reporting as of December 31, 2016. In making this assessment, management used the criteria set forth by the Committee of Sponsoring Organizations of the Treadway Commission in Internal Control—Integrated Framework (2013) (the “COSO Framework”). Based on its assessment, our management, including our CEO and CFO, has concluded that our internal control over financial reporting was not effective as of December 31, 2016 due to material weaknesses in our internal control over financial reporting described below. As discussed elsewhere in this 2016 Form 10-K, on July 27, 2016, we acquired Emerging Markets Communications (“EMC”) and, as a result, we began integrating the processes, systems and controls relating to EMC into our existing system of internal control over financial reporting in accordance with our integration plans. Because we consummated the EMC acquisition mid-year in 2016, management’s assessment of the effectiveness of our internal control over financial reporting as of December 31, 2016 did not include the internal controls of EMC. EMC represented $319 million of our total assets and ($225) million of our net assets (liabilities) as of December 31, 2016, and generated $73 million of our revenue and $31 million of our net loss for the year then ended.
A material weakness is a deficiency, or combination of deficiencies, in internal control over financial reporting, such that there is a reasonable possibility that a material misstatement of annual or interim financial statements will not be prevented or detected on a timely basis.
A material weakness existed as of December 31, 2015 relating to the lack of a sufficient number of personnel to execute a timely financial close and properly accumulate certain analyses and reconciliations consistently in a timely and accurate manner. Additional material weaknesses arose during fiscal 2016, primarily because of the growth of the Company, the increased complexity of its business transactions and the increased decentralization of its operations. These changes were not supported by a sufficient increase in employee headcount, including the retention of a sufficient number of highly qualified accounting, finance and information technology (“IT”) personnel, or by other elements of our system of internal control over financial reporting. Moreover, we experienced significant changes in our executive management in 2016. All of these material weaknesses are described below.
Entity-Level Control Environment
Our entity-level control environment did not adequately support the prevention or detection and correction of material misstatements. We identified deficiencies in each of the five components of our entity-level control environment, aggregating to material weaknesses in each component:
Control Environment – Under the COSO Framework, the board of directors and senior management establish the tone at the top regarding the importance of internal controls and management reinforces expectations at the various levels of the company. We did not maintain an environment that sufficiently stressed the importance of internal controls and the emphasis placed on them in determining certain of the company’s policies, processes and organizational structure, including as it relates to our IT environment. There was not effective discipline and structure within the company to influence the control consciousness of our personnel. We did not sufficiently demonstrate a commitment to attract, develop and retain qualified personnel, and as a result we did not have an adequate complement of personnel with an appropriate level of knowledge and experience commensurate with the growth and complexity of our business. There was not sufficient oversight over our financial reporting process and internal control environment. We did not take sufficient actions to demonstrate the need for accountability with respect to maintaining effective internal control over financial reporting, nor did we provide sufficient education to our staff on their internal control responsibilities. We did not sufficiently analyze control deficiencies to identify trends and root causes and evaluate whether modification of certain policies, communications, training or controls was necessary, nor did we sufficiently emphasize the timely remediation of such control deficiencies.
Risk Assessment – We did not sufficiently identify and analyze risks to achieve our corporate objectives and form a comprehensive basis for determining how risks should be managed, including; (i) enterprise risks; (ii) certain IT risks, as further described below; (iii) certain account-specific risks, as further described below; and (iv) risks arising from the changes in our business environment, specifically the acquisition of EMC and other non-routine transactions that occurred during the year. We did not sufficiently consider new potential sources of risk of material misstatement in our financial reporting relating to our operations at certain geographic locations where we conduct operations. We did not sufficiently consider the risk of fraud.
Control Activities – We did not sufficiently design, implement, and maintain control activities at the transaction level that mitigate the risk of material misstatement in our financial reporting, resulting in the transaction-level material weaknesses
described below. We did not develop our policies and procedures at a sufficient level of precision to support the operating effectiveness of the controls, nor did we emphasize the need to retain the required documentation to demonstrate and ensure that controls consistently operated at a sufficient level of precision to prevent and detect potential errors. Also, we did not develop appropriate IT policies and procedures, and as further described below, our IT environment did not adequately support the achievement of our objectives.
Information and Communication – We did not perform sufficient procedures, as part of the aforementioned control activities, to validate the completeness and accuracy of underlying data used in the performance of controls over accounting transactions and disclosures. This impacted the design effectiveness of such control activities, contributing to the material weaknesses listed below. Also, we did not effectively communicate information, including objectives and responsibilities for internal control, necessary to support the functioning of internal control, both internally and to external parties. Our training program was not effective at ensuring internal control responsibilities were properly communicated to and performed by our personnel.
Monitoring – We did not allocate sufficient and qualified resources to design and execute effective monitoring of our internal controls to ascertain if the components of internal control were present and functioning. In addition, we did not perform effective monitoring over the timely remediation of identified control deficiencies.
Financial Statement Close and Reporting Process
The material weakness in our financial statement close and reporting process surrounding resources and timeliness as identified in our 2015 Form 10-K had not yet been remediated as of December 31, 2016. We lacked a sufficient number of qualified personnel to execute, review and approve all aspects of the financial statement close and reporting process. Also, we had not sufficiently designed and implemented effective internal controls to allow us to close our books and records and report our results, including required disclosures, on a timely basis.
Intercompany Process
We did not have effective controls in place to authorize, identify, classify in the general ledger, reconcile and/or eliminate intercompany activity on a timely basis.
Business Combination
In connection with our acquisition of EMC, we did not identify a specific control owner on a timely basis to take overall responsibility for the accounting for the business combination and identification of all relevant accounting and valuation matters. We did not sufficiently document our verification of the completeness and accuracy of the financial due diligence materials used to approve the transaction. Also, we did not sufficiently design and execute internal controls to address risks relating to the completeness, consistency and accuracy of fair-value-measurement inputs provided to our third-party consultants. We did not sufficiently perform reviews relating to the reasonableness of assumptions and methodologies used and the mathematical accuracy of calculations in our consultants’ reports on the fair value of assets and liabilities and the determination of the consideration transferred for purposes of the allocation thereof. Finally, we did not design adequate controls around the evaluation of the completeness, existence and fair value of the acquired assets and liabilities for purposes of our purchase-price accounting, and around the identification of transaction costs for purposes of financial-statement disclosure.
As a result of these deficiencies and others indicated herein, we did not adjust our preliminary estimates of values assigned to certain intangibles in a timely manner.
Significant and Unusual Non-Routine Transactions
We did not have effective internal controls in place to identify and evaluate non-routine transactions and to assess, review and approve the appropriate accounting for such transactions on a timely basis.
Inventory
We did not design or maintain effective internal controls over the initiation, recording, processing and reporting of inventory transactions.
Content Library
We did not appropriately execute controls over the capitalization, balance sheet classification, amortization and impairment assessment of our content library assets with an appropriate level of documentation and precision.
Internally Developed Software
We did not have effective internal controls in place over the capitalization and amortization of internally developed software.
Long-Lived Assets
We did not appropriately execute controls over the processing and recording of long-lived assets and their related depreciation. We did not have effective controls to assess the existence of impairment indicators and/or to perform an impairment assessment of our customer relationship intangible assets in accordance with the relevant accounting guidance on a timely basis.
Goodwill Impairment
We did not identify a specific control owner to take overall responsibility for the accounting for goodwill impairment and identification of all relevant impairment indicators on a timely basis. Also, we did not sufficiently design and execute internal controls around the completeness and accuracy of the data provided to our third-party consultants for purposes of our goodwill impairment analysis. We also did not sufficiently review the consistency of the data inputs, the appropriateness of the assumptions and methodology used and the reasonableness of the conclusions in the consultants’ reports.
Accounts Payable and Accrued Liabilities
We did not have effective internal controls over the procurement of goods and services and invoice processing, or the completeness, existence and valuation of accounts payable and accrued liabilities. Specifically, controls over purchase order approval, invoice processing and expense reimbursements did not operate effectively.
Revenue Processes
We did not have effective controls over the initiation of revenue transactions, i.e., the approval of contracts, contract renewals and new customer set-up. Further, due to the manual nature of the processes and lack of adequate qualified resources, we could not perform timely implementation and/or operation of internal controls around invoicing review and approval, including pricing, revenue categorization and classification, revenue adjustments and revenue cut-off. Also, as described above under the Information and Communication component of the entity-level controls material weakness, we did not design effective controls over the completeness and accuracy of several key sources of data used in the performance of controls executed when processing invoicing and recording revenue accruals and deferrals, including billing grids, proof of delivery for certain content business units, and usage reports generated from our connectivity systems.
License Fee Accruals
We did not retain sufficient evidence of the procedures performed around the review of the completeness and valuation of license fee accruals. Also, we did not properly identify controls around the calculation of actual royalties and the payment of such obligations and the relief of the accruals. Also, we did not design effective controls over the completeness and accuracy of several key sources of data used in the performance of controls around the recording of license fee accruals, including billing grids and usage reports generated from our connectivity systems.
Income Taxes
During the 2016 fiscal year, we did not have a sufficient number of qualified personnel in the income tax function, which resulted in a lack of timely execution of internal controls, thereby increasing the risk of income tax accounting issues not being identified and addressed on a timely basis. For purposes of calculating the income tax provision and preparing the related income tax disclosures as of December 31, 2016, we did not sufficiently design or execute effective controls to address relevant financial statement assertions.
Payroll
We did not appropriately document our execution of the controls over the recording of payroll and related expenses. Specifically, we did not provide sufficient evidence of our testing of the completeness and accuracy of input data, spreadsheets and system generated reports used in the performance of these controls.
Stock-Based Compensation
We did not appropriately execute the controls that are designed to address the relevant financial statement assertions over stock-based compensation expense for existing plans. We did not have controls in place to determine the appropriate accounting for new stock-based compensation arrangements.
Treasury
We did not have appropriate controls in place over the valuation of certain financial liabilities, specifically in relation to the valuation methods selected and third-party pricing data used.
IT Processes
We identified multiple deficiencies in our IT processes related to the IT risks of certain applications used in our business processes. Such deficiencies related primarily to a newly implemented account reconciliation application and to the applications used in our revenues processes. The deficiencies consisted of insufficient consideration around the identification and management of IT risks, including those residing at decentralized locations and at service organizations; segregation of duties, unauthorized access and unauthorized changes to data; configurations, reports and application functionality; and proper and timely execution of the user access review by sufficiently qualified individuals.
Ernst & Young LLP, an independent registered public accounting firm, has audited our consolidated financial statements for the years ended December 31, 2016 and 2015 and has issued an adverse attestation report on the effectiveness of our internal control over financial reporting as of December 31, 2016, as stated in their report.
Remediation Plan
We have identified and begun to implement several steps, as further described below, to remediate the material weaknesses described in this Item 9A and to enhance our overall control environment. Although we intend to complete the remediation process as promptly as possible, we cannot at this time estimate how long it will take to remediate these material weaknesses, and our remediation plan may not prove to be successful. In addition, we may discover additional material weaknesses that require additional time and resources to remediate.
Our remediation process includes, but is not limited to:
| |
• | Implementing an internal controls training program across our Company, especially in the areas of retaining evidence of the level of precision at which controls are executed, and of the testing of the completeness and accuracy of information produced by the entity, used in the performance of the controls; |
| |
• | Augmenting and hiring additional knowledgeable and qualified accounting and finance resources and professionals; |
| |
• | Enhancing the robustness and effectiveness of our IT systems and control environment; |
| |
• | Designing a remediation plan for each of the material weaknesses, specifically improving the related policies and procedures, implementing new and/or enhancing the existing controls, and assessing and improving the skills of the process owners; |
| |
• | Evaluating the completeness and appropriateness of the remediation plan, and specifically verifying it addresses all the material weaknesses, both at the entity- and at the transaction-level, across all material locations and across all relevant departments; |
| |
• | Implementing the remediation plan, and specifically training the process owners, evaluating the adoption of the revised policies and procedures, and monitoring the results; |
| |
• | Testing and assessing the design and operating effectiveness of the updated controls; and |
| |
• | Management review and acceptance of the remediation effort. |
We believe that the foregoing efforts should effectively remediate the material weaknesses described in this Item 9A and enhance our overall control environment. Because the reliability of the internal control process requires repeatable execution and testing over multiple fiscal quarters, the successful remediation of these material weaknesses will require review and evidence of effectiveness prior to concluding that the controls are effective, and it is possible that additional remediation steps will be necessary.
As such, as we continue to evaluate and work to improve our internal control over financial reporting, our management may decide to take additional measures to address the material weaknesses or modify the remediation steps described above. Until these weaknesses are remediated, we plan to continue to perform additional analyses and other procedures to ensure that our consolidated financial statements are prepared in accordance with GAAP.
Changes in Internal Control over Financial Reporting
Except in connection with the continued post-closing integration of EMC, and for other matters discussed above, there was no change in our internal control over financial reporting that occurred during the fourth quarter of 2016 that has materially affected, or is reasonably likely to materially affect, our internal control over financial reporting.
REPORT OF INDEPENDENT REGISTERED PUBLIC ACCOUNTING FIRM
The Board of Directors and Stockholders of Global Eagle Entertainment Inc.
We have audited Global Eagle Entertainment Inc.’s internal control over financial reporting as of December 31, 2016, based on criteria established in Internal Control-Integrated Framework issued by the Committee of Sponsoring Organizations of the Treadway Commission (2013 framework), (the COSO criteria). Global Eagle Entertainment Inc.’s management is responsible for maintaining effective internal control over financial reporting, and for its assessment of the effectiveness of internal control over financial reporting included in the accompanying Management’s Report on Internal Control over Financial Reporting. Our responsibility is to express an opinion on the company’s internal control over financial reporting based on our audit.
We conducted our audit in accordance with the standards of the Public Company Accounting Oversight Board (United States). Those standards require that we plan and perform the audit to obtain reasonable assurance about whether effective internal control over financial reporting was maintained in all material respects. Our audit included obtaining an understanding of internal control over financial reporting, assessing the risk that a material weakness exists, testing and evaluating the design and operating effectiveness of internal control based on the assessed risk, and performing such other procedures as we considered necessary in the circumstances. We believe that our audit provides a reasonable basis for our opinion.
A company’s internal control over financial reporting is a process designed to provide reasonable assurance regarding the reliability of financial reporting and the preparation of financial statements for external purposes in accordance with generally accepted accounting principles. A company’s internal control over financial reporting includes those policies and procedures that (1) pertain to the maintenance of records that, in reasonable detail, accurately and fairly reflect the transactions and dispositions of the assets of the company; (2) provide reasonable assurance that transactions are recorded as necessary to permit preparation of financial statements in accordance with generally accepted accounting principles, and that receipts and expenditures of the company are being made only in accordance with authorizations of management and directors of the company; and (3) provide reasonable assurance regarding prevention or timely detection of unauthorized acquisition, use, or disposition of the company’s assets that could have a material effect on the financial statements.
Because of its inherent limitations, internal control over financial reporting may not prevent or detect misstatements. Also, projections of any evaluation of effectiveness to future periods are subject to the risk that controls may become inadequate because of changes in conditions, or that the degree of compliance with the policies or procedures may deteriorate.
As indicated in the accompanying Management’s Report on Internal Control over Financial Reporting, management’s assessment of and conclusion on the effectiveness of internal control over financial reporting did not include the internal controls of Emerging Markets Communications, which is included in the 2016 consolidated financial statements of Global Eagle Entertainment Inc. and constituted $319 million and $(225) million of total and net assets (liabilities), respectively, as of December 31, 2016 and $73 million and $31 million of revenues and net loss, respectively, for the year then ended. Our audit of internal control over financial reporting of Global Entertainment Inc. also did not include an evaluation of the internal control over financial reporting of Emerging Markets Communications.
A material weakness is a deficiency, or combination of deficiencies, in internal control over financial reporting, such that there is a reasonable possibility that a material misstatement of the company’s annual or interim financial statements will not be prevented or detected on a timely basis. The following material weaknesses have been identified and included in management’s assessment. Management has identified material weaknesses in controls related to entity level control environment, financial statement close and reporting process, intercompany process, business combination, significant and unusual non-routine transactions, inventory, content library, internally developed software, long lived assets, goodwill impairment, accounts payable and accrued liabilities, revenue processes, license fee accruals, income taxes, payroll, stock based compensation, treasury, and information technology processes. We also have audited, in accordance with the standards of the Public Company Accounting Oversight Board (United States), the consolidated balance sheets of Global Eagle Entertainment Inc. as of December 31, 2016 and 2015, and the consolidated statements of operations, comprehensive loss, stockholders’ equity and cash flows for each of the three years in the period ended December 31, 2016. The material weaknesses were considered in determining the nature, timing and extent of audit tests applied in our audit of the financial statements for fiscal year ended December 31. 2016, and this report does not affect our report dated November 17, 2017, which expressed an unqualified opinion on those financial statements.
In our opinion, because of the effect of the material weaknesses described above on the achievement of the objectives of the control criteria, Global Eagle Entertainment Inc. has not maintained effective internal control over financial reporting as of December 31, 2016, based on the COSO criteria.
/s/ Ernst & Young LLP
Los Angeles, California
November 17, 2017
ITEM 9B. OTHER INFORMATION
None.
PART III
ITEM 10. DIRECTORS, EXECUTIVE OFFICERS AND CORPORATE GOVERNANCE
Our current directors and executive officers are as follows:
|
| | | | |
Name | | Age | | Title |
Edward L. Shapiro | | 52 | | Director |
Jeffrey E. Epstein | | 61 | | Director |
Stephen Hasker | | 48 | | Director |
Jeffrey A. Leddy | | 62 | | Chief Executive Officer and Director |
Robert W. Reding | | 68 | | Director |
Jeff Sagansky | | 65 | | Director |
Harry E. Sloan | | 67 | | Director |
Ronald Steger | | 63 | | Director |
Paul Rainey | | 42 | | Chief Financial Officer |
Sarlina See | | 47 | | Chief Accounting Officer |
Joshua Marks | | 41 | | Executive Vice President, Connectivity |
Walé Adepoju | | 46 | | Executive Vice President, Media & Content |
Stephen Ballas | | 42 | | Executive Vice President, General Counsel and Corporate Secretary |
Edward L. Shapiro, 52, has been a member of our Board of Directors since February 2013 and has served as our Board Chair since that time. He served as a Managing Partner of PAR Capital Management, Inc. from 1997 to December 2016. Prior to joining PAR Capital, Mr. Shapiro was a Vice President at Wellington Management Company, LLP, and before that an analyst at Morgan Stanley & Co. Mr. Shapiro has served on the board of directors of United Continental Holdings, Inc. (NYSE: UAL) since April 2016, and he served on the board of US Airways from 2005 to 2008. Mr. Shapiro also served on the board of directors of SONIFI Solutions, Inc. from November 2010 to December 2016. Mr. Shapiro earned his BS in Economics from the Wharton School of the University of Pennsylvania and an MBA from UCLA Anderson School of Management.
We believe Mr. Shapiro is qualified to serve on our Board of Directors due to his extensive experience with travel, media and related businesses, considerable expertise in finance and financial matters, deep understanding of our aviation connectivity business through his service to Row 44 (one of our predecessor companies prior to our business combination with Row 44 and Advanced Inflight Alliance AG in January 2013) and the airline industry and his experience in corporate governance matters.
Jeffrey E. Epstein, 61, has been a member of our Board of Directors since February 2013. He is an Operating Partner at Bessemer Venture Partners, which he joined in November 2011. He has served on the board of directors of The Priceline Group (Nasdaq: PCLN) since April 2003 and is a member of that board’s Audit Committee and its Compensation Committee. He also serves on the board of directors of Shutterstock, Inc. (NYSE: SSTK) (since April 2012), and is Chair of that board’s Audit Committee and a member of its Nominating and Governance Committee. From September 2008 to April 2011, Mr. Epstein was Executive Vice President and Chief Financial Officer of Oracle Corporation (NYSE: ORCL). He also serves on the board of directors of Kaiser Permanente. Mr. Epstein holds an MBA from the Stanford University Graduate School of Business and a BA from Yale College.
We believe Mr. Epstein is qualified to serve on our Board of Directors due to his expertise in finance and financial reporting as a former chief financial officer of multiple publicly held companies, including Oracle Corporation, one of the world’s largest enterprise software companies.
Stephen Hasker, 48, has been a member of our Board of Directors since April 2015. He has been Global President and Chief Operating Officer of Nielsen N.V. (NYSE: NLSN) since 2009, and previously served as its President, Global Products. Mr. Hasker joined Nielsen in 2009 from McKinsey & Company, where he was a partner in McKinsey’s Global Media, Entertainment and
Information practice from 1998 to 2009. Prior to McKinsey, Mr. Hasker spent five years in several financial roles in the United States, Russia and Australia. Mr. Hasker holds an undergraduate degree from the University of Melbourne and has an MBA and a Masters in International Affairs from Columbia University. He is a member of the Australian Institute of Chartered Accountants.
We believe Mr. Hasker is qualified to serve on our Board of Directors due to his experience as a public company executive at Nielsen N.V., which provides him with insight into consumer tastes for entertainment, content and services, and his overall experience with media and entertainment businesses.
Jeffrey A. Leddy, 62, has been a member of our Board of Directors since February 2013 and has served as our Chief Executive Officer since February 2017. He previously served as Chief Executive Officer of Verizon Telematics, Inc. (formerly Hughes Telematics, Inc. prior to its acquisition by Verizon Communications in July 2012) from December 2006 until January 2015 and served as a member of its board of directors from April 2006 to July 2012. From 2005 to 2011, he served on the boards of directors of various Hughes Communications-affiliated companies. From April 2003 through December 2006, Mr. Leddy served as Chief Executive Officer and President of SkyTerra Communications, Inc., and he served on its board of directors from 2006 to 2008. Prior to becoming Skyterra’s Chief Executive Officer, Mr. Leddy served in the roles of President, Chief Operating Officer and Senior Vice President of Operations for that company. Mr. Leddy received his BA in Physics from the Georgia Institute of Technology and an MS in Electrical Engineering from Stanford University.
We believe Mr. Leddy is qualified to serve on our Board of Directors due to his extensive experience with satellite communications and telematics businesses and extensive executive experience, including his public company experience as a chief executive officer and director.
Robert W. Reding, 68, has been a member of our Board of Directors since January 2013. He has been a consultant in the commercial airline industry since January 2012. Prior to that, from September 2007 until December 2012, Mr. Reding was Executive Vice President—Operations for American Airlines and Executive Vice President of AMR Corporation. Prior to that, Mr. Reding served as Senior Vice President—Technical Operations for American Airlines from May 2003 to September 2007. Mr. Reding joined AMR Corporation in March 2000 and served as Chief Operations Officer of its AMR Eagle division through May 2003. Prior to joining AMR Corporation, Mr. Reding served as President and Chief Executive Officer of Reno Air (from 1992 to 1998) and as President and Chief Executive Officer of Canadian Regional Airlines (from 1998 to March 2000). Mr. Reding is a graduate of the United States Air Force pilot training program and served as an officer and pilot flight examiner with the United States Air Force from 1972 to 1979. He has an FAA Air Transport Pilot Rating for Douglas DC-9-MD-80 and Boeing 737 series aircraft and has accumulated over 10,000 hours as a commercial pilot. He is a member of the President’s Council of California State Polytechnic University and has served as a board member of various aviation, civic and charitable organizations. Mr. Reding received a BS in Aeronautical Engineering from California State Polytechnic University and his MBA from Southern Illinois University.
We believe Mr. Reding is qualified to serve on our Board of Directors due to his operating and management experience, including more than 20 years of experience in the airline industry.
Jeff Sagansky, 65, has been a member of our Board of Directors since May 2011. He served as our President from our formation as a special purpose acquisition company in 2011 until our business combination with Row 44 and Advanced Inflight Alliance AG in January 2013. Mr. Sagansky was President of Silver Eagle Acquisition Corp. (a special purpose acquisition company) from April 2013 until its business combination with Videocon d2h Limited (Nasdaq: VDTH) in March 2015, and he currently serves on Videocon d2h’s board of directors and on its Audit Committee. From January 2013 until December 2016, Mr. Sagansky was a member of the board of directors of Starz Entertainment (Nasdaq: STRZA, STRZB), where he served on that board’s Audit Committee and its Compensation Committee. Mr. Sagansky has been President and CEO of Double Eagle Acquisition Corp. (Nasdaq: EAGL) since June 2015. He is a member of the board of directors of Scripps Networks Interactive, Inc. (Nasdaq: SNI) and serves on the board’s Audit Committee and its Corporate Governance Committee. Mr. Sagansky served as Chairman of RHI Entertainment, Inc. from 2009 to 2011. He served as Co-Chairman of Peace Arch Entertainment Group, Inc. from 2007 to 2008, and served as its interim chief executive officer from November 2007 to July 2008. Mr. Sagansky earned a BA from Harvard College and an MBA from Harvard Business School.
We believe Mr. Sagansky is qualified to serve on our Board of Directors due to his extensive executive leadership experience with the management and operations of companies in the entertainment sector, including public companies in the television industry, as well as his depth of experience in the media and entertainment industries generally.
Harry E. Sloan, 67, has been a member of our Board of Directors since May 2011. He also served as our Chairman and Chief Executive Officer until our business combination with Row 44 and Advanced Inflight Alliance AG in January 2013. Mr. Sloan
was Chairman and Chief Executive Officer of Silver Eagle Acquisition Corp. (a special purpose acquisition company) from April 2013 through its business combination in March 2015 with Videocon d2h Limited (Nasdaq: VDTH). From October 2005 to August 2009, Mr. Sloan served as Chairman and Chief Executive Officer of Metro-Goldwyn-Mayer, Inc., and was its Chairman until January 2011. From 1990 to 2001, Mr. Sloan was Chairman and Chief Executive Officer of SBS Broadcasting, S.A., a company that he founded in 1990, and he served as its Executive Chairman until 2005. Mr. Sloan currently serves on the UCLA Anderson School of Management Board of Visitors and on the Executive Board of UCLA Theatre, Film and Television. Mr. Sloan received his BA degree from the University of California, Los Angeles and a JD from Loyola Law School.
We believe Mr. Sloan is qualified to serve on our Board of Directors due to his extensive background and experience as an executive in the media and entertainment industries and his substantial mergers-and-acquisitions experience.
Ronald Steger, 63, has been a member of our Board of Directors since April 2017 and has served as our Audit Committee Chair since June 2017. He has served on the board of directors of Overseas Shipholding Group, Inc. (NYSE: OSG) since August 2014 and currently serves on that board’s Audit Committee (as chair) and its Corporate Governance & Risk Committee. Mr. Steger previously served on the board of directors of International Seaways Inc. (NYSE: INSW) from November 2016 to June 2017, where he served on that board’s Audit Committee and its Corporate Governance & Risk Assessment Committee. Since September 2015, Mr. Steger has served as the Senior Technical Advisor to the Effectus Group, an accounting advisory firm based in Silicon Valley, and since February 2014, he has served on the Advisory Board of ATREG, Inc., a global advisory firm specializing in the semiconductor and related advanced technology verticals. Mr. Steger began his career with KPMG LLP in 1976 and was admitted into its partnership in 1986. He served as an SEC Reviewing Partner at KPMG LLP from 2003 to 2013 and retired from KPMG LLP in December 2013. Mr. Steger has a BS in Accounting from Villanova University.
We believe Mr. Steger is qualified to serve on our Board of Directors due to his experience serving on boards of public companies and his extensive background in accounting.
Paul Rainey, 42, joined our company as Executive Vice President and Chief Financial Officer in April 2017. Mr. Rainey previously served as Chief Financial Officer of Harris CapRock Communications from May 2014 to April 2017. Prior to Harris CapRock Communications, Mr. Rainey served as Chief Financial Officer of General Electric’s Lighting Professional Solutions business from March 2013 to April 2014 and as Chief Financial Officer of its Power Equipment business from March 2010 to February 2013. Prior to March 2010, Mr. Rainey served in two senior financial planning and analysis roles at General Electric from January 2007 to March 2010 and from October 2003 to October 2005. Between those appointments, Mr. Rainey served as a FamilyLife missionary from November 2005 to December 2006. Mr. Rainey currently serves on the boards of directors of Cutwell 4 Kids and America Responds with Love, and previously served on the boards of directors of Hesed Consulting, Georgia CASA and the Notre Dame Business Advisory Council. Mr. Rainey received a MS in Accountancy and a BBA in Finance and Computer Applications from the University of Notre Dame.
Sarlina See, 47, joined our company as Chief Accounting Officer in May 2017. Ms. See previously served as Global Business Unit Controller of Stanley Oil & Gas, which is a division of Stanley Black & Decker, Inc. (NYSE:SWK), from May 2013 to May 2017. From January 2008 through May 2013, Ms. See served as the Global Controller at Digital Energy, a division of GE Energy Connections (which is a business unit of General Electric Company (NYSE:GE)). Prior to that, Ms. See held other senior finance positions and audit roles at various General Electric Company business units from 1997 to 2007. Ms. See received a Bachelor of Business Administration in Accounting from Idaho State University and is a Certified Public Accountant.
Joshua B. Marks, 41, joined our company in August 2015 and has been our Executive Vice President, Connectivity since April 2017. Mr. Marks previously served as our Senior Vice President, Operations Solutions from August 2015 through June 2016. From January 2011 to August 2015, Mr. Marks was the Chief Executive Officer and a member of the board of directors of Marks Systems, Inc. (d/b/a masFlight), an aviation big-data analytics company that he co-founded and that we acquired in August 2015. From February 2008 to December 2010, Mr. Marks was the Chief Financial Officer and a member of the board of directors of eJet Aviation Holdings, a provider of VIP aircraft maintenance services, and the Executive Director of the American Aviation Institute, a commercial aviation policy think-tank. From 2003 to 2008, Mr. Marks served as a senior executive of MAXjet Airways, a transatlantic premium airline he co-founded. Earlier in his career, Mr. Marks served as Associate Director of the George Washington University aviation institute and held key roles at two technology companies, Virtualis Systems (acquired by Allegiance Telecom) and VelociGen (acquired by SOA Software). Mr. Marks earned a BA from Harvard College and an MBA from Harvard Business School.
Walé Adepoju, 46, joined our company in July 2014 and has been our Executive Vice President, Media & Content since September 2016. Mr. Adepoju was our Chief Commercial Officer from May 2014 to August 2016. From September 2013 to April 2014, Mr. Adepoju was Chief Operating Officer of Advanced Inflight Alliance AG (“AIA”) (one of our predecessor companies
prior to our business combination with Row 44 and AIA in January 2013) and previously served as AIA’s Chief Strategy Officer from April 2012 to August 2013. From May 2000 to April 2012, Mr. Adepoju served as Managing Director at IMDC Aviation Consulting. Prior to IMDC, Mr. Adepoju served as Director of Strategy at Spafax, which is affiliated with the advertising and public-relations company WPP PLC. Earlier in his career, Mr. Adepoju worked as an air transport analyst providing key investment advice on aerospace companies and products. Mr. Adepoju holds a degree in Manufacturing Engineering and a Masters in Air Transport Management from Cranfield University.
Stephen Ballas, 42, joined our company as General Counsel and Corporate Secretary in April 2016 and has been our Executive Vice President, General Counsel and Corporate Secretary since September 2016. Prior to joining the Company, Mr. Ballas was a Senior Vice President and Deputy General Counsel at CBRE Group, Inc. (NYSE: CBG) from July 2013 to April 2016. From July 2011 to July 2013, Mr. Ballas served as a Senior Counsel at CBRE Global Investors, which is CBRE Group’s real estate investment management arm. He served as a Vice President at GSO Capital Partners, the credit-investment arm of The Blackstone Group, from 2010 to 2011, and as a Senior Counsel at the New York-based hedge fund TPG-Axon Capital from 2007 to 2010. Mr. Ballas was a corporate associate at the law firm of Simpson Thacher & Bartlett LLP from 2002 to 2007. Mr. Ballas holds a BA in Economics from Duke University and a JD from Georgetown Law School.
Board Leadership Structure and Role of the Board Chair
It is our Board’s policy that a non-management independent director serves as the chairman of our Board at all times.
Our Board and our management believe that having a non-management Board Chair reinforces the independence of the board in its oversight of our business and affairs and is more conducive to objective evaluation and oversight of management’s performance, increasing management accountability and improving the ability of the Board to monitor whether management’s actions are in the best interests of our Company and our stockholders.
Currently, Mr. Shapiro serves as our Board Chair. In this capacity, he has the authority, in addition to other powers and responsibilities, to call and preside over Board meetings and to set meeting agendas.
Role of the Board and Its Committees in Risk Oversight
One of our Board’s key functions is informed oversight of our risk management process. The Board currently administers the risk oversight function as a full board as well as through its committees, which address risks inherent in their respective areas of committee oversight. In particular, our Board is responsible for monitoring and assessing strategic risk exposure.
Our Audit Committee has the responsibility to consider and discuss our major financial risk exposures and the steps our management has taken to monitor and control these exposures, including guidelines and policies to govern the process by which risk assessment and management is undertaken. Our Audit Committee also monitors compliance with legal and regulatory requirements.
Our Compensation Committee reviews and discusses the Company’s compensation practices and the relationship among risk, risk management and compensation in light of the Company’s objectives.
Our Corporate Governance and Nominating Committee assists the Board in managing the Company’s overall enterprise risk by periodically assessing and responding as appropriate to risks that may arise in connection with the Company’s governance structures and processes.
Meetings of the Board of Directors
Our Board met 10 times during 2016. During 2016, each Board member attended at least 75% of the aggregate number of meetings held for the Board and for the committees on which he served. Under the Board’s Corporate Governance Guidelines, all Board members are expected to attend our annual stockholders’ meetings. All of our then directors (other than Messrs. Epstein and Sagansky) attended our 2016 annual stockholders’ meeting held in June 2016.
Independent Director Meetings
Our non-management directors generally meet in executive session, i.e., without management present each time that the Board convenes for a regularly scheduled meeting. Our Board Chair generally presides over executive sessions of our Board.
Committees of the Board of Directors
Our Board has an Audit Committee, a Compensation Committee and a Corporate Governance & Nominating Committee. (We refer to this latter committee from time to time as our “Governance Committee.”) The charter for each of our Board committees is posted on our website at www.globaleagle.com under “Investors—Governance.” The following table provides the current membership and the total number of meetings during 2016 for each of these Board committees.
|
| | | | | |
Name | Audit | | Compensation | | Corporate Governance & Nominating |
Edward L. Shapiro | | | | | X |
Jeffrey E. Epstein | | | | | X |
Stephen Hasker | X | | X | | |
Jeffrey A. Leddy | | | | | |
Robert W. Reding | | | X* | | |
Jeff Sagansky | X | | X | | |
Harry E. Sloan | | | | | X* |
Ronald Steger | X* | | | | |
Total meetings in 2016 | 8 | | 4 | | 3 |
* Committee Chair
Audit Committee – The responsibilities of our Audit Committee include:
| |
• | reviewing the Company’s audited annual financial statements and quarterly financial statements with management and our independent registered public accounting firm; |
| |
• | appointing our independent registered public accounting firm, determining the compensation of our independent registered public accounting firm and pre-approving our engagement of the independent registered public accounting firm for audit and non-audit services to be performed by our independent registered public accounting firm and the related fees for those services; |
| |
• | overseeing our independent registered public accounting firm; |
| |
• | meeting with our independent registered public accounting firm to discuss our audit; |
| |
• | reviewing with our independent registered public accounting firm and management the adequacy of our internal controls over financial reporting, and any significant findings and recommendations with respect to those controls; |
| |
• | establishing procedures for the receipt, retention and treatment of complaints regarding internal accounting controls or auditing matters and, if applicable, submissions by employees of concerns regarding questionable accounting or auditing matters; |
| |
• | meeting periodically with management to review and assess our major financial risk exposures and the manner in which such risks are being monitored and controlled; and |
| |
• | reviewing and approving all related party transactions. |
Each member of our Audit Committee is financially literate. Two of our current Audit Committee members (Ronald Steger and Stephen Hasker) also qualify as an “audit committee financial expert” as defined in applicable SEC rules because each of them meets the requirement for past employment experience in finance or accounting, has the requisite professional certification in accounting or has comparable experience.
Compensation Committee – Our Compensation Committee is responsible for overseeing matters relating to the compensation of our Chief Executive Officer and other executive officers and the administration of incentive-based and equity-based compensation plans. The functions of our Compensation Committee include:
| |
• | determining and reviewing, on an annual basis, our compensation philosophy and policies; |
| |
• | determining the compensation of our Chief Executive Officer (who is not present during that determination) and our other executive officers; |
| |
• | determining, or recommending to the Board for determination, the compensation of members of the Board and other committees thereof in connection with Board and committee service; |
| |
• | reviewing and discussing the “Compensation Discussion and Analysis” disclosure with management, recommending to the Board its inclusion in our annual proxy statement and preparing a report for inclusion in such proxy statement that certifies that the committee has discharged this duty; |
| |
• | administering our severance and incentive-based compensation for our executive officers and our equity-based plans established or maintained by us from time-to-time; and |
| |
• | reviewing our compensation practices and the relationship among risk, risk management and compensation in light of our objectives, including the design of compensation practices that would avoid encouraging excessive risk-taking. |
Governance Committee – Our Governance Committee is responsible for overseeing the selection of persons to be nominated to serve on our Board and for assisting the Board in developing and ensuring compliance with our foundational and corporate governance policies and documents. The functions of our Governance Committee include:
| |
• | identifying and recommending to the Board individuals qualified to serve as directors of the Company; |
| |
• | advising our Board with respect to our Board’s composition, procedures and committees, including establishing criteria for annual performance evaluations of our Board committees and our Board; |
| |
• | advising our Board with respect to proposed changes to our certificate of incorporation, bylaws and corporate governance policies; and |
| |
• | advising our Board with respect to director communications with our stockholders. |
Compensation Committee Interlocks and Insider Participation
During 2016, none of the members of our Compensation Committee was an officer or employee of our Company. Jeff Sagansky served as our President from 2011 until 2013, as described above in this Item 10, and is a party to the amended and restated registration rights agreement described under Item 13 of this Form 10-K. Jeffrey A. Leddy, who became our CEO in February 2017, served on our Compensation Committee in 2016 but resigned from that role upon becoming our CEO.
No interlocking relationships exist between our Board or our Compensation Committee and the board of directors or the compensation committee of any other entity. None of our executive officers serves, or in the past year has served, as a member of the board of directors or compensation committee of any entity that has one or more executive officers serving on our Board or our Compensation Committee.
Director Nominations
Our Governance Committee has the responsibility of identifying, assessing and recommending potential director candidates to our Board. Potential candidates are generally interviewed by our Board Chair and the Chair of the Governance Committee prior to their nomination, and may be interviewed by other directors and members of senior management. The Governance Committee then meets to consider and approve the final candidates, and makes its recommendation to the Board for a candidate’s appointment or election to the Board.
Our Governance Committee considers the following criteria when evaluating director candidates: (i) senior-level management and decision-making experience; (ii) a reputation for integrity and abiding by exemplary standards of business and professional conduct; (iii) ability to devote time and attention necessary to fulfill the duties and responsibilities of a director; (iv) a record of accomplishment in his or her respective fields, with leadership experience in a corporation or other complex organization, including government, educational and military institutions; (v) independence and the ability to represent all of our stockholders; (vi)
compliance with legal and Nasdaq listing requirements; (vii) sound business judgment; (viii) reputation for candor and integrity; (ix) judgment, skills, geography and other measures to ensure that the Board as a whole reflects a range of viewpoints, backgrounds, skills, experience and expertise; and (x) the needs of the Board. Although the Governance Committee does not have a formal policy regarding diversity in making its recommendations, the Governance Committee respects that a board of directors should reflect diversity in background, education, business experience, gender, race, ethnicity, culture, skills, business relationships and associations and other factors that will contribute to the highest standards of governance of the Company, and reviews its effectiveness in achieving that diversity when assessing the composition of the Board from time to time.
The Governance Committee also considers candidates proposed by stockholders to be potential director nominees. There were no material changes in 2016 (and there have been no material changes in 2017) to the procedures by which stockholders may recommend nominees to our Board.
Code of Ethics
We have a Code of Ethics that applies to all of our employees, officers and directors, including those officers responsible for financial reporting. Our Code of Ethics is available on our website at www.globaleagle.com under “Investors - Governance.” Our Code of Ethics has been adopted to promote honest and ethical conduct and promote compliance with applicable governmental laws, rules and regulations. If we make any amendments to our Code of Ethics other than technical, administrative or other non-substantive amendments, or grant any waiver, including any implicit waiver, from a provision of the Code of Ethics applicable to our principal executive officer, principal financial officer, principal accounting officer or controller or persons performing similar functions requiring disclosure under applicable SEC or Nasdaq rules, we will disclose the nature of such amendment or waiver on the Investor Relations section of our website.
Section 16(a) Beneficial Ownership Reporting Compliance
Section 16(a) of the Exchange Act requires our directors and executive officers, and beneficial owners of more than ten percent of a registered class of our equity securities, to file with the SEC initial reports of ownership and reports of changes in ownership of our common stock and other equity securities. Officers, directors and greater than ten percent stockholders are required by SEC regulation to furnish us with copies of all Section 16(a) forms that they file.
To our knowledge, based solely on a review of the copies of such reports furnished to us and written representations that no other reports were required during 2016, all Section 16(a) filing requirements applicable to our officers, directors and greater than ten percent beneficial owners were complied with, except for the following:
| |
• | a late Form 3 was filed on March 21, 2016 on behalf of Michael Zemetra, our former Chief Financial Officer and Treasurer, reporting prior grants to him of 54,054 stock options and 18,919 of our restricted stock units on March 10, 2016; |
| |
• | a late Form 4 was filed on March 21, 2016 on behalf of Harry Sloan reporting prior grants to him of 15,444 stock options and 5,405 of our restricted stock units; |
| |
• | a late Form 4 was filed on March 21, 2016 on behalf of Walé Adepoju reporting prior grants to him of 63,012 stock options and 22,054 of our restricted stock units; |
| |
• | a late Form 4 was filed on March 21, 2016 on behalf of David M. Davis, our former Chief Executive Officer, reporting prior grants to him of 169,884 stock options and 59,459 of our restricted stock units; |
| |
• | a late Form 4 was filed on March 21, 2016 on behalf of Stephen Hasker reporting prior grants to him of 15,444 stock options and 5,405 of our restricted stock units; |
| |
• | a late Form 4 was filed on March 21, 2016 on behalf of Edward Shapiro reporting prior grants to him of 15,444 stock options and 5,405 of our restricted stock units; |
| |
• | a late Form 4 was filed on March 21, 2016 on behalf of Jay Itzkowitz, our former General Counsel, reporting prior grants to him of 47,876 stock options and 16,757 of our restricted stock units; |
| |
• | a late Form 4 was filed on March 21, 2016 on behalf of Jeffrey A. Leddy reporting prior grants to him of 15,444 stock options and 5,405 of our restricted stock units; |
| |
• | a late Form 4 was filed on March 21, 2016 on behalf of Robert Reding reporting prior grants to him of 15,444 stock options and 5,405 of our restricted stock units; |
| |
• | a late Form 4 was filed on March 21, 2016 on behalf of Jeffrey Epstein reporting prior grants to him of 15,444 stock options and 5,405 of our restricted stock units; |
| |
• | a late Form 4 was filed on March 21, 2016 on behalf of Jeffrey Sagansky reporting prior sales by him of 2,504 shares, 51 shares and 1,421 shares, and grants to him of 15,444 stock options and 5,405 of our restricted stock units on March 10, 2016; |
| |
• | a late Form 4 was filed on May 13, 2016 on behalf of Walé Adepoju reporting of 2,880 shares withheld for taxes due upon vest for one of his restricted stock unit grants and 1,429 shares withheld for taxes due upon vest for another of his restricted stock unit grants; |
| |
• | a late Form 4 was filed on May 13, 2016 on behalf of David M. Davis reporting 2,555 shares withheld for taxes due upon vest for one of his restricted stock unit grants; |
| |
• | a late Form 4 was filed on May 13, 2016 on behalf of Jay Itzkowitz reporting 524 shares withheld for taxes due upon vest for one of his restricted unit grants and 21,035 shares forfeited by him upon termination of his employment; |
| |
• | a late Form 4 was filed on March 21, 2016 on behalf of Michael Zemetra reporting 1,857 shares withheld for taxes due upon vest for one of his restricted unit grants and 535 shares withheld for taxes due upon vest for another one of his restricted stock unit grants; and |
| |
• | a late Form 4 was filed on May 13, 2016 on behalf of Aditya Chatterjee, our former Chief Technology Officer, reporting 1,227 shares withheld for taxes due upon vest for one of his restricted stock unit grants and 443 shares withheld for taxes due upon vest for another one of his restricted stock unit grants. |
ITEM 11. EXECUTIVE COMPENSATION
Compensation Committee Report
The Compensation Committee has reviewed and discussed with management the following Compensation Discussion and Analysis contained in this Form 10-K. Based on this review and discussion, the Compensation Committee has recommended to the Board that the Compensation Discussion and Analysis be included in this Form 10-K for the year ended December 31, 2016.
Respectfully submitted,
COMPENSATION COMMITTEE
Robert W. Reding, Chair
Stephen Hasker
Jeff Sagansky
The material in this report of the Compensation Committee is not “soliciting material,” is furnished to, but not deemed “filed” with, the SEC and is not deemed to be incorporated by reference in any filing of the Company under the Securities Act or the Exchange Act, whether made before or after the date hereof and irrespective of any general incorporation language in any such filing.
Compensation Discussion and Analysis
For 2016, our “named executive officers” (“NEOs”), as defined under SEC rules, included the following executive officers:
|
| | |
Name | | Title |
David M. Davis | | Former Chief Executive Officer |
Michael Zemetra | | Former Chief Financial Officer and Treasurer |
Thomas Severson | | Former Executive Vice President and Chief Financial Officer |
Abel Avellan | | Former President and Chief Strategy Officer |
Walé Adepoju | | Executive Vice President, Media & Content |
Stephen Ballas | | Executive Vice President, General Counsel and Corporate Secretary |
With respect to the foregoing NEOs:
| |
• | Mr. Davis separated from the Company effective February 20, 2017. Our current CEO Jeffrey Leddy became our CEO effective February 21, 2017 and as such is not a NEO for 2016. |
| |
• | Mr. Zemetra separated from the Company effective August 31, 2016. Thomas Severson became our Executive Vice President and CFO effective August 24, 2016. |
| |
• | Mr. Severson separated from the Company effective February 20, 2017. Our current CFO, Paul Rainey, joined as our Executive Vice President and CFO effective April 3, 2017 and as such is not a NEO for 2016. |
| |
• | Mr. Avellan separated from the Company effective April 18, 2017. |
| |
• | Mr. Ballas joined as our Executive Vice President, General Counsel and Corporate Secretary effective April 11, 2016. |
Business Highlights
We have completed several acquisitions since our business combination with Row 44 and AIA in January 2013, and, as a result, our Company has grown and our executive compensation programs and philosophies have evolved over time. Throughout 2016, we continued to invest significant time and effort growing our businesses, continuing to add to our capabilities (organically and through additional acquisitions), and further defining our business strategy. Key accomplishments in fiscal year 2016 included:
| |
• | We recorded revenue of $530 million, net loss of $113 million and Adjusted EBITDA of $58 million, representing year-over-year increases of 24% for revenue and 15% for Adjusted EBITDA(1). |
| |
• | We began the process to refinance our former credit facilities with a new $500 million senior-secured term loan and a new $85 million senior-secured revolving credit facility, which improved our balance sheet liquidity with a lower effective interest rate, and we closed on these new facilities in January 2017. |
| |
• | We acquired Emerging Markets Communications (“EMC”), a leading provider of connectivity to maritime and hard-to-reach land markets, in July 2016. The combination of our Company with EMC has created one of the largest providers of satellite-based connectivity in the world and enabled us to benefit from significant economies of scale and an enhanced global infrastructure covering the air, land and sea markets. |
| |
(1) | Adjusted EBITDA is a non-GAAP financial measure. See Exhibit 99.1 (“Reconciliation of GAAP Measure to Non-GAAP Measure”) to this Form 10-K for a discussion of how we calculate Adjusted EBITDA and a reconciliation of net loss computed in accordance with GAAP to Adjusted EBITDA. |
Important Compensation Decisions for 2016
We believe that the compensation of our executive officers and employees should be closely tied to the performance of our Company so that their interests are aligned with those of our stockholders.
| |
• | Despite management achieving several strategic accomplishments that position the Company well for the future, our Compensation Committee determined in April 2017 that, based on information available at the time, our expected 2016 financial results fell short of our internal targets for 2016 that we had established in early 2016. As such, our Compensation Committee determined that none of our NEOs for 2016 would receive an Annual Incentive Plan (“AIP”) cash bonus for fiscal year 2016, irrespective of our Company’s actual financial performance relative to those internal targets. |
| |
• | In fiscal year 2016, we introduced performance-based restricted stock units (“PSUs”) as a third grant-type in addition to stock options and time-based restricted stock units (“RSUs”). Our PSUs are awards representing a right to receive a specified number of shares of our common stock after the grant date subject to the achievement of pre-determined performance conditions, as determined by the Compensation Committee. |
Compensation Policies and Practices
|
| | |
Independence | | Our Board has a Compensation Committee that is 100% independent under Nasdaq and SEC rules. The Compensation Committee engages its own independent compensation consultant (currently FW Cook) and confirms each year that the consultant has no conflicts of interest and is independent. |
No Hedging | | We have a policy prohibiting all directors and employees from engaging in any hedging transactions with respect to our securities. This policy prohibits purchases of any financial instrument designed to permit a director, officer or employee to own our securities but without the full risks and rewards of ownership. |
Compensation Clawback Policy | | We have a “compensation clawback policy” that permits the company, subject to the discretion and approval of our Board, to recover cash-based and performance-based-equity incentive compensation paid to any current or former “Section 16 officer” if there is a restatement of our financial results in certain circumstances. |
Director Stock Ownership Guidelines | | We have Stock Ownership Guidelines for Outside Directors that require our outside directors to retain shares valued at three times their annual cash retainer for director service until they meet the required stock ownership threshold. |
CEO Stock Ownership Guidelines | | We have Stock Ownership Guidelines for our Chief Executive Officer that require our CEO to retain shares valued at three times his or her annual base salary until our CEO meets the required stock ownership threshold. |
Equity Award Policy | | We have an Equity Award Policy that is designed to maintain the integrity of our equity award process, including for the timing and value of awards. The Equity Award Policy sets the general timing of our annual equity grants and imposes stringent controls around those grants and around any award made outside of the normal annual equity grant cycle. |
No “Single Trigger” Change in Control Payments | | None of our currently employed NEOs has “single trigger” change in control payments or benefits (including automatic accelerated vesting of equity awards upon a change in control only). |
No Tax Gross-Ups | | We do not provide tax gross-ups to any of our NEOs. |
Executive Compensation Philosophy and Objectives
We operate in highly competitive industries providing content and connectivity to the worldwide aviation, maritime and hard-to-reach land markets, which are characterized by frequent technological advances, rapidly changing market requirements, and the regular emergence of new market entrants. To succeed in this environment, we must continuously develop and refine new and existing products and services, devise new business models, and demonstrate an ability to quickly identify and capitalize on new business opportunities. To achieve these objectives, we need a highly-talented and seasoned team of business professionals. We believe that the compensation of our executive officers should be closely tied to the long-term performance and growth of our Company so that their interests are aligned with those of our stockholders. Consistent with this philosophy, the following core principles provide a framework for the Company’s executive compensation philosophy:
| |
• | to provide a competitive compensation package to attract and retain talented executives to manage and operate all aspects of our business; |
| |
• | to reward the achievement of corporate and individual objectives that promote the growth and profitability of our business; and |
| |
• | to align the interests of our executive officers with those of our stockholders by providing both short-time incentive compensation (our AIP cash bonus program) and long-term incentive compensation (our equity program). |
We strive to balance incentives that promote long-term, sustainable performance and to discourage inappropriate risk-taking. We believe that our metrics and targets for earning performance-based incentives, such as the revenue and Adjusted EBITDA targets for our AIP program in 2016, are consistent with our business objectives and our goal of increasing stockholder value over the long-term.
Roles of Our Board of Directors, Compensation Committee and Chief Executive Officer in Compensation Decisions
Our Compensation Committee is responsible for reviewing and approving compensation for all of our executive officers. This includes approving the goals and payouts under our AIP cash bonus program, target compensation opportunities and actual incentive-compensation payouts for the executive officers, all long-term incentive grant levels and terms as well as the design of compensation programs in which the executive officers participate. Our CEO recommends to the Compensation Committee the compensation packages for all of our executive officers (other than for the CEO), including base salary increases, AIP bonuses and equity and any other incentive awards.
In carrying out its responsibilities, the Compensation Committee considers a number of factors, including the following:
| |
• | our financial condition and available resources; |
| |
• | an evaluation of the competitive market based on available data as well as the collective experience of the members of the Compensation Committee with other similar companies, as well as recommendations of the Committee’s independent compensation consultant, FW Cook; |
| |
• | the individual executive officer’s experience and expertise; and |
| |
• | the compensation levels of our other executive officers at that time. |
Compensation Committee’s Independent Compensation Consultant
Our Compensation Committee has (since Fall 2016) retained FW Cook, as its independent compensation consultant. FW Cook reports directly to our Compensation Committee, attends committee meetings and provides advice to the Committee Chair and the Committee. FW Cook prepares analyses for the Committee based on its review of market data that it believes to be relevant, including compensation levels at, and the financial performance of, a comparator group of companies identified for the relevant compensation period. FW Cook meets with the Committee and with management to solicit input on job scope, performance, retention issues and other factors that it views as relevant. FW Cook assists in the development of recommendations on compensation program design and pay opportunities for executive officers.
FW Cook has not provided any services for us other than the services that it provided to our Compensation Committee. Our Compensation Committee assessed the independence of FW Cook pursuant to, and based on the factors set forth in, SEC and Nasdaq rules, and determined no conflicts of interest exist in respect of its engagement of FW Cook.
Compensation Benchmarking
In the second quarter of 2016, we reviewed and benchmarked our compensation practices that support our ability to retain and motivate our existing leadership talent and attract new leadership talent to our Company. This effort included a review of the competitiveness of our executive compensation practices in the global markets in which we compete for talent; the historical practices of the companies that we have acquired over the past several years; a review of the consistency of pay across our company; and an assessment of how our compensation programs support our short- and long-term business objectives.
For purposes of determining our compensation for our executive officers for 2016 (which compensation was initially established in Spring 2016), our comparator group included the following companies in our industries:
|
| | |
Broadsoft, Inc. | | Comserve, Inc. |
Conversant, LLC | | Dolby Laboratories, Inc. |
DTS, Inc. | | Gogo Inc. |
Harmonic, Inc. | | Iridium Communications Inc. |
LogMeIn, Inc. | | RealD Inc. |
RLJ Entertainment, Inc. | | TiVo Corporation |
Synchronoss Technologies, Inc. | | |
Our CEO utilized this comparator group in preparing his 2016 compensation proposals to the Compensation Committee in Spring 2016. Our Compensation Committee then considered this benchmarking information in reaching its determinations regarding the compensation of our executive officers for 2016.
In Fall 2016, following our EMC Acquisition and the substantial change in our company’s size, scope and complexity due to that acquisition, FW Cook reviewed the prior comparator group and recommended changes to that group. Based on this review, our Compensation Committee determined that our new comparator group would be as set forth in the table below:
|
| | |
Avid Technologies, Inc. | | Ixia |
Calix Inc. | | Netgear Inc. |
CSG Systems, Inc. | | ShoreTel, Inc. |
Gogo Inc. | | Silver Spring Networks, Inc. |
GTT Communications, Inc. | | Synchronoss Technologies, Inc. TiVo Corporation |
Harmonic, Inc. | | TiVo Corporation |
IMAX Corporation | | ViaSat Inc. |
Infinera Corporation | | Vonage Holdings Corp. |
Iridium Communications Inc. | | |
FW Cook then provided a competitive analysis of target pay opportunities and incentive program design practices among the new comparator companies.
Our Compensation Committee considered this new benchmarking information in reaching its determinations regarding the changes to compensation for our former Chief Executive Officer in October 2016 and the introduction of PSUs into our annual equity grant program in October 2016. Our Compensation Committee also used this new comparator group as one of many points of reference in determining 2017 compensation opportunities for our executive officers.
Say-on-Pay Vote Result
At our 2016 annual meeting of stockholders, over 95% of the votes cast on our “say-on-pay” proposal were voted in favor of our compensation paid to our named executive officers for 2015. Our Board and our Compensation Committee reviewed these vote results when evaluating our executive compensation policies and decisions during 2016, and the Compensation Committee will continue to consider the results of our “say-on-pay” votes when making future compensation decisions for our executive officers.
Elements of Executive Compensation
We believe the compensation packages of our NEOs for 2016 were consistent with our compensation objectives, as outlined in the following table. This table sets forth the key elements of the 2016 compensation provided to our NEOs for 2016, along with the primary objective associated with each element of compensation.
|
| | | | |
Compensation Element | | Type | | Primary Objective |
Base salary | | Fixed annual cash payment | | Attract and retain high-performing and experienced leaders at a competitive level of salary. |
Annual performance-based cash compensation (short-term “at-risk” cash incentive compensation) under our Annual Cash Incentive (AIP) Program | | Variable annual cash bonus | | Motivate and reward executives for achieving annual “Pre-Bonus Adjusted EBITDA” (described below) and/or revenue goals and the achievement of strategic goals at the Company, department and individual level |
Long-term “at-risk” equity incentive compensation | | Equity with multi-year vesting | | Align the interests of our NEOs with stockholder interests, encourage the maximization of stockholder value and retain key executives over the long term. |
Compensation Mix
For 2016, our Compensation Committee reviewed the comparator-group data described above and approved target levels and a mix of fixed and variable compensation for our executive officers. To tie our executive compensation programs to our performance, we weighted the targeted 2016 total compensation package more towards variable AIP and long-term equity incentives than towards fixed (i.e., base salary) compensation. The charts below show the target mix of each element of the total compensation package for (1) our former Chief Executive Officer for 2016 and (2) our former Chief Executive Officer together with the rest of our NEOs for 2016(1):
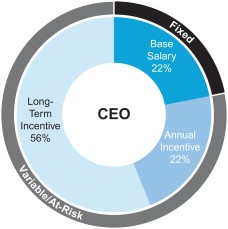
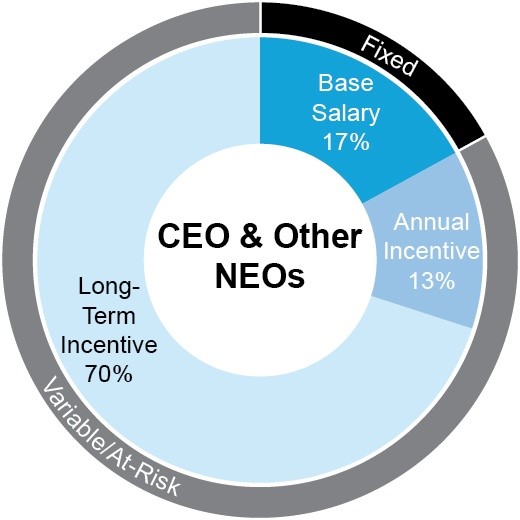
| |
(1) | For 2016, Messrs. Avellan and Severson—who were new hires for us in 2016 as part of the EMC Acquisition—received large, up front (“front loader”) long-term equity incentive grants upon their commencement of employment with us. This included an initial award of stock options and RSUs with the expectation that they would not receive any additional equity grants for the next several years. These charts reflect these “front loader” grants. |
2016 Compensation Decisions
Base Salary
Base salaries for our executive officers are generally based on the scope of their responsibilities, historical job performance and individual experience. We also aim to set base salaries at levels generally comparable with those of executives in similar positions and with similar responsibilities at comparable companies as necessary to attract, retain and motivate those executive officers. Base salaries for our executive officers are reviewed at least annually, and may be further adjusted from time to time by the Compensation Committee.
The table below shows the 2016 base salary (as of December 31, 2016) for each of our NEOs for 2016:
|
| | | | |
Name | | Base Salary at Dec. 31, 2016 ($) | | Changes to Base Salary (if any) during 2016 |
David M. Davis | | 625,000 | | Increased from $550,000 effective October 1, 2016. |
Michael Zemetra | | 350,000 | | None. |
Thomas Severson | | 350,000 | | Mr. Severson commenced employment with our company in July 2016 upon our acquisition of EMC and became our CFO on August 24, 2016. He did not receive any salary adjustment during the remainder of 2016. |
Abel Avellan | | 350,000 | | Mr. Avellan commenced employment with our company in July 2016 upon our acquisition of EMC and did not receive any salary adjustment during the remainder of 2016. |
Walé Adepoju | | 418,055 | | Increased from $408,000 effective April 1, 2016. |
Stephen Ballas | | 335,000 | | Mr. Ballas commenced employment with our company on April 11, 2016 and did not receive any salary adjustment during the remainder of 2016. |
Annual Cash Incentive (“AIP”) Compensation
The annual incentive payouts for our NEOs for 2016 were determined as follows: (1) 40% on achievement against a “Pre-Bonus Adjusted EBITDA” target (i.e., the Company’s Adjusted EBITDA adding back any AIP bonus payments for that period) set in Spring 2016, but excluding EBITDA from acquisitions consummated in 2016, i.e., the EMC Acquisition, (2) 30% on achievement against a consolidated revenue target set in Spring 2016 (excluding revenue from acquisitions consummated in 2016, i.e., the EMC Acquisition), and (3) 30% on achievement (based on a performance rating scaled from “1” to “5,” with a rating of “4” constituting target level of performance) against Company and individual objectives identified for each NEO set in Spring 2016. In order for the Company to make any payouts under the AIP for 2016, the Company’s actual Pre-Bonus Adjusted EBITDA must have exceeded 80% of the target Pre-Bonus Adjusted EBITDA goal. Our executive officers had the opportunity to earn from 0% to 150% of their target AIP amounts based on actual achievement against the performance targets established for each of the three metrics.
The following table sets forth the full-year AIP bonus target (as a percentage of base salary and in dollar amount) for each of our NEOs for 2016 (and assumes no proration for employment start dates that occurred during 2016):
|
| | | | |
Name | | 2016 AIP Bonus Target (% of Salary) | | 2016 AIP Bonus Target ($) |
David M. Davis | | 100% | | 625,000 |
Michael Zemetra | | 75% | | 262,500 |
Thomas Severson | | 75% | | 262,500 |
Abel Avellan | | 75% | | 262,500 |
Walé Adepoju | | 75% | | 313,541 |
Stephen Ballas | | 50% | | 167,500 |
The following table sets forth the performance metrics (at target) under the AIP for 2016 and the relative weighting of those metrics in determining AIP bonuses for 2016:
|
| | | | |
Performance Metric | | Weighting | | Target (millions) ($) |
Pre-Bonus Adjusted EBITDA | | 40% | | 66.5 |
Consolidated Revenue | | 30% | | 478.0 |
Company and Individual Strategic Goals | | 30% | | Described below for each NEO |
The following table sets forth the strategic/individual goals for each of our NEOs for 2016:
|
| | |
Name | | Strategic/Individual Goals |
David M. Davis | | • Onboard new clients, including major new connectivity customers • Continue global integration and organizational alignment • Pursue targeted M&A opportunities • Hire and develop internal key talent • Continue to enhance company-wide communication |
Michael Zemetra | | • Hire and develop key talent • Improve internal financial information delivery processes • Achieve cost reductions • Implementation and continued development of finance-system applications |
Thomas Severson | | • Hire and develop internal key talent • Achieve cost reductions • Complete Finance department reorganization and development |
Abel Avellan | | • Execute on Maritime & Land Connectivity roadmap • Meaningful progress on the integration of the EMC business into Global Eagle • Implement a company-wide synergy program following the EMC acquisition |
Walé Adepoju | | • Retain key Media & Content customers and achieve new Media & Content customer wins • Improve overall Media & Content customer satisfaction • Streamline content purchasing processes and delivery • Grow content distribution business • Diversify lab services offerings |
Stephen Ballas | | • Strengthen corporate governance framework and policies • Develop Legal and Compliance Department organization structure and processes • Development and execution of Compliance program |
In April 2017, the Compensation Committee evaluated our Company’s and executive officers’ 2016 actual performance achievement as measured against the goals initially established for each of them. The Committee then considered the appropriate “actual” payout for our executive officers under the AIP for 2016. The goals, actual performance achievement and payouts for 2016 AIP compensation are shown in the table below. However, after considering our Company’s expected performance results for 2016 based on information available at the time, the Compensation Committee determined that our performance fell below expectations and, accordingly, that our NEOs for 2016 would not receive any AIP payout for the 2016 performance year.
|
| | | | | | | | | | |
Performance Metric | | Weighting | | Goal at Target (millions) ($) | | Actual Performance (millions) ($) | | Actual Payout as a % of Goal | | Actual Payout as a % of Target |
Pre-Bonus Adjusted EBITDA | | 40% | | 66.5 | | Not calculated (1) | | —% (1) | | —% (1) |
Consolidated Revenue | | 30% | | 478.0 | | Not calculated (1) | | —% (1) | | —% (1) |
Company and Individual Strategic Goals | | 30% | | Described Above | | Not calculated (1) | | (1) | | (1) |
Minimum Funding Threshold for AIP | | $53.2 million (i.e., 80% of Pre-Bonus Adjusted EBITDA Target of $66.5 million) | | | | | | | | |
| |
(1) | Our Compensation Committee determined that none of our 2016 NEOs would receive an AIP cash bonus for fiscal year 2016, irrespective of our Company’s actual financial performance and the NEO’s performance against his Company and individual strategic goals. |
Long-Term Incentive Compensation (Equity-Based)
We currently utilize stock options, RSUs and PSUs to reward long-term performance. We believe that providing a meaningful portion of an executive’s total compensation package in the form of equity awards vesting over multi-year periods aligns the long-term incentives of our executive officers with the interests of our stockholders. Our equity award program takes into consideration our pool of shares available for grant under our equity plans, the rate at which we deplete our pool of shares available for grant, our annual equity usage rates and corresponding levels of dilution to our stockholders resulting from such awards.
Time-Vesting Stock Options and Restricted Stock Units
In March 2016, the Compensation Committee approved long-term incentive grants for our NEOs for 2016 under our equity grant program that included a mix of “time-vesting” non-qualified stock options and RSUs. With respect to our “time-vesting” non-qualified stock options, 25% of the shares underlying such options generally vest on the first anniversary of the “vesting commencement date” (which is generally the date of grant) and the balance generally vests in equal monthly installments over the following 36 months (subject to continuous service on each vesting date). Our “time-vesting” RSUs generally vest in four equal annual installments with the first installment vesting on the first anniversary of the vesting commencement date and the remaining installments vesting annually thereafter (subject to continuous service on each vesting date).
Prior to June 2016, the Company’s practice was generally to grant a large, one-time “front loader” award of stock options and RSUs upon hiring a new executive officer, with the expectation that no additional grants would be made for the next several years. However, in June 2016, the Compensation Committee transitioned to an annual grant program for all employees (including for recent hires) to align the executive team, mitigate variability across executive officers in equity grant prices (including across exercise prices on options) and provide stronger continuous executive retention.
Total Shareholder Return Performance-Based Restricted Stock Units
In October 2016, the Compensation Committee approved the terms of a new relative Total Shareholder Return (“TSR”) PSU for issuance under the Company’s existing Amended and Restated 2013 Equity Incentive Plan (the “2013 Equity Plan”). The Compensation Committee implemented the new PSU program to incorporate into our ongoing long-term incentive program a long-term “performance-based” incentive instrument with vesting tied to our multi-year stock-price performance. The PSUs vest based on the Company’s TSR relative to the TSR of the constituents of the Russell 2000 Index over a three-year performance period commencing on the grant date. Vesting is further subject to the recipient’s continuous employment through the third anniversary of the grant date. The Company granted the PSUs as a “target” number of PSUs, with the actual number of PSUs later vesting to be based on the Company’s relative TSR percentile ranking versus the constituents of the Russell 2000 as measured at the end of the performance period, as follows:
|
| | |
TSR Percentile Ranking | | Share Payout as a % of Target PSUs* |
80th Percentile or Greater | | 150% (Maximum) |
60th Percentile | | 100% (Target) |
30th Percentile or Less | | 0% |
*Payout percentage linearly interpolated for performance between the 30th and 60th percentiles and between the 60th and 80th percentiles.
The table below shows the value of RSUs, stock options and PSUs awarded to our NEOs for 2016:
|
| | | | | | | | | | | | |
Name | | Restricted Stock Units ($) | | Stock Options ($) | | PSU (at Target) ($) | | 2016 Aggregate Long-Term Incentive Total ($) |
David M. Davis | | 550,000 |
| | 550,000 |
| | 462,500 |
| | 1,562,500 |
|
Michael Zemetra | | 175,000 |
| | 175,000 |
| | None |
| | 350,000 |
|
Thomas Severson | | 672,800 |
| | 648,000 |
| | None |
| | 1,320,800 |
|
Abel Avellan (1) | | 3,613,500 |
| | 1,395,000 |
| | None |
| | 5,008,500 |
|
Walé Adepoju | | 204,000 |
| | 517,000 (2) |
| | 167,500 |
| | 888,500 |
|
Stephen Ballas | | 406,250 |
| | 406,250 |
| | 134,000 |
| | 946,500 |
|
| |
* | Dollar amounts in table above reflect grant-date fair value, except for the PSUs which reflect grant date value as determined by the Compensation Committee. |
| |
(1) | Mr. Avellan’s equity was granted pursuant to the Company’s 2016 Inducement and Retention Stock Plan for EMC Employees (the “EMC Inducement Equity Plan”) that the Board established in connection with the EMC Acquisition. The purpose of the EMC Inducement Equity Plan was to provide equity awards as an inducement to legacy EMC employees to enter into employment or continue their employment with the Company upon our consummation of the EMC Acquisition and to promote the success and enhance the value of the Company by linking the personal interests of those recipients to those of the Company’s stockholders. |
| |
(2) | Mr. Adepoju received two grants of stock options (to purchase our common stock) in 2016 (totaling $517,000 in aggregate grant-date fair value), consisting of (1) a grant in March 2016 with a grant date fair value equal to $204,000 and (2) a grant in October 2016 with a grant date fair value equal to $313,000. |
As described above, the Company’s practice prior to June 2016 was to grant a large, one-time “front loader” award of stock options and RSUs upon hiring a new executive, with the expectation that no additional grants would be made for the next several years. Messrs. Severson and Avellan received their “front loader” equity awards on their employment commencement dates with the Company following the EMC Acquisition, and therefore did not receive any PSUs when granted in October 2016. Mr. Zemetra’s employment with the Company had already terminated at the time the Compensation Committee determined to grant PSUs in October 2016, and therefore he did not receive any PSUs.
2017 Events and Compensation Decisions Regarding 2016 NEOs
David M. Davis
On February 17, 2017, Mr. Davis’s employment as the Company’s Chief Executive Officer and service as a member of the Company’s Board terminated.
Because we treated the separation as an involuntary termination without cause, Mr. Davis received a severance payment in the form of a one-time cash payment equal to $1,094,000 (175% of his then-current annual base salary). This amount equaled his contractual severance entitlement under his employment agreement. Given that we had completed the 2016 performance year but not yet paid or determined 2016 AIP cash bonuses at the time of Mr. Davis’s separation, the Committee determined it was appropriate to provide him his 2016 AIP bonus if and when paid for the 2016 performance year and as calculated under the AIP. As described above however, our Compensation Committee subsequently determined in April 2017 not to award any of our executive officers AIP cash bonuses for the 2016 performance year, and so Mr. Davis ultimately did not receive any 2016 AIP bonus. The Committee also agreed to reimburse Mr. Davis for up to $10,000 for his outside legal expenses incurred in negotiating his separation agreements with the Company.
On February 20, 2017, we also entered into a consulting agreement with Mr. Davis pursuant to which Mr. Davis agreed to provide consulting and advisory services to the Company for three months following his separation date. Further, that agreement provided that any equity held by Mr. Davis would continue to vest until the termination date of the consulting period. Mr. Davis ceased providing consulting services to us in May 2017.
The Company also agreed to provide Mr. Davis up to one year following the end of that consulting period to exercise any stock options vested through the completion of such consulting period.
Tom Severson
On February 20, 2017, Mr. Severson’s employment as the Company’s Chief Financial Officer terminated. Because we treated the separation as an involuntary termination without cause, Mr. Severson received severance in the form of continued payments of his salary for 12 months following his separation on regular paycheck dates. This amount equaled his contractual severance entitlement under his employment agreement, without further enhancement. Also, as required by his employment agreement, we agreed to provide him his 2016 AIP bonus if and when paid for the 2016 performance year and as calculated under the AIP. As described above, however, our Compensation Committee subsequently determined in April 2017 not to award any of our executive officers AIP bonuses for the 2016 performance year, and so Mr. Severson ultimately did not receive any 2016 AIP bonus.
All of Mr. Severson’s unvested options and restricted stock units were immediately forfeited upon his separation from the Company.
Wale Adepoju
In connection with the Company’s annual merit increase assessment process for all employees, on April 28, 2017, the Compensation Committee approved an increase to Mr. Adepoju’s salary to $428,506 (from $418,055), effective April 1, 2017. On that same date, the Compensation Committee granted Mr. Adepoju a one-time cash retention bonus of $185,000, to be paid in three equal installments on June 30, 2017, September 30, 2017 and December 30, 2017.
As noted above, also in April 2017, our Compensation Committee determined not to award any of our executive officers AIP cash bonuses for the 2016 performance year, and so Mr. Adepoju did not receive any 2016 AIP bonus.
Stephen Ballas
On April 28, 2017, the Compensation Committee approved an increase to Mr. Ballas’s salary to $350,000 (from $335,000) effective April 1, 2017, and approved an increase to Mr. Ballas’s AIP cash bonus target to 75% (from 50%) of his base salary for the 2017 (and future) performance years. On that same date, the Compensation Committee granted Mr. Ballas a one-time cash retention bonus of $115,000, to be paid in three equal installments on June 30, 2017, September 30, 2017 and December 30, 2017.
As noted above, also in April 2017, our Compensation Committee determined not to award any of our executive officers AIP cash bonuses for the 2016 performance year, and so Mr. Ballas did not receive any 2016 AIP bonus.
Michael Zemetra
On August 22, 2016, Michael Zemetra submitted his notice of resignation as our Chief Financial Officer and Treasurer, with the resignation to be effective on August 31, 2017. In connection therewith, the Company and Mr. Zemetra entered into a Release and Transition Services Agreement dated August 25, 2016, pursuant to which the Company agreed to pay Mr. Zemetra a lump-sum cash payment of $388,522, consisting of (a) a discretionary bonus of $358,636 and (b) a transition services fee of $29,886 for his provision of consulting services to the Company through September 30, 2016. In addition, the Company granted Mr. Zemetra until August 31, 2017 the opportunity to exercise any vested Company stock options that he held as of August 31, 2016.
Abel Avellan
On April 18, 2017, Abel Avellan submitted his notice of resignation as our President and Chief Strategy Officer, effective on the date of that notice. In connection with Mr. Avellan’s resignation, the Company and Mr. Avellan entered into a Consulting Agreement dated April 19, 2017 (the “Consulting Agreement”). Under the Consulting Agreement, the Company agreed to pay Mr. Avellan a fee of $15,000 per month for his consulting services to the Company, with Mr. Avellan dedicating 50% of his working hours to providing these services. The consulting term commenced on April 19, 2017 and terminated in November 2017. Vesting on Mr. Avellan’s unvested equity of the Company that he held on his employment resignation date continued for the duration of the period in which he provided consulting services, as if Mr. Avellan remained an employee of the Company during that period.
As noted above, in April 2017, our Compensation Committee determined not to award any of our executive officers AIP cash bonuses for the 2016 performance year, and so Mr. Avellan did not receive any 2016 AIP bonus.
Additional Elements of Our Compensation Program
| |
• | No “Single Trigger” Change in Control Payments – We do not have any agreements or plans with our currently employed executive officers that provide for “single trigger” change in control payments or benefits (i.e., automatic accelerated vesting of equity awards upon a change of control only). In the event of a change of control of the Company prior to July 27, 2017, Mr. Avellan—our former President & Chief Strategy Officer—would have received automatic accelerated vesting of his equity awards upon a termination without cause or for good reason pursuant to this employment agreement, which he negotiated for as part of the Company’s acquisition of EMC. But Mr. Avellan separated from our company on April 18, 2017, so this provision is no longer applicable. |
| |
• | Executive Severance Plan – In April 2017, the Compensation Committee approved a new Change in Control and Severance Plan for Senior Management (our “Executive Severance Plan”), in which all of our executive officers (including all currently employed 2016 NEOs) now participate. The Compensation Committee adopted the Executive Severance Plan because it believes that the Executive Severance Plan is reflective of current compensation practices and trends and will help ensure retention and continuity of our executive officers. The Compensation Committee further believes that the Executive Severance Plan is essential to recruiting, retaining and developing high-quality executive talent in a competitive job market because it provides protection to the executive officer if the Company does not retain him or her in certain circumstances. Participants |
under the Executive Severance Plan are eligible to receive (i) severance benefits upon a qualifying termination of employment, including enhanced benefits for a qualifying termination that occurs within a window period surrounding a change in control of the Company, and (ii) accelerated and continued vesting in respect of equity awards held by them if they are terminated without cause. For a description of the Executive Severance Plan, please see our Current Report on Form 8-K that we filed with the Securities and Exchange Commission on April 7, 2017. Because the Executive Severance Plan was not in effect in 2016, we have not described it herein. We will provide a complete description of the Executive Severance Plan in our proxy statement for our 2018 annual stockholders’ meeting, which proxy statement will address compensation for our named executive officers for 2017.
| |
• | CEO Stock Ownership Guidelines – We have Stock Ownership Guidelines for our Chief Executive Officer that require that our CEO retain shares valued at three times his annual base salary. If the threshold is not met, then our CEO may not sell any of his or her “net” shares (i.e., after permitted sales for tax withholdings) acquired upon the exercise of stock options or the settlement of vested RSUs. |
| |
• | No Tax Gross-Ups – We do not provide tax gross-ups to our executive officers. |
| |
• | No Hedging Transactions – We have a policy prohibiting all of our directors, officers and employees from engaging in hedging or monetization transactions that would permit the director, officer or employee to own Company securities but without the full risks and rewards of ownership. We adopted this policy because we believe that all of our directors, officers and employees should be aligned with our stockholders’ long-term interests, and we believe these sorts of hedging transactions would misalign their incentives in that regard. |
| |
• | Compensation Clawback Policy – We have a “compensation clawback policy” that permits us, subject to the discretion and approval of the Board, to recover cash-based and performance-based-equity incentive compensation (e.g., our AIP cash bonus awards) paid to any current or former “Section 16 officer” (as so designated by the Board or its Compensation Committee under Rule 16a-1(f) of the Exchange Act) in the event of a restatement of our financial results in certain circumstances. Specifically, the policy provides that (i) if we are required to restate our financial statements due to material non-compliance by us with any financial reporting requirement under securities laws, (ii) fraud or willful misconduct contributed to the restatement and (iii) any executive officer received a recoverable incentive-based compensation award in excess of the amount that he or she would have received had the restated financial statements been in effect for the period in which the incentive-based compensation amount was awarded, then we are entitled to recover the overpayment. The policy permits clawback from any executive who received an award overpayment, irrespective of whether the executive contributed to the fraud or willful misconduct. Awards are subject to clawback under the policy for up to three years after the award vests or is granted. |
| |
• | Deductibility of Executive Compensation; Internal Revenue Code Section 162(m) – Section 162(m) of the Internal Revenue Code limits the amount that a public company may deduct from federal income taxes for remuneration paid to the chief executive officer and the three other most highly paid executive officers (other than the chief financial officer) to $1.0 million per executive per year, unless certain requirements are met. While the Compensation Committee is mindful of the benefit to us of the full deductibility of compensation, the Compensation Committee believes that it should not be constrained by the requirements of Section 162(m) where those requirements would impair flexibility in compensating our executive officers in a manner that can best promote our corporate objectives. We intend to continue to compensate our executive officers in a manner consistent with the best interests of the Company and our stockholders. We expect our new 2017 Omnibus Long Term Incentive Plan that we will propose at our next annual stockholders’ meeting to potentially qualify our future AIP cash awards and time-vesting RSUs for the exception to the compensation deductibility limits of Section 162(m). |
Summary Compensation Table for 2016
The following table shows the compensation earned in respect of 2016, 2015, and 2014 by each of our 2016 NEOs for the years in which they were NEOs (as determined pursuant to the SEC’s disclosure requirements for executive compensation in Item 402 of Regulation S-K).
|
| | | | | | | | | | | | | | | | | | | | | | | |
Name and Current Principal Position (unless otherwise indicated) | | Year | | Salary (1) ($) | | Bonus ($) | | Stock Awards (2) ($) | | Option Awards (3) ($) | | Non-Equity Incentive Plan Compensation (4) ($) | | All Other Compensation (5) ($) | | Total ($) |
David M. Davis (6) Former Chief Executive Officer | | 2016 | | 562,625 |
| | — |
| | 1,058,192 |
| | 562,316 |
| | — |
| | 54,300 |
| | 2,237,433 |
|
| 2015 | | 537,671 |
| | — |
| | 399,997 |
| | 386,790 |
| | 516,313 |
| | — |
| | 1,840,771 |
|
| 2014 | | 427,869 |
| | — |
| | — |
| | 673,000 |
| | — |
| | — |
| | 1,100,869 |
|
Michael Zemetra (7) Former Chief Financial Officer and Treasurer | | 2016 | | 266,814 |
| | — |
| | 175,001 |
| | 178,919 |
| | — |
| | 362,296 |
| | 983,030 |
|
| 2015 | | 350,000 |
| | — |
| | 75,008 |
| | 72,522 |
| | 240,516 |
| | — |
| | 738,046 |
|
| 2014 | | 261,818 |
| | 75,000 |
| | 63,752 |
| | 365,250 |
| | — |
| | — |
| | 765,820 |
|
Thomas Severson (8) Former Executive Vice President, Chief Financial Officer | | 2016 | | 116,667 |
| | — |
| | 672,800 |
| | 648,000 |
| | — |
| | 46,400 |
| | 1,483,867 |
|
Abel Avellan (9) Former President and Chief Strategy Officer | | 2016 | | 135,417 |
| | — |
| | 3,613,500 |
| | 1,395,000 |
| | — |
| | 13,000 |
| | 5,150,667 |
|
Walé Adepoju Executive Vice President, Media & Content | | 2016 | | 415,542 |
| | — |
| | 387,496 |
| | 521,146 |
| | — |
| | — |
| | 1,324,184 |
|
| 2015 | | 406,027 |
| | — |
| | 199,998 |
| | 193,395 |
| | 280,373 |
| | — |
| | 1,079,793 |
|
Stephen Ballas (10) Executive Vice President, General Counsel, and Corporate Secretary | | 2016 | | 243,734 |
| | 50,000(11) |
| | 553,487 |
| | 407,605 |
| | — |
| | — |
| | 1,253,916 |
|
| |
* | The amounts in this table do not reflect any compensation that the NEO received at any predecessor company prior to the Company’s acquisition of that company. |
| |
(1) | Amounts set forth in this column reflect the amounts actually received by the NEO as salary payments during 2016, and therefore represent a blend of the salary rates applicable to the NEO throughout the year in the event that the NEO experienced a salary change mid-year. |
| |
(2) | Amounts set forth in this column represent the grant date fair value of stock-based awards granted during the year computed in accordance with Accounting Standards Codification Topic No. 718, “Compensation — Stock Compensation” (“ASC 718”). For 2016, the aggregate grant date fair value of the stock awards reflected in these columns was determined using the valuation methodology and assumptions set forth in Note 13 Common Stock, Stock-Based Awards and Warrants to our consolidated financial statements included in this Form 10-K. |
| |
(3) | Amounts set forth in this column represent the grant date fair value of stock-based awards granted during the year computed in accordance with ASC 718. For 2016, the aggregate grant date fair value of the stock option awards reflected in these columns was determined using the valuation methodology and assumptions set forth in Note 13 Common Stock, Stock-Based Awards and Warrants to our consolidated financial statements included in this Form 10-K. |
| |
(4) | Amounts disclosed under the “Non-Equity Incentive Plan Compensation” column reflect the amounts earned by the NEO during the applicable year under the AIP. |
| |
(5) | Amounts disclosed under “All Other Compensation” includes (1) for Mr. Davis, approximately $50,000 for commuting benefits for his travel to and from his principal residence in Minnesota and our Company’s headquarters in Los Angeles, California, and $4,300 for 401(k) employer matching contributions; (2) for Mr. Zemetra, $358,636 of income from severance and $3,660 for 401(k) employer matching contributions; (3) for Mr. Severson, $41,900 for housing cost benefits associated with his temporary relocation to Los Angeles during our CFO transition in late 2016, and $4,500 for 401(k) employer matching contributions; and (4) for Mr. Avellan, approximately $13,000 for commuting benefits for his travel to and from his principal residence in Florida and our Florida office. Perquisites whose aggregate value is less than $10,000 are not disclosed separately, as permitted under SEC rules. Messrs. Avellan and Adepoju had de minimis 401(k) contributions (each less than $500) for the 2016 performance year. |
| |
(6) | Mr. Davis separated from the Company effective February 22, 2017. |
| |
(7) | Mr. Zemetra separated from the Company effective August 31, 2016. |
| |
(8) | Mr. Severson became the Company’s Chief Financial Officer effective August 31, 2016. Mr. Severson separated from the Company on February 20, 2017. |
| |
(9) | Mr. Avellan became our President and Chief Financial Officer effective July 27, 2016. He separated from the Company effective April 18, 2017. |
| |
(10) | Mr. Ballas joined the Company as its Executive Vice President, General Counsel and Corporate Secretary effective April 11, 2016. |
| |
(11) | Mr. Ballas received a $50,000 sign-on bonus when he joined the Company. This amount reflects that bonus. |
Grants of Plan-Based Awards for 2016
The following table sets forth information relating to grants in 2016 of plan-based awards to our 2016 NEOs.
|
| | | | | | | | | | | | | | | | | | | | | | | | | | | | | | | | |
| | | | Estimated Future Payouts Under Non-Equity Incentive Plan Awards (1) | | Estimated Future Number of Shares Under Equity Incentive Plan Awards(2) | | RSUs: Number of Shares of Stock or Units (#)(3) | | Stock Option Awards: Number of Securities Underlying Options (#)(4) | | Exercise or Base Price of Option Awards ($/sh) | | Grant Date Fair Value of Stock and Option Awards ($)(5) |
Name | | Grant Date | | Threshold ($) | | Target ($) | | Maximum ($) | | Threshold (#) | | Target (#) | | Maximum (#) | | | | |
David M. Davis | | 3/10/2016 | | 156,250 |
| | 625,000 |
| | 937,500 |
| | — |
| | — |
| | — |
| | — |
| | — |
| | — |
| | — |
|
| 3/10/2016 | | — |
| | — |
| | — |
| | — |
| | — |
| | — |
| | 59,459 |
| | — |
| | — |
| | 549,996 |
|
| 3/10/2016 | | — |
| | — |
| | — |
| | — |
| | — |
| | — |
| | — |
| | 169,884 |
| | 9.25 |
| | 550,000 |
|
| 10/11/2016 | | — |
| | — |
| | — |
| | 1,507 |
| | 50,217 |
| | 75,244 |
| | — |
| | — |
| | — |
| | 508,196 |
|
Michael Zemetra | | 3/10/2016 | | 65,625 |
| | 262,500 |
| | 393,750 |
| | — |
| | — |
| | — |
| | — |
| | — |
| | — |
| | — |
|
| 3/10/2016 | | — |
| | — |
| | — |
| | — |
| | — |
| | — |
| | 18,919 |
| | — |
| | — |
| | 175,001 |
|
| 3/10/2016 | | — |
| | — |
| | — |
| | — |
| | — |
| | — |
| | — |
| | 54,054 |
| | 9.25 |
| | 175,000 |
|
Thomas Severson | | 8/25/2016 | | 65,625(9) |
| | 262,500(9) |
| | 393,750(9) |
| | — |
| | — |
| | — |
| | — |
| | — |
| | — |
| | — |
|
| 8/25/2016 | | — |
| | — |
| | — |
| | — |
| | — |
| | — |
| | 80,000 |
| | — |
| | — |
| | 672,800 |
|
| 8/25/2016 | | — |
| | — |
| | — |
| | — |
| | — |
| | — |
| | — |
| | 200,000 |
| | 8.41 |
| | 648,000 |
|
Abel Avellan | | 7/27/2016 | | 65,625 |
| | 262,500 |
| | 393,750 |
| | — |
| | — |
| | — |
| | — |
| | — |
| | — |
| | — |
|
| 7/27/2016 | | — |
| | — |
| | — |
| | — |
| | — |
| | — |
| | 175,000(6) |
| | — |
| | — |
| | 1,405,250 |
|
| 7/27/2016 | | — |
| | — |
| | — |
| | — |
| | — |
| | — |
| | 275,000(7) |
| | — |
| | — |
| | 2,208,250 |
|
| 7/27/2016 | | — |
| | — |
| | — |
| | — |
| | — |
| | — |
| | — |
| | 450,000(8) |
| | 8.03 |
| | 1,395,000 |
|
Walé Adepoju | | 3/10/2016 | | 78,385 |
| | 313,541 |
| | 470,312 |
| | — |
| | — |
| | — |
| | — |
| | — |
| | — |
| | — |
|
| 3/10/2016 | | — |
| | — |
| | — |
| | — |
| | — |
| | — |
| | 22,054 |
| | — |
| | — |
| | 204,000 |
|
| 3/10/2016 | | — |
| | — |
| | — |
| | — |
| | — |
| | — |
| | — |
| | 60,312 |
| | 9.25 |
| | 204,000 |
|
| 10/11/2016 | | — |
| | — |
| | — |
| | 544 |
| | 18,132 |
| | 27,198 |
| | — |
| | — |
| | — |
| | 183,496 |
|
| 10/11/2016 | | — |
| | — |
| | — |
| | — |
| | — |
| | — |
| | — |
| | 90,340 |
| | 9.21 |
| | 312,576 |
|
Stephen Ballas | | 4/11/2016 | | 41,875 |
| | 167,500 |
| | 251,250 |
| | — |
| | — |
| | — |
| | — |
| | — |
| | — |
| | — |
|
| 4/11/2016 | | — |
| | — |
| | — |
| | — |
| | — |
| | — |
| | 48,134 |
| | — |
| | — |
| | 406,251 |
|
| 4/11/2016 | | — |
| | — |
| | — |
| | — |
| | — |
| | — |
| | — |
| | 135,417 |
| | 8.44 |
| | 407,605 |
|
| 10/11/2016 | | — |
| | — |
| | — |
| | 436 |
| | 14,549 |
| | 21,824 |
| | — |
| | — |
| | — |
| | 146,325 |
|
| |
(1) | Represents potential AIP cash bonus payouts under the 2016 Annual Incentive Plan at threshold, target and maximum levels of performance. As previously noted, none of our 2016 NEOs received an AIP bonus payment for the 2016 performance year. The “Threshold” figure however assumes that the Company achieved the minimum level of performance necessary to fund the AIP in 2016 (80% of a Pre-Bonus Adjusted EBITDA target of $66.5 million, which equaled $53.2 million), and further assumes $430.2 million in consolidated revenue for 2016 and a “2” performance rating for strategic/individual goal achievement. The “Target” figure assumes that the Company achieved the target level of Pre-Bonus Adjusted EBITDA under the AIP for 2016, and further assumes the Company achieved its target of $478.0 million in consolidated revenue for 2016 and a “4” performance rating for strategic/individual goal achievement. The “Maximum” figure reflects the maximum bonus that the NEO could earn for 2016 under the terms of the AIP or his employment agreement. |
| |
(2) | Represents number of PSUs to be earned under the 2013 Equity Plan at threshold, target and maximum levels of performance. PSUs cliff vest on the third anniversary of the grant date, based on the Company’s relative total shareholder return (“TSR”) versus the constituents of the Russell 2000 index over a three-year performance period subject to continuous employment on the vesting date. In order for any of the PSUs to be earned, relative TSR achievement during the performance period must exceed the 30th percentile ranking amongst the Russell 2000 constituents. For purposes of calculating the threshold number of unvested PSUs outstanding under the award, we have assumed that PSUs (initially awarded as a “target” number of PSUs) will be awarded at the end of their three-year performance period at the minimum performance threshold for the awards to be granted (i.e., achievement at the 31st relative TSR percentile ranking). Under the terms of the PSUs awards, no PSUs will be awarded for relative TSR performance below this threshold. |
| |
(3) | Represents RSUs that generally vest in four equal annual installments beginning on the first anniversary of their grant date subject to continuous employment on each vesting date. |
| |
(4) | Represents stock options that (i) if granted prior to June 27, 2016 have a five-year term and (ii) if granted on or after that date have a seven-year term. Stock options generally vest and become exercisable with respect 25% of the underlying shares on the first anniversary of the grant date, and vest in 36 equal monthly annual installments thereafter, subject to continuous employment on each vesting date. |
| |
(5) | Amounts reflect the grant date fair value of equity awards (using a Monte-Carlo simulation for PSU awards), computed in accordance with ASC 718, rather than grant-date fair value or amounts paid to or realized by the named individual. We provide information regarding the assumptions used to calculate the value of the equity awards in Note 13 Common Stock, Stock-Based Awards and Warrants to the consolidated financial statements included in this Form 10-K. |
| |
(6) | Mr. Avellan’s inducement shares were awarded on July 27, 2016 as fully vested equity at grant. |
| |
(7) | This RSU grant to Mr. Avellan vests in three equal annual installments beginning on the first anniversary of the grant date, subject to continuous employment on each vesting date. On April 18, 2017, Mr. Avellan submitted notice of his resignation from the Company, effective that same date. On April 19, 2017, the Company and Mr. Avellan entered into a consulting agreement for automatically renewing 12 month terms, subject to either party’s right to earlier terminate on 15 days’ notice for any reason. We agreed with Mr. Avellan that any equity held by him will continue to vest until the termination date of his consulting agreement. As of the date of filing of this Form 10-K, Mr. Avellan ceased providing consulting services to us in November 2017. |
| |
(8) | Mr. Avellan’s stock option grant vests as follows: 150,000 options vested on July 27, 2017, which was the first anniversary of their grant, and then 12,500 options vest on the 27th of each month from August 2017 through July 2019. On April 18, 2017, Mr. Avellan submitted notice of his resignation from the Company, effective that same date. On April 19, 2017, the Company and Mr. Avellan entered into a consulting agreement for automatically renewing 12 month terms, subject to either party’s right to earlier terminate on 15 days’ notice for any reason. We agreed with Mr. Avellan that any equity held by him will continue to vest until the termination date of his consulting agreement. As of the date of filing of this Form 10-K, Mr. Avellan ceased providing consulting services to us in November 2017. |
| |
(9) | Mr. Severson’s target AIP bonus was 75% of his annual base salary, and the payouts at threshold, target and maximum levels of performance in this table reflect the full year’s target payment amount, without proration for his partial year of service in 2016. However, under the terms of his employment agreement Mr. Severson’s target AIP bonus for the 2016 performance year was to be pro-rated based on the number of days elapsed during the 2016 performance period after August 24, 2016 (the commencement date of his employment as the Company’s Chief Financial Officer). As noted under footnote 1 to this table, none of our 2016 NEOs (including Mr. Severson) received an AIP bonus payment for the 2016 performance year. |
Outstanding Equity Awards at 2016 Year-End
The following table sets forth the equity-based awards held by the 2016 NEOs that were outstanding on December 31, 2016, and it disregards the effect of terminations of employment (including forfeiture of outstanding equity awards) that have occurred after that date. As described under “Employment and Other Compensatory Agreements for our 2016 NEOs” below, Mr. Zemetra separated from our employ in 2016, and Messrs. Davis, Severson and Avellan separated from our employ in 2017.
|
| | | | | | | | | | | | | | | | | | | | | | | | | | |
| | | | Option/Stock Appreciation Awards | | Stock Awards |
Name | | Grant Date | | Number of Securities Underlying Unexercised Options Exercisable (#) | | Number of Securities Underlying Unexercised Options Unexercisable (#) | | Option Exercise Price ($) | | Option Expiration Date | | Equity Incentive Awards: Number of Unearned Shares, Units or Other Rights That Have Not Vested (#)(4)(7) | | Equity Incentive Awards: Market Value of Unearned Shares, Units or Other Rights Not Vested ($)(5) | | RSUs: Number of Shares or Units of Stock That Have Not Vested (#)(6) | | RSUs: Market Value of Shares or Units of Stock That Have Not Vested ($)(5) |
David M. Davis | | 1/31/2013 | | 675,000(1) |
| | — |
| | 10.00 |
| | 1/31/2018 |
| | — |
| | — |
| | — |
| | — |
|
| 1/13/2014 | | 18,229(1) |
| | 6,771(1) |
| | 16.70 |
| | 1/13/2019 |
| | — |
| | — |
| | — |
| | — |
|
| 7/9/2014 | | 60,417(1) |
| | 39,583(1) |
| | 11.43 |
| | 7/9/2019 |
| | — |
| | — |
| | — |
| | — |
|
| 3/16/2015 | | 36,867(1) |
| | 47,401(1) |
| | 13.15 |
| | 3/16/2020 |
| | — |
| | — |
| | — |
| | — |
|
| 3/16/2015 | | — |
| | — |
| | — |
| | — |
| | — |
| | — |
| | 22,813 |
| | 147,372 |
|
| 3/16/2016 | | — |
| | 169,884(2) |
| | 9.25 |
| | 3/10/2021 |
| | — |
| | — |
| | — |
| | — |
|
| 3/10/2016 | | — |
| | — |
| | — |
| | — |
| | — |
| | — |
| | 59,459 |
| | 384,105 |
|
| 10/11/2016 | | — |
| | — |
| | — |
| | — |
| | 1,507 |
| | 9,732 |
| | — |
| | — |
|
Michael Zemetra | | 6/25/2013 | | 217,709(1) |
| | — |
| | 9.87 |
| | 6/25/2018 |
| | — |
| | — |
| | — |
| | — |
|
| 10/31/2014 | | 34,375(1) |
| | — |
| | 12.23 |
| | 10/30/2019 |
| | — |
| | — |
| | — |
| | — |
|
| 3/16/2015 | | 5,596 |
| | — |
| | 13.15 |
| | 3/16/2020 |
| | — |
| | — |
| | — |
| | — |
|
| 3/10/2016 | | — |
| | — |
| | 9.25 |
| | 3/10/2021 |
| | — |
| | — |
| | — |
| | — |
|
Thomas Severson | | 8/25/2016 | | — |
| | 200,000(1) |
| | 8.41 |
| | 8/25/2023 |
| | — |
| | — |
| | — |
| | — |
|
| 8/25/2016 | | — |
| | — |
| | — |
| | — |
| | — |
| | — |
| | 80,000 |
| | 516,800 |
|
Walé Adepoju | | 9/16/2013 | | 440,883(1) |
| | 19,167(1) |
| | 10.00 |
| | 9/16/2018 |
| | — |
| | — |
| | — |
| | — |
|
| 9/16/2013 | | 7,072(1) |
| | — |
| | 10.00 |
| | 9/16/2018 |
| | — |
| | — |
| | — |
| | — |
|
| 9/16/2013 | | 31,261(1) |
| | 1,667(1) |
| | 10.00 |
| | 9/16/2018 |
| | — |
| | — |
| | — |
| | — |
|
| 6/5/2014 | | 62,500(1) |
| | 37,500(1) |
| | 10.57 |
| | 6/5/2019 |
| | — |
| | — |
| | — |
| | — |
|
| 3/16/2015 | | — |
| | — |
| | — |
| | — |
| | — |
| | — |
| | 11,406 |
| | 73,683 |
|
| 3/16/2015 | | 18,434(1) |
| | 23,700(1) |
| | 13.15 |
| | 3/16/2020 |
| | — |
| | — |
| | — |
| | — |
|
| 3/10/2016 | | — |
| | — |
| | — |
| | — |
| | — |
| | — |
| | 22,054 |
| | 142,469 |
|
| 3/10/2016 | | — |
| | 63,012(2) |
| | 9.25 |
| | 3/10/2021 |
| | — |
| | — |
| | — |
| | — |
|
| 10/11/2016 | | — |
| | — |
| | — |
| | — |
| | 544 |
| | 3,514 |
| | — |
| | — |
|
| 10/11/2016 | | — |
| | 90,340(2) |
| | 9.21 |
| | 10/11/2023 |
| | — |
| | — |
| | — |
| | — |
|
Abel Avellan | | 7/11/2016 | | — |
| | — |
| | — |
| | — |
| | — |
| | — |
| | 275,000 |
| | 1,776,500 |
|
| 7/11/2016 | | — |
| | 450,000(3) |
| | 8.03 |
| | 7/27/2021 |
| | — |
| | — |
| | — |
| | — |
|
Stephen Ballas | | 4/11/2016 | | — |
| | — |
| | — |
| | — |
| | — |
| | — |
| | 48,134 |
| | 310,946 |
|
| 4/11/2016 | | — |
| | 135,417(1) |
| | 8.44 |
| | 4/11/2021 |
| | — |
| | — |
| | — |
| | — |
|
| 10/11/2016 | | — |
| | — |
| | — |
| | — |
| | 436 |
| | 2,816 |
| | — |
| | — |
|
| |
* | The closing price of a share of our common stock on December 30, 2016 (the last Nasdaq trading day in 2016) was $6.46, and we have used that per-share price for purposes of determining market values in this table. |
| |
(1) | Represents stock options that vest and become exercisable with respect to 25% of their underlying shares on the first anniversary of their grant date and vest with respect to the remaining 75% of their underlying shares on a monthly basis over the following three years until fully vested, subject to continuous employment on each vesting date. |
| |
(2) | Represents stock options that vest and become exercisable in four equal annual installments beginning on the first anniversary of their grant date, subject to continuous employment on each vesting date. |
| |
(3) | Mr. Avellan’s stock options vest and become exercisable with respect to 1/3 of their underlying shares on the first anniversary of their grant date and vest with respect to the remaining 2/3 of their underlying shares on a monthly basis over the following two years until fully vested, subject to continuous employment on each vesting date. |
| |
(4) | Represents PSUs that cliff vest on the third anniversary of the grant date, based on the Company’s relative total shareholder return versus the constituents of the Russell 2000 index over a three-year performance period, and subject to continuous employment on the vesting date. |
| |
(5) | The market values of both the RSUs and PSUs were calculated by multiplying $6.46 (the closing price of a share of our common stock on December 30, 2016) by the number of unvested RSUs and unearned PSUs. In respect of the PSUs, see also footnote 7 to this table. |
| |
(6) | Other than with respect to Mr. Avellan’s awards, these awards represent RSUs that vest in four equal annual installments beginning on the first anniversary of their grant date, subject to continuous employment on each vesting date. Mr. Avellan’s awards vest in three equal annual installments on each anniversary of their grant date, subject to continuous employment on each vesting date. |
| |
(7) | This column includes the number of unvested PSUs assuming actual performance for the performance period is achieved at the “Threshold” level as indicated in the table under “Grants of Plan-Based Awards for 2016” above. For purposes of calculating the threshold number of unvested PSUs outstanding under the award, we have assumed that PSUs (initially awarded as a “target” number of PSUs) will be awarded at the end of their three-year performance period at the minimum performance threshold for the awards to be granted (i.e., achievement at the 31st relative TSR percentile ranking). Under the terms of the PSUs awards, no PSUs will be awarded for relative TSR performance below this threshold. |
Option Exercises and Stock Vested
The following table provides information regarding all exercises of our stock options and the vesting of RSUs (during the year ended December 31, 2016) held by our 2016 NEOs.
|
| | | | | | | | | | | | |
| | Option Awards | | Stock Awards |
Name | | Number of Shares Acquired on Exercise (#) | | Value Realized on Exercise(1) ($) | | Number of Shares Acquired on Vesting (#) | | Value Realized on Vesting(2) ($) |
David M. Davis | | — |
| | — |
| | 7,605 |
| | 62,817 |
|
Michael Zemetra | | — |
| | — |
| | 1,426 |
| | 11,779 |
|
Thomas Severson | | — |
| | — |
| | — |
| | — |
|
Walé Adepoju | | — |
| | — |
| | 3,803 |
| | 31,413 |
|
Abel Avellan | | — |
| | — |
| | 175,000 |
| | 1,405,250 |
|
Stephen Ballas | | — |
| | — |
| | — |
| | — |
|
| |
(1) | Value Realized on Exercise would represent the difference between the market price of the underlying common stock on the exercise date and the exercise price of the options. However, none of the NEOs exercised options in 2016. |
| |
(2) | Value Realized on Vesting is based on the closing price of the Company’s common stock on the vest date. |
Employment and Other Compensatory Agreements for our 2016 NEOs
We have (or had) employment agreements with each of our 2016 NEOs, as summarized below:
David M. Davis, Former Chief Executive Officer
We entered into an employment agreement with Mr. Davis on July 9, 2014, in connection with his then appointment as Chief Executive Officer. Under that agreement, Mr. Davis initially received an annual base salary of $500,000. Mr. Davis was also entitled to an AIP cash bonus with an initial target of 75% of his base salary. We amended the agreement on April 12, 2015 to increase Mr. Davis’s base salary to $550,000 and to increase his AIP cash bonus target to 100% of his annual base salary. We amended the agreement again on March 10, 2016 to provide for reimbursement of commuting expenses for Mr. Davis to and from his principal residence in Minnesota and our Company headquarters in Los Angeles. In October 2016, we increased Mr. Davis’s salary to $625,000. Mr. Davis’s employment agreement also provided for severance and change in control benefits as described below under “Potential Payments upon Termination or Change in Control.”
On February 17, 2017, Mr. Davis’ employment as CEO and service as a member of our Board terminated. For a description of the agreements that we entered into with Mr. Davis upon his separation from us, see “2017 Events and Compensation Decisions Regarding 2016 NEOs.”
Mike Zemetra, Former Chief Financial Officer and Treasurer
We entered into an employment agreement with Mr. Zemetra on November 3, 2014, in connection with his then appointment as our Chief Financial Officer and Treasurer. The agreement provided for an initial annual base salary of $350,000, which remained Mr. Zemetra’s annual base salary through his termination of employment in August 2016. Under the agreement, Mr. Zemetra was also entitled to an AIP cash bonus with an initial target of 50% and not to exceed 100% of Mr. Zemetra’s annual base salary. As noted above under “Annual Cash Incentive (AIP) Compensation,” Mr. Zemetra’s AIP target was 75% of his annual base salary for the 2016 performance year. Mr. Zemetra’s employment agreement also provided for severance and change in control benefits as described below under “Potential Payments upon Termination or Change in Control.”
Mr. Zemetra delivered notice of his intent to terminate his employment on August 22, 2016, and we entered into a release and transition services agreement with him on August 25, 2016. Pursuant to that agreement, Mr. Zemetra’s employment with the Company terminated effective August 31, 2016. For a description of the agreements that we entered into with Mr. Zemetra upon his separation from us, see “2017 Events and Compensation Decisions Regarding 2016 NEOs.”
Walé Adepoju, Executive Vice President, Media & Content
We entered into an employment agreement with Mr. Adepoju on July 30, 2014 in connection with his then appointment as our Executive Vice President and Chief Commercial Officer. The agreement provided for an initial annual base salary of $400,000. Under that agreement, Mr. Adepoju was also entitled to an AIP cash bonus with an initial target of 50% of his base salary. In April 2015, we increased Mr. Adepoju’s base salary to $408,000 and his AIP cash bonus target to 75% of his annual base salary. In April 2016, we increased his base salary to $418,055, and in April 2017, we increased it to $428,506. Mr. Adepoju’s agreement also provided for severance protection benefits as described below under “Potential Payments upon Termination or Change in Control.” Those severance benefits were in effect during 2016 (the period covered by this Form 10-K), but have since been superseded by our Executive Severance Plan in which Mr. Adepoju participates. See “Additional Elements of Our Compensation Program.”
Tom Severson, Former Chief Financial Officer
We entered into an employment agreement with Mr. Severson on August 25, 2016 in connection with his then appointment as our Chief Financial Officer. Under that agreement, Mr. Severson received an initial annual base salary of $350,000, which remained his annual base salary through his termination of employment in February 2017. Mr. Severson was also entitled to an AIP cash bonus with an initial target of 75% of his annual base salary (prorated based on his period of service as CFO in 2016). Pursuant to his employment agreement, Mr. Severson also received an initial equity grant (consisting of RSUs and options) with a grant date fair value equal to $1,320,800 vesting over a four-year period, subject to continuous employment on each vesting date. Mr. Severson received a temporary housing stipend in Los Angeles, California for up to six months (associated with his temporary relocation to Los Angeles during our CFO transition in late 2016) and a relocation allowance of up to $25,000 in connection with his then anticipated relocation to Los Angeles. Mr. Severson’s agreement also provided for severance protection benefits as described below under “Potential Payments upon Termination or Change in Control.”
On February 20, 2017, Mr. Severson’s employment as CFO terminated. See “2017 Events and Compensation Decisions Regarding 2016 NEOs.”
Abel Avellan, Former President & Chief Strategy Officer
We entered into an employment agreement with Mr. Avellan on July 27, 2016 in connection with his then appointment as our President and Chief Strategy Officer upon the EMC Acquisition. Under the employment agreement, Mr. Avellan received an initial annual base salary of $325,000, which remained his annual base salary through his termination of employment in April 2017. Mr. Avellan was also entitled to an AIP cash bonus with an initial target of 75% of his annual base salary. Pursuant to his employment agreement, Mr. Avellan received an initial equity grant with a grant date value equal to $5,008,500, consisting of (1) immediately vested shares with a grant date value of $1,405,250 and (2) the remainder (consisting of RSUs and options) vesting over a three-year period, subject to continuous employment on each vesting date. Mr. Avellan’s agreement also provided for severance and change in control protection benefits as described below under “Potential Payments upon Termination or Change in Control.”
On April 18, 2017, Mr. Avellan resigned as our President & Chief Strategy Officer effective that same date. For a description of the agreements that we entered into with Mr. Avellan upon his separation from us, see “2017 Events and Compensation Decisions Regarding 2016 NEOs.”
Stephen Ballas, Executive Vice President, General Counsel & Corporate Secretary
We entered into an employment agreement with Mr. Ballas on March 11, 2016 in connection with his then appointment as our General Counsel and Corporate Secretary. Under the employment agreement, Mr. Ballas received an initial annual base salary of $335,000, which was increased in 2017 as described in the following paragraph. Mr. Ballas was also entitled to an AIP cash bonus with an initial target of 50% of his annual base salary and without proration for his mid-year start date in 2016, which was increased in 2017 as described in the following paragraph. Pursuant to his employment agreement, Mr. Ballas also received a $50,000 sign-on bonus and an initial equity grant (consisting of RSUs and options) with a grant date value equal to $812,500 vesting over a four-year period, subject to continuous employment on each vesting date. In October 2016, we granted an additional equity grant (consisting of PSUs) with a grant date value of $134,000, cliff vesting in October 2019 subject to his continuous employment through the vesting date. Mr. Ballas’s employment agreement provided for severance and change in control protection benefits as described below under “Potential Payments upon Termination or Change in Control.” Those benefits were in effect during 2016 (the period covered by this Form 10-K), but have since been superseded by our Executive Severance Plan in which Mr. Ballas participates. See “Additional Elements of Our Compensation Program.”
In April 2017, we increased Mr. Ballas’s base salary to $350,000 and his AIP cash bonus target to 75% of his annual base salary.
Employment and Compensatory Agreements for Our Current CEO and CFO
We also have employment agreements with our current CEO and CFO who were not NEOs for 2016 (because they were not employed by us during that year), but who will be NEOs for 2017 when we publish our proxy statement for our 2018 annual stockholders’ meeting:
Jeffrey A. Leddy, Chief Executive Officer
We entered into an employment agreement with Mr. Leddy on February 21, 2017, in connection with his appointment as our Chief Executive Officer. Under his employment agreement, Mr. Leddy receives an initial annual base salary of $625,000. Mr. Leddy is also entitled to an AIP cash bonus with an initial target of 100% of his annual base salary. Pursuant to his employment agreement, if our stockholders approve a new 2017 Omnibus Long-Term Incentive Plan that we will propose for their approval at our next annual stockholders’ meeting, then Mr. Leddy will also receive an initial equity grant consisting of (a) an option (to be fully vested at grant) representing the right to purchase 350,000 shares of our common stock, (b) an additional option representing the right to purchase 650,000 shares of our common stock vesting over a three-year period, subject to continuous service on each vesting date, and (c) RSUs representing 200,000 shares of our common stock vesting over a three-year period, subject to continuous service on each vesting date. The exercise price of the stock options will be equal to $6.22, the closing price on February 17, 2017 (which is the date that our Compensation Committee approved his employment agreement). In addition, under Mr. Leddy’s employment agreement, we agreed to reimburse him for travel and to and from his principal residence to the Company’s office locations and for accommodations while traveling.
Mr. Leddy’s agreement also provided for severance and change in control protection benefits under our Executive Severance Plan. See “Additional Elements of Our Compensation Program.”
Paul Rainey, Executive Vice President and Chief Financial Officer
We entered into an employment agreement with Mr. Rainey on April 7, 2017, in connection with his appointment as our Executive Vice President and Chief Financial Officer. Under his employment agreement, Mr. Rainey receives an initial annual base salary of $375,000. Mr. Rainey is also entitled to an AIP cash bonus with an initial target of 75% of his annual base salary (prorated for the 2017 performance year for the number of full months elapsed in 2017 after his employment commencement date). Pursuant to his employment agreement, if our stockholders approve our new 2017 Omnibus Long-Term Incentive Plan at our next annual stockholders’ meeting, then Mr. Rainey will also receive an initial equity grant with a grant-date fair value of $750,000, consisting of (1) options and RSUs vesting over a four-year period (with a grant date fair value of $650,000) and (2) PSUs cliff vesting in October 2020 (with a grant date fair value of $100,000), subject to his continuous employment on each vesting date.
Mr. Rainey’s agreement also provided for severance and change in control protection benefits under our Executive Severance Plan. See “Additional Elements of Our Compensation Program.”
Potential Payments upon Termination or Change in Control
We believe that severance and change in control protections are important components of our executive officers’ compensation packages because these protections provide security and stability that enable our executive officers to focus on their duties and responsibilities to the Company and to act with the best interests of the Company and its stockholders in mind at all times, even under circumstances that may be adverse to the executive officer’s job security.
The following narrative summarizes the payments and benefits that our 2016 NEOs would have been entitled to receive upon certain terminations of employment and/or a change in control, assuming those events occurred on December 31, 2016 and applying their severance and change in control protection benefits as in effect on December 31, 2016. As previously noted, Messrs. Davis, Zemetra, Severson and Avellan are no longer employed by us, with Messrs. Davis, Severson and Avellan having separated from our employ in early 2017 and with Mr. Zemetra having separated in mid-2016.
Note that we adopted a new Executive Severance Plan in 2017 in which all of our executive officers now participate and which superseded the termination and change in control benefits previously in effect as of December 31, 2016. See “Additional Elements of Our Compensation Program.”
Death, Disability or Retirement.
| |
• | Regarding Messrs. Davis, Zemetra, Severson and Avellan. As previously noted, Messrs. Davis, Zemetra, Severson and Avellan are no longer employed by us, with Messrs. Davis, Severson and Avellan having separated from our employ in early 2017 and with Mr. Zemetra having separated in mid-2016. The actual severance payments and agreements related to their employment termination are described under “2017 Events and Compensation Decisions Regarding 2016 NEOs.” |
| |
• | Regarding Messrs. Adepoju and Ballas. Messrs. Adepoju and Ballas would not have received any cash benefits upon death, disability or retirement but our RSU and option award agreements, including for the equity grants made in 2016 to Messrs. Adepoju and Ballas, provide for continued or accelerated vesting of the unvested portion of those awards in the event of termination of employment due to death or disability. Under the equity award agreement for the PSUs (including for those grants made to Messrs. Adepoju and Ballas), if a PSU recipient dies or becomes disabled prior to the end of the performance period, the Company would waive the continuous-employment vesting requirement, and the PSU award would vest at the applicable TSR performance level as measured at the end of the three-year performance period. |
Termination without a Change in Control.
| |
• | Regarding Messrs. Davis, Zemetra, Severson and Avellan. As previously noted, Messrs. Davis, Zemetra, Severson and Avellan are no longer employed by us, with Messrs. Davis, Severson and Avellan having separated from our employ in early 2017 and with Mr. Zemetra having separated in mid-2016. The actual severance payments and agreements related to their employment termination are described under “2017 Events and Compensation Decisions Regarding 2016 NEOs.” |
| |
• | Regarding Mr. Adepoju. If Mr. Adepoju’s employment had been terminated by the Company without “cause” or by Mr. Adepoju for “good reason,” then Mr. Adepoju would have been (as of December 31, 2016) entitled to receive continuation of his then existing health and welfare benefits and his base salary for a period of six months following his termination, subject to his execution of a general release in favor of the Company. Additionally, he would have remained eligible to vest in a pro-rata portion of his PSU award based on the applicable relative TSR performance level as measured at the end of the three-year performance period, prorated based on the portion of the performance period that he had remained employed (e.g., if terminated on December 31, 2016, approximately three-months into the 36-month performance period for the PSUs granted in October 2016, then he would have remained eligible for 3/36ths of that PSU award), subject to his compliance with confidentiality, non-competition and non-solicitation restrictive conditions through the end of the performance period. |
| |
• | Regarding Mr. Ballas. If Mr. Ballas’s employment had been terminated by the Company without “cause,” then Mr. Ballas would have been (as of December 31, 2016) entitled to receive continuation of his then existing health and welfare benefits and his base salary for a period of 12 months following his termination, subject to his execution of a general release in favor of the Company. Additionally, including if he had terminated his employment for “good reason,” he would have remained eligible to vest in a pro-rata portion of his PSU award based on the applicable relative TSR performance level as measured at the end of the three-year performance period, prorated based on the portion of the |
performance period that he had remained employed (e.g., if terminated on December 31, 2016, approximately three-months into the 36-month performance period for the PSUs granted in October 2016, then he would have remained eligible for 3/36ths of that PSU award), subject to his compliance with confidentiality, non-competition and non-solicitation restrictive conditions through the end of the performance period.
Termination with a Change in Control.
| |
• | Regarding Messrs. Davis, Zemetra, Severson and Avellan. As previously noted, Messrs. Davis, Zemetra, Severson and Avellan are no longer employed by us, with Messrs. Davis, Severson and Avellan having separated from our employ in early 2017 and with Mr. Zemetra having separated in mid-2016. The actual severance payments and agreements related to their employment termination are described under “2017 Events and Compensation Decisions Regarding 2016 NEOs.” |
| |
• | Regarding Messrs. Adepoju and Ballas. If we had experienced a “change in control” (as defined in the 2013 Equity Plan) and if Messrs. Adepoju and Ballas were terminated without “cause” within one year following the change in control, then in addition to the severance entitlements described above under “Termination without a Change in Control,” Messrs. Adepoju and Ballas would also have been (as of December 31, 2016) entitled to accelerated vesting of all outstanding and unvested stock option and RSU awards previously granted to them and held by them upon their termination. In addition, if we had experienced a “change in control” as of December 31, 2016, but Messrs. Adepoju and Ballas continued in employment following such “change in control,” then with respect to their PSUs, our relative TSR performance level would have been measured as of the change-in-control date, and the resulting PSUs would have then been converted to “time-vesting” RSUs without any remaining performance condition. In this case, if the successor entity had assumed, converted or replaced the RSUs with publicly-traded equity (having an equivalent value and vesting schedule), then the resulting “time vesting” RSUs would have vested on their original vesting date (i.e., the third anniversary of the October 2016 grant date), subject to continuous employment through that date. If the successor entity did not so assume, convert or replace the PSUs with publicly-traded equity (having an equivalent value and vesting schedule), then the PSUs would have vested on the date of the change of control based on relative TSR performance as measured on the date of the change of control. In addition, vesting would have accelerated for the PSUs if the Company terminated Messrs. Adepoju’s or Ballas’s employment without cause or if they had resigned for good reason within four months prior to or within 24 months following the change of control, using relative TSR performance as measured on the change-of-control date. |
Excise taxes can be triggered in a change in control, but we do not provide excise tax “gross-ups” to any of our executive officers. See also footnote 4 to the table below in this subsection.
The following table shows the payments and benefits that our 2016 NEOs would have been entitled to receive upon qualifying terminations of employment and/or a change in control, assuming those events occurred on December 31, 2016 and applying their severance and change in control protection benefits as in effect on December 31, 2016. With respect to this table:
| |
• | As previously noted, Messrs. Davis, Zemetra, Severson and Avellan are no longer employed by us, with Messrs. Davis, Severson and Avellan having separated from our employ in early 2017 and with Mr. Zemetra having separated in mid-2016. The actual severance payments and agreements related to their employment termination are described above under “2017 Events and Compensation Decisions Regarding 2016 NEOs.” |
| |
• | As previously noted, we adopted a new Executive Severance Plan in 2017 in which all of our current executive officers now participate. See “Additional Elements of Our Compensation Program.” The figures in the table below disregard the Executive Severance Plan because the Plan was not in effect as of December 31, 2016. But, our Executive Severance Plan has since superseded the termination and change in control benefits previously in effect on December 31, 2016. |
| |
• | Amounts shown do not include (i) accrued but unpaid salary through the date of termination, and (ii) other benefits earned or accrued by the NEO during his employment that are available to all salaried employees, such as accrued vacation. |
| |
• | Because Messrs. Davis, Severson and Avellan terminated employment after December 31, 2016, the table below shows the payments and benefits that Messrs. Davis, Severson and Avellan—who were employed on December 31, 2016—would have been entitled to on December 31, 2016 had they been terminated on that date. But, we have not presented similar information for Mr. Zemetra because his termination occurred prior to December 31, 2016. |
|
| | | | | | | | | | | |
Name | | Benefit | | Termination for Cause or without Good Reason ($) | | Termination without Cause or for Good Reason, without a Change of Control ($) | | Termination for Good Reason or Without Cause with a Change in Control ($) |
David M. Davis(7) | | Severance(1) | | — |
| | 1,093,750(6) |
| | 2,187,500 |
|
| Benefit continuation(2) | | — |
| | 6,540 |
| | 6,540 |
|
| Accelerated equity awards(3) | | — |
| | — |
| | 435,449 |
|
| Total | | — |
| | 1,100,290 |
| | 2,629,489(4) |
|
Michael Zemetra(5) | | Severance(1) | | — |
| | — |
| | — |
|
| Benefit continuation(2) | | — |
| | — |
| | — |
|
| Accelerated equity awards(3) | | — |
| | — |
| | — |
|
| Total | | — |
| | — |
| | — |
|
Thomas Severson(7) | | Severance(1) | | — |
| | 350,000(6) |
| | 533,200(6) |
|
| Benefit continuation(2) | | — |
| | 6,540 |
| | 6,540 |
|
| Accelerated equity awards(3) | | — |
| | | | 516,800 |
|
| Total | | — |
| | 356,540(6) |
| | 1,056,540(4) |
|
Walé Adepoju | | Severance(1) | | — |
| | 209,028 |
| | 209,028 |
|
| Benefit continuation(2) | | — |
| | 3,270 |
| | 3,720 |
|
| Accelerated equity awards(3) | | — |
| | — |
| | 216,158 |
|
| Total | | — |
| | 212,298 |
| | 428,456(4) |
|
Abel Avellan(8) | | Severance(1) | | — |
| | — |
| | — |
|
| Benefit continuation(2) | | — |
| | — |
| | — |
|
| Accelerated equity awards(3) | | — |
| | — |
| | — |
|
| Total | | — |
| | — |
| | — |
|
Stephen Ballas | | Severance(1) | | — |
| | 335,000 |
| | 335,000 |
|
| Benefit continuation(2) | | — |
| | 6,540 |
| | 6,540 |
|
| Accelerated equity awards(3) | | — |
| | | | 310,946(10) |
|
| Total | | — |
| | 341,540 |
| | 652,486(4) |
|
| |
(1) | Represents cash severance provided under each NEO’s employment agreement as in effect on December 31, 2016. |
| |
(2) | Represents the cost of Company-subsidized continued health and welfare benefits for the payout period provided under each NEO’s employment agreement as in effect on December 31, 2016, based on our then-applicable costs to provide such coverage as of December 31, 2016. We anticipate that we would have provided COBRA benefits to Mr. Severson, if a termination without cause or for good reason had occurred even though his employment agreement did not provide for this benefit, and so the figure for Mr. Severson in this table reflects that COBRA benefit. |
| |
(3) | Represents the aggregate value of the NEO’s unvested stock options, PSUs and RSUs that would have vested (partially or in full, as described in the narrative preceding this table) on an accelerated basis, determined by multiplying the number of accelerating option shares, RSUs and PSUs by the Nasdaq trading price of our common stock on December 30, 2016 ($6.46), which was the last Nasdaq trading day in 2016, and subtracting any applicable exercise prices for the options. As noted in the narrative above this table, the NEOs would only have been entitled to payments on any accelerated PSUs based on actual relative-TSR performance. Therefore, we have not ascribed any value to the PSUs in the table above because, as of December 31, 2016, the minimum relative-TSR performance criteria would not have been achieved and as such the “actual” number of PSUs awarded would have been zero. Similarly, because the closing price of our stock on December 30, 2016 was greater than the exercise price of any applicable accelerated options, no value is reported in the table above with respect to any options. |
| |
(4) | These severance amounts disregard any potential consequence of a “parachute payment” and related exercise tax under Internal Revenue Code Sections 280G and 4999 upon a change in control. Some of our 2016 NEOs’ employment agreements provided that in the event that a change in control of the Company occurred and any severance payment to the NEO constituted a “parachute payment” under Section 280G, then the Company was to either (a) reduce the amount of the payment so that the payment would not be subject to the excise tax under Section 4999, or alternatively (b) pay the full amount of such payment to the NEO (with such executive being personally responsible for payment of any associated excise taxes), whichever produced the better after-tax result for the NEO. |
| |
(5) | Pursuant to a release and transition services agreement dated August 25, 2016, Mr. Zemetra’s employment with the Company terminated effective August 31, 2016. For the terms of Mr. Zemetra’s severance package, see “2017 Events and Compensation Decisions Regarding 2016 NEOs” and “Employment and Other Compensatory Agreements for Our 2016 NEOs.” Pursuant to applicable SEC guidance, the potential payments regarding a hypothetical termination for Mr. Zemetra on December 31, 2016 are not required to be disclosed because he was not employed on that date. |
| |
(6) | As previously discussed under “2017 Events and Compensation Decisions Regarding 2016 NEOs,” we did not pay any AIP cash bonuses to our executive officers for the 2016 performance year, and so the severance amount reflected in this table for Messrs. Davis and Severson does not include any amount for their 2016 AIP cash bonuses. |
| |
(7) | Amounts listed for Messrs. Davis and Severson in this table disregard the actual benefits paid to them upon their actual termination because this table represents benefit amounts as of December 31, 2016, which was before they terminated employment with the Company. For a description of the agreements (and related actual severance benefits) that we entered into with Messrs. Davis and Severson upon their separation from us, see “2017 Events and Compensation Decisions Regarding 2016 NEOs” and “Employment and Other Compensatory Agreements for Our 2016 NEOs.” |
| |
(8) | On April 18, 2017, Mr. Avellan delivered notice of his resignation and his employment with us terminated on that same day. For a description of the agreement (and related actual severance benefits) that we entered into with Mr. Avellan upon his separation from us, see “2017 Events and Compensation Decisions Regarding 2016 NEOs.” Pursuant to applicable SEC guidance, the potential payments regarding a hypothetical termination for Mr. Avellan on December 31, 2016 are not required to be disclosed. |
| |
(9) | On December 31, 2016, other than in connection with a change in control, Mr. Ballas would only have been entitled to cash severance in the event of a termination of his employment by the Company without cause. |
| |
(10) | On December 31, 2016, Mr. Ballas would have been entitled to accelerated vesting of stock options, PSUs and RSUs granted in 2016 if his employment had been terminated in connection with a change in control. As noted under footnote (3) above, however, we have assumed for purposes of this table that the actual number of PSUs awarded would have been zero. |
Director Compensation
We have an Outside Director Compensation Program. This program is intended to compensate fairly each of our outside (i.e., non-employee directors) with cash and equity compensation for the time and effort required to serve as a member of our Board. (Our CEO does not receive any additional compensation for his Board service while serving as CEO.) Beginning in August 2016, our Board’s Compensation Committee retained FW Cook to assist it in reviewing and assessing our outside non-employee director compensation program to help ensure that our program is competitive and that its structure is consistent with best practices.
Annual Cash Retainer and Cash Chair Fees. Under the program, each outside director receives a cash retainer (payable quarterly and prorated for partial service in a quarter) of $75,000 per calendar year for his or her service on the Board. In addition, our Board Chair receives an additional $25,000 per calendar year for his or her service as Board Chair, the Chair of our Audit Committee receives an additional $25,000 per calendar year for his or her service as Chair of that committee, and the Chair of our Compensation Committee receives an additional $10,000 per calendar year for his or her service as Chair of that committee.
Equity Compensation. Under the program, each outside director also receives equity compensation with a grant date fair value of $100,000 per calendar year for his or her service on the Board. During 2016, half of the grant consisted of RSUs, and the other half consisted of non-qualified stock options. The stock options granted in 2016 for director compensation had a five-year term and an exercise price of $9.25 per share (the closing price of our common stock on the 2016 annual equity grant date for director compensation) and vested in four equal quarterly installments beginning on June 10, 2016. The RSUs granted in 2016 for director compensation cliff vested on April 10, 2017.
In June 2017, our Compensation Committee determined that all future equity compensation for Board service (including for Board service commencing in 2017) should consist only of RSUs that cliff vest on the earlier of the one-year anniversary of the grant date and the next annual stockholders’ meeting.
The table below provides summary information concerning compensation paid or accrued by us during 2016 to or on behalf of our then outside directors for services rendered during that year. David Davis, our former CEO, was also a director during 2016, but he was not an outside director and therefore did not receive any additional compensation for his service as a director. Ronald Steger joined our Board in April 2017 and so did not receive any compensation for Board service in 2016.
|
| | | | | | | | | | | | | | |
Name | Cash Compensation ($) | | Stock Option Awards ($) | | RSU Awards ($) | | Other Compensation ($) | | Total ($) |
Louis Bélanger-Martin (1) | 18,750 |
| | — |
| | — |
| | — |
| | 18,750 |
|
Robert W. Reding | 75,000 |
| | 50,000 |
| | 50,000 |
| | — |
| | 175,000 |
|
Jeffrey A. Leddy (2) | 85,000 |
| | 50,000 |
| | 50,000 |
| | — |
| | 185,000 |
|
Jeffrey E. Epstein | 100,000 |
| | 50,000 |
| | 50,000 |
| | — |
| | 200,000 |
|
Harry E. Sloan | 75,000 |
| | 50,000 |
| | 50,000 |
| | — |
| | 175,000 |
|
Jeff Sagansky | 75,000 |
| | 50,000 |
| | 50,000 |
| | — |
| | 175,000 |
|
Edward L. Shapiro | 100,000 |
| | 50,000 |
| | 50,000 |
| | — |
| | 200,000 |
|
Stephen Hasker | 75,000 |
| | 50,000 |
| | 50,000 |
| | — |
| | 175,000 |
|
| |
(1) | Louis Bélanger-Martin resigned from our Board effective March 11, 2016. |
| |
(2) | Jeffrey Leddy was an outside director during 2016. He became our CEO in February 2017. |
Outside Director Stock Ownership Guidelines
To align the interests of our Board members with the interests of our stockholders, our Board’s Governance Committee has adopted Stock Ownership Guidelines for our Outside Directors. Under the Guidelines, each outside director must retain ownership of our stock equal to three times the value of the annual cash retainer paid for Board service pursuant to our Outside Director Compensation Program as in effect from time to time. If at any time an outside director has not satisfied these Guidelines, the director must retain 100% of the shares remaining after payment of taxes and exercise price upon exercise of stock options, upon the vesting of restricted stock or upon the settlement of vested RSUs. Shares that count toward compliance with the Guidelines include shares of our common stock that our outside director owns outright (either directly or beneficially, e.g., through a family trust) and vested restricted stock or RSUs held by the outside director. Shares that do not count are (i) shares held by mutual, hedge or other investment funds in which the outside director is a general partner, limited partner or investor, (ii) unexercised, outstanding stock options (whether or not vested), (iii) unvested/unearned restricted stock or RSUs and (iv) shares transferred to an outside director’s employer pursuant to such employer’s policies.
Although the Outside Director Stock Ownership Guidelines are not applicable to our CEO because he is an employee director (and as such not an “outside director”), we have also adopted Stock Ownership Guidelines applicable to our CEO. See “Additional Elements of Our Compensation Program.”
ITEM 12. SECURITY OWNERSHIP OF CERTAIN BENEFICIAL OWNERS AND MANAGEMENT AND RELATED STOCKHOLDER MATTERS
The following table sets forth information known to the Company regarding beneficial ownership of shares of the Company’s common stock as of October 31, 2017, (the “Beneficial Ownership Table Date”) by:
| |
• | each person who is known to us to be the beneficial owner of more than 5% of the outstanding shares of the Company’s common stock; |
| |
• | our current CEO and CFO; and |
| |
• | all of the Company’s current executive officers and directors as a group. |
The amounts and percentages of shares beneficially owned are reported on the basis of regulations of the SEC governing the determination of beneficial ownership of securities. Under SEC rules, a person is deemed to be a “beneficial owner” of a security if that person has or shares voting power or investment power, which includes the power to dispose of or to direct the disposition of such security. A person is also deemed to be a beneficial owner of any securities of which that person has a right to acquire beneficial ownership within 60 days. Securities that can be so acquired are deemed to be outstanding for purposes of computing such person’s ownership percentage, but not for purposes of computing any other person’s percentage. Under these rules, more than one person may be deemed to be a beneficial owner of the same securities, and a person may be deemed to be a beneficial owner of securities as to which such person has no economic interest.
Beneficial ownership of the Company’s common stock is based on 90,743,565 shares of the Company’s common stock issued and outstanding as of October 31, 2017 (excluding 3,053,634 shares of common stock held by our wholly-owned subsidiary).
Except as otherwise indicated in these footnotes, each of the beneficial owners listed has, to our knowledge, sole voting and investment power with respect to the indicated shares of common stock. Unless otherwise indicated, the address of each individual in the following table is 6100 Center Drive, Suite 1020, Los Angeles, California 90045. Addresses for the other beneficial owners are set forth in the footnotes to the table.
.
|
| | | | | | |
Name and Address of Beneficial Owner | | Number of Shares of Common Stock(1) | | Percent of Outstanding Common Stock |
PAR Investment Partners, L.P.(2) | | 28,971,072 |
| | 31.9 | % |
ABRY Partners, LLC(3) | | 9,637,955 |
| | 10.6 | % |
Frontier Capital Management Co., LLC(4) | | 7,534,133 |
| | 8.3 | % |
Nantahala Capital Management, LLC(5) | | 7,405,166 |
| | 8.1 | % |
Putnam Investment Management, LLC(6) | | 5,989,860 |
| | 6.6 | % |
Abrams Capital Management, LLC(7) | | 5,000,000 |
| | 5.5 | % |
Franklin Advisors, Inc.(8) | | 4,711,097 |
| | 5.1 | % |
Walé Adepoju(9) | | 682,897 |
| | * |
|
Abel Avellan(10) | | 873,592 |
| | * |
|
Stephen Ballas(11) | | 63,218 |
| | * |
|
David M. Davis(12) | | 905,954 |
| | * |
|
Jeffrey E. Epstein(13) | | 72,044 |
| | * |
|
Stephen Hasker(14) | | 23,344 |
| | * |
|
Jeffrey A. Leddy(15) | | 72,044 |
| | * |
|
Robert W. Reding(16) | | 72,044 |
| | * |
|
Jeff Sagansky(17) | | 812,884 |
| | * |
|
Edward L. Shapiro(18) | | 77,449 |
| | * |
|
Harry E. Sloan(19) | | 172,043 |
| | * |
|
Michael Zemetra | | 22,907 |
| | * |
|
Paul Rainey | | — |
| | * |
|
Thomas Severson | | — |
| | * |
|
Ronald Steger | | — |
| | * |
|
All current executive officers and directors as a group (13 individuals) | | 2,182,430 |
| | 2.4 | % |
* Less than 1%
| |
(1) | Represents shares of the Company’s common stock held, options and warrants held that were vested and/or exercisable at the Beneficial Ownership Table Date and any such securities that will vest and/or become exercisable within 60 days thereafter (disregarding any shares that we may later “withhold to cover” for tax purposes). |
| |
(2) | According to a Schedule 13D/A filed with the SEC on January 5, 2017 and its “5%+ Stockholder Questionnaire” submitted to the Company on January 18, 2017, all shares are held directly by PAR Investment Partners, L.P. (“PIP”). PAR Capital Management, Inc. (“PCM”), as the general partner of PAR Group, L.P., which is the general partner of PAR, has investment discretion and voting control over shares held by PIP. No stockholder, director, officer or employee of PCM has beneficial ownership (within the meaning of Rule 13d-3 promulgated under the Exchange Act) of any shares held by PIP. The business address of PAR Capital Management, Inc. is 200 Clarendon Street, 48th Floor, Boston, MA 02116. |
| |
(3) | According to a Schedule 13G/A filed with the SEC on August 8, 2017 on behalf of ABRY Partners VII, L.P., a Delaware corporation (“ABRY Partners”), ABRY Partners VII Co-Investment Fund, L.P., a Delaware corporation (“ABRY Fund”), ABRY Investment Partnership, L.P., a Delaware corporation (“ABRY Partnership”), EMC Holdco 2 B.V., a Netherlands company (“EMC Holdco 2”), Jay Grossman, an individual and a U.S. Citizen, and Peggy Koenig, an individual and a U.S. citizen. ABRY Partners, ABRY Fund, ABRY Partnership, EMC, Jay Grossman and Peggy Koenig hold shared voting and shared dispositive power with respect to 9,637,955 shares of the Company’s common stock, and EMC Acquisition Holdings LLC (“EMC Acquisition Holdings”) hold shared voting and shared dispositive power with respect to 5,080,049 shares of the Company’s common stock. EMC Holdco 2 is the direct owner of 83.3% of the common stock of EMC Acquisition Holdings and may be deemed to share and may be deemed to share voting and dispositive power with respect to any shares beneficially owned by EMC Acquisition Holdings. EMC Holdco 1 Coöperatief U.A., a cooperative entity organized and existing under the laws of the Netherlands (“EMC Holdco 1”), is the sole owner of EMC Holdco 2 and may be deemed to share voting and dispositive power with respect to any of our shares beneficially owned by EMC Holdco 2. EMC Aggregator, LLC, a Delaware limited liability company, is the direct owner of 99.0% of the common stock of EMC Holdco 1, and EMC Aggregator Sub, LLC, a wholly owned subsidiary of EMC Aggregator, LLC and a Delaware limited liability company, is the direct owner of 1.0% of the common stock of EMC Holdco 1. Each of EMC Aggregator, LLC and EMC Aggregator Sub, LLC may be deemed to share voting and dispositive power with respect to any of our shares beneficially owned by EMC Holdco 1. As the direct owner of 96.72429% of the equity interests of EMC Aggregator, LLC, ABRY Partners also may be deemed to share voting and dispositive power with respect to any of our shares beneficially owned by EMC Holdco 2. As the direct owner of 3.19196% of the equity interests of EMC Aggregator, LLC, ABRY Fund also may be deemed to share voting and dispositive power with respect to any of our shares beneficially owned by EMC Holdco 2. As the direct owner of 0.08375% of the equity interests of EMC Aggregator, ABRY Partnership also may be deemed to share voting and dispositive power with respect to any of our shares beneficially owned by EMC Holdco 2. Each of C.J. Brucato, Tomer Yosef-Or, and James Scola are members of the board of directors of each of EMC Aggregator, LLC and EMC Aggregator Sub, LLC and may be deemed to share voting and dispositive power with respect to any of our shares beneficially owned by EMC Holdco 2, but disclaims beneficial ownership of such shares. EMC Holdco 1, EMC Aggregator, LLC, EMC Aggregator Sub, |
LLC, ABRY Partners VII, L.P., ABRY Partners VII Co-Investment Fund, L.P., and ABRY Investment Partnership, L.P. each disclaim beneficial ownership of such shares beneficially owned by EMC Holdco 2. ABRY Partners VII Co-Investment GP, LLC, a Delaware limited liability company, the general partner of ABRY Partners, may be deemed to share voting and dispositive power with respect to any of our shares beneficially owned by EMC Holdco 2, but disclaims beneficial ownership of such shares. ABRY VII Capital Partners, L.P., a Delaware limited partnership, the general partner of ABRY Partners, may be deemed to share voting and dispositive power with respect to any of our shares beneficially owned by EMC Holdco 2, but disclaims beneficial ownership of such shares. ABRY Partners Capital Investors, LLC, a Delaware limited liability company, the general partner of each of ABRY Partners VII Co-Investment GP, LLC and ABRY VII Capital Partners, L.P., may be deemed to share voting and dispositive power with respect to any of our shares beneficially owned by EMC Holdco 2, but disclaims beneficial ownership of such shares. ABRY Investment GP, LLC, a Delaware limited liability company, the general partner of ABRY Investment Partnership, L.P., may be deemed to share voting and dispositive power with respect to any of our shares beneficially owned by EMC Holdco 2, but disclaims beneficial ownership of such shares. ABRY Partners Capital Investors, LLC, a Delaware limited liability company, the general partner of each of ABRY Partners VII Co-Investment GP, LLC and ABRY VII Capital Partners, L.P., may be deemed to share voting and dispositive power with respect to any of our shares beneficially owned by EMC Holdco 2, but disclaims beneficial ownership of such shares. Each of Jay Grossman and Peggy Koenig, equal members and managers of each of ABRY Investment GP, LLC and ABRY Partners Capital Investors, LLC, may be deemed to share voting and dispositive power with respect to any of our shares beneficially owned by EMC Holdco 2, but each of them disclaims beneficial ownership of such shares. The business address of ABRY Partners, ABRY Fund, ABRY Partnership, EMC Holdco 2, EMC Acquisition Holdings, Jay Grossman, and Peggy Koenig is c/o ABRY Partners, 111 Huntington Avenue, 29th Floor, Boston, MA 02199.
| |
(4) | According to a Schedule 13G/A filed with the SEC on February 10, 2017, Frontier Capital Management Co., LLC holds sole voting power with respect to 4,344,099 shares of the Company’s common stock and sole dispositive power with respect to 7,534,133 shares of the Company’s common stock. The business address of Frontier Capital Management Co., LLC is 99 Summer Street, Boston, MA 02110. |
| |
(5) | According to its “5%+ Stockholder Questionnaire” submitted to the Company on August 28, 2017 (providing information as of August 25, 2017), Nantahala Capital Management, LLC may be deemed the beneficial owner of 7,405,166 shares of the Company’s common stock held by funds and separately managed accounts under its control. Messrs. Wilmot B. Harvey and Daniel Mack are control persons in respect of shares beneficially by Nantahala Capital Management, LLC. As managing members of Nantahala Capital Management, LLC, each of Messrs. Harvey and Mack may be deemed a beneficial owner of these shares. Nantahala Capital Partners SI, LP, a fund advised by Nantahala Capital Management, LLC, has delegated voting and investment power for its shares to Nantahala Capital Management, LLC, but has the right to receive or the power to direct the receipt of dividends from, or the proceeds from the sale of, approximately 4.8 million shares of the Company’s common stock. The business address of Nantahala Capital Management, LLC is 19 Old Kings Highway S, Suite 200, Darien, CT 06820. |
| |
(6) | According to Schedules 13G/A filed with the SEC on February 14, 2017 on behalf of Putnam Investments, LLC d/b/a Putnam Investments (“PI”), Putnam Investment Management, LLC (“PIM”) and The Putnam Advisory Company, LLC (“PAC”), PIM and PI hold sole dispositive power with respect to 5,989,860 shares of the Company’s common stock. PI wholly owns two registered investment advisers, PIM, which is the investment adviser to the PI family of mutual funds and PAC, which is the investment adviser to PI’s institutional clients. Both PIM and PAC have dispositive power over the shares as investment managers. In the case of shares held by the PI mutual funds managed by PIM, the mutual funds, through their boards of trustees, have voting power. PAC has sole voting power over the shares held by its institutional clients. The Company has entered into a Voting Rights Waiver Agreement (the “Voting Rights Waiver Agreement”) with PIM pursuant to which PIM and certain other entities and individuals affiliated with PIM and other PI companies (the “Other Putnam Investors”) agreed to waive all voting rights that they may have in respect of any voting securities issued by the Company that exceed, in the aggregate, 4.99% of the total voting rights exercisable by the Company’s outstanding voting securities. The Voting Rights Waiver Agreement provides that any voting rights waived by PI, PIM or the Other Putnam Investors will be apportioned among those parties on a pro rata basis based upon their relative holdings of the Company’s voting securities. The Voting Rights Waiver Agreement will expire at the time that the Other Putnam Investors that are investment companies registered under the Investment Company Act of 1940, as amended, no longer own any of the Company’s voting common stock, at which time the remaining Other Putnam Investors will be entitled to any and all voting rights pertaining to their voting securities. The business address of PIM, PAC and PI is One Post Office Square, Boston, MA 02109. |
| |
(7) | According to a Schedule 13G/A filed with the SEC on February 13, 2015 on behalf of Abrams Capital Partners II, L.P., a Delaware limited partnership (“Abrams II”); Abrams Capital, LLC, a Delaware limited liability company (“Abrams Capital”); Abrams Capital Management, LLC, a Delaware limited liability company (“Abrams CM LLC”); Abrams Capital Management, L.P., a Delaware limited partnership (“Abrams CM LP”); and David Abrams, an individual and a U.S. citizen, Abrams II holds shared voting and shared dispositive power with respect to 4,022,990 shares of the Company’s common stock, Abrams Capital holds shared voting and shared dispositive power with respect to 4,732,160 shares of the Company’s common stock, and each of Abrams CM LLC, Abrams CM LP and Mr. Abrams holds shared voting and shared dispositive power with respect to 5,000,000 shares of the Company’s common stock. The shares of the Company’s common stock over which Abrams Capital holds shared voting and shared dispositive power are beneficially owned by Abrams II and other private investment funds for which Abrams Capital serves as general partner. The shares of the Company’s common stock over which Abrams CM LLC and Abrams CM LP hold shared voting and shared dispositive power include the shares that are beneficially owned by Abrams Capital and shares beneficially owned by another private investment fund for which Abrams CM LP serves as investment manager. Abrams CM LLC is the general partner of Abrams CM LP. The shares of the Company’s common stock over which Mr. Abrams holds shared voting and shared dispositive power include the shares that are beneficially owned by Abrams Capital and Abrams CM LLC. Mr. Abrams is the managing member of Abrams Capital and Abrams CM LLC. The address of this stockholder is c/o Abrams Capital Management, L.P., 222 Berkeley Street, 21st Floor, Boston, MA 02116. |
| |
(8) | According to a Schedule 13G/A filed with the SEC on February 7, 2017 on behalf of Franklin Resources, Inc., a Delaware corporation (“Franklin Resources”), Franklin Advisers, Inc., a California corporation (“Franklin Advisers”), Charles B. Johnson, an individual and a U.S. Citizen, and Rupert H. Johnson, Jr., an individual and a U.S. citizen, Franklin Advisers holds sole voting and sole dispositive power with respect to 4,711,097 shares of the Company’s common stock, and Fiduciary Trust Company International holds sole voting power with respect to 41,200 shares of the Company’s common stock. The 4,752,297 shares of the Company’s common stock reported on the Schedule 13G are beneficially owned by one or more open- or closed-end investment companies or other managed accounts that are investment management clients of investment managers that are direct and indirect subsidiaries of Franklin Resources (the “investment management subsidiaries”). Charles B. Johnson and Rupert H. Johnson, Jr. each own in excess of 10% of the outstanding common stock of Franklin Resources and are the principal stockholders of Franklin Resources. Franklin Resources, Charles B. Johnson and Rupert H. Johnson, Jr. may be deemed to be the beneficial owners of shares of the Company’s common stock held by persons and entities for whom or for which Franklin Resources’ subsidiaries provide investment management services. Franklin Resources, Charles B. Johnson, Rupert H. Johnson, Jr. and the investment management subsidiaries disclaim beneficial ownership of the shares of the Company’s common stock. The business address of Franklin Resources, Franklin Advisers, Charles B. Johnson and Rupert H. Johnson, Jr. is One Franklin Parkway, San Mateo, CA 94403. |
| |
(9) | Includes 658,072 shares of the Company’s common stock that Mr. Adepoju has the right to acquire by exercise of vested stock options and 12,312 shares of the Company’s common stock that Mr. Adepoju will have the right to acquire by exercise of stock options which are scheduled to vest within 60 days of the Beneficial Ownership Table Date. The remaining amount in the table above for Mr. Adepoju represents shares of our common stock held by him. |
| |
(10) | Includes 186,188 shares of the Company’s common stock that Mr. Avellan has the right to acquire by exercise of vested stock options. The remaining amount in the table above for Mr. Avellan represents shares of our common stock held by him. |
| |
(11) | Includes 50,782 shares of the Company’s common stock that Mr. Ballas has the right to acquire by exercise of vested stock options and 5,642 shares of the Company’s common stock that Mr. Ballas will have the right to acquire by exercise of stock options which are scheduled to vest within 60 days of the Beneficial Ownership Table Date. The remaining amount in the table above for Mr. Ballas represents shares of our common stock held by him. |
| |
(12) | Includes 861,861 shares of the Company’s common stock that Mr. Davis has the right to acquire by exercise of vested stock options. The remaining amount in the table above for Mr. Davis represents shares of our common stock held by him. |
| |
(13) | Includes 72,044 shares of the Company’s common stock that Mr. Epstein has the right to acquire by exercise of vested stock options, but excludes (x) 3,685 RSUs that are vested but for which he has deferred the receipt until May 2046 and (y) 5,405 RSUs that are vested but for which Mr. Epstein has deferred the receipt until April 2046. |
| |
(14) | Includes 23,344 shares of the Company’s common stock that Mr. Hasker has the right to acquire by exercise of vested stock options, but excludes (x) 2,764 RSUs that are vested but for which he has deferred the receipt until May 2021 and (y) 5,405 RSUs that are vested but for which he has deferred the receipt until April 2022. |
| |
(15) | Includes 72,044 shares of the Company’s common stock that Mr. Leddy has the right to acquire by exercise of vested stock options, but excludes (x) 3,685 RSUs that are vested but for which he has deferred the receipt until May 2021 and (y) 5,405 RSUs that are vested but for which he has deferred the receipt until April 2022. |
| |
(16) | Includes 72,044 shares of the Company’s common stock that Mr. Reding has the right to acquire by exercise of vested stock options, but excludes (x) 3,685 RSUs that are vested but for which he has deferred the receipt until May 2021 and (y) 5,405 RSUs that are vested but for which he has deferred the receipt until April 2022. |
| |
(17) | Includes 72,044 shares of the Company’s common stock that Mr. Sagansky has the right to acquire by exercise of vested stock options, but excludes (x) 3,685 RSUs that are vested but for which he has deferred the receipt until May 2021 and (y) 5,405 RSUs that are vested but for which he has deferred the receipt until April 2022. The remaining amount in the table above for Mr. Sagansky represents shares of our common stock held by him. |
| |
(18) | Includes 72,044 shares of the Company’s common stock that Mr. Shapiro has the right to acquire by exercise of vested stock options, but excludes 3,685 RSUs that are vested but for which he has deferred the receipt until May 2021. The remaining amount in the table above for Mr. Shapiro represents shares of our common stock held by him. |
| |
(19) | Includes 72,044 shares of the Company’s common stock that Mr. Sloan has the right to acquire by exercise of vested stock options, but excludes (x) 3,685 RSUs that are vested but for which he has deferred the receipt until May 2021 and (y) 5,405 RSUs that are vested but for which he has deferred the receipt until April 2022. The remaining amount in the table above for Mr. Sloan represents shares of our common stock held by him. |
Equity Compensation Plan Information
The following table provides certain information (as of December 31, 2016) with respect to all of our equity compensation plans in effect as of December 31, 2016:
|
| | | | | | | |
Benefit | | Number of securities to be issued upon exercise of outstanding options, warrants and rights | | Weighted-average exercise price of outstanding options | | Number of securities remaining available for future issuance under equity compensation plans (excluding securities reflected in first column) |
Equity Compensation Plans Approved by Stockholders(1) | | 8,602,906(3) | | $10.37(4) | | 1,795,449 |
|
Equity Compensation Plans Not Approved by Stockholders(2) | | 823,700(5) | | 8.03(6) | | — |
|
| |
(1) | Consists of the Global Eagle Entertainment Inc. Amended and Restated 2013 Equity Incentive Plan. |
| |
(2) | Consists of the Global Eagle Entertainment Inc. 2016 Inducement and Retention Stock Plan for EMC Employees. See Note 13. Common Stock, Stock-Based Awards and Warrants to our consolidated financial statements in this Form 10-K for more information regarding this plan. We do not plan to issue any further shares under this plan. |
| |
(3) | Consists of 1,880,256 unvested RSU awards (of which 235,188 constitute PSU awards) and 6,722,650 stock option awards outstanding as of December 31, 2016. |
| |
(4) | Based on 6,722,650 stock option awards outstanding as of December 31, 2016. |
| |
(5) | Consists of 331,650 RSU awards and 492,050 stock option awards outstanding as of December 31, 2016. |
| |
(6) | All stock options under the Global Eagle Entertainment Inc. 2016 Inducement and Retention Stock Plan for EMC Employees were granted at this exercise price. |
ITEM 13. CERTAIN RELATIONSHIPS AND RELATED TRANSACTIONS AND DIRECTOR INDEPENDENCE
Related Party Transactions Policy
Our Audit Committee has adopted a Related Party Transactions Policy that sets forth the policies and procedures for the review and approval or ratification of “related party transactions.” A “related party transaction” is any consummated or proposed transaction (including, but not limited to, a financial transaction, arrangement or relationship, and including any indebtedness or guarantee of indebtedness) or series of similar transactions: (i) in which the Company was or is to be a participant; (ii) the amount of which exceeds (or is reasonably expected to exceed) $120,000 in the aggregate over the duration of the transaction (without regard to profit or loss); and (iii) in which the “Related Party” had, has or will have a direct or indirect material interest.
Pursuant to our Related Party Transactions Policy, our Audit Committee considers (i) the relevant facts and circumstances of each related party transaction, including if the transaction is on terms comparable to those that could be obtained in arm’s-length dealings with an unrelated third party, (ii) the extent of the related party’s interest in the transaction, (iii) whether the transaction contravenes our Code of Ethics, Conflicts of Interest Policy or other policies, (iv) whether the relationship underlying the transaction is believed to be in the best interests of the Company and its stockholders and (v) the effect that the transaction may have on a director’s status as an independent member of our Board and eligibility to serve on our Board’s committees. Management presents to our Audit Committee each proposed related party transaction, including all relevant facts and circumstances relating thereto. Related party transactions may only be consummated if our Audit Committee has approved or ratified the transaction in accordance with the guidelines set forth in the Policy. No director or executive officer will be permitted to participate in the discussion of, or decision concerning, a related person transaction for which he or she is the related party.
Related Party Transactions
During 2016, the Company did not participate in any related party transactions, other than as described below.
Transactions with TRIO Connect, LLC and its Affiliates
In July 2015, EMC divested its interest in TRIO Connect, LLC (“TRIO”), one of EMC’s joint ventures formed to commercialize EMC’s ARABSAT Ka-Band contract, such that following the divestiture EMC no longer had any ownership interest in TRIO and TRIO was instead owned by funds affiliated with ABRY Partners, Abel Avellan (our former President & Chief Strategy Officer) and EMC’s other former stockholders. We did not acquire the TRIO business in connection with our acquisition of EMC.
Prior to the Company’s acquisition of the EMC business, EMC and its subsidiaries had collectively made various loans to TRIO and its affiliated entities over time in an aggregate amount equal to approximately $6.5 million. Also prior to the EMC acquisition, STMEA (FZE), a wholly-owned subsidiary of TRIO, had made sales of equipment and provided employee payroll services to EMC and its subsidiaries in an aggregate amount equal to approximately $5.7 million. After netting the outstanding trade payables for the equipment sales and payroll services against the outstanding loan amounts, TRIO and its affiliates collectively owed EMC and its subsidiaries approximately $800,000 in July 2016 at the time we acquired EMC, and we inherited this receivable in the acquisition. We did not pay any purchase-price consideration for the receivable; neither we nor EMC’s sellers took it into account when calculating the working capital that we received at the EMC closing; and EMC had already fully impaired its carrying value prior to our acquisition. We believe that the receivable is now uncollectible, and as such expect to forgive it in in full in the near future.
Immediately following the EMC Acquisition, EMC’s employees in the UAE were housed and employed by TRIO’s UAE entity. Because EMC did not have its own entity in UAE at the time the Company acquired EMC, the Company (through EMC) entered into a transition services agreement with TRIO whereby TRIO would continue to employ the UAE employees for the Company’s benefit—and “second” them to the Company at cost—until the Company formed its own licensed UAE subsidiary. For the three-month period (July 2016 to October 2016) following the EMC Acquisition, the Company paid to TRIO approximately $645,000 for payroll and related services and expenses for the “seconded” employees. The Company did not pay any further amounts under the transition services agreement after October 2016.
Between October 2016 and August 2017, we made payments to TRIO totaling $385,000 for equipment purchases and service fees in connection with various customer contracts. In September 2017, we made additional equipment purchases totaling $425,000 for customer orders and for inventory purposes. All of these purchase transactions were on arms’-length pricing and terms.
ABRY Board Nomination Right
ABRY Partners VII, L.P. (“ABRY”), through its affiliate EMC HoldCo 2 B.V., has the right under a nomination letter agreement (the “ABRY Nomination Agreement”) that we entered into in connection with the EMC Acquisition to nominate one individual for election to our Board. This right terminates when (i) ABRY holds less than 5% of our outstanding common stock, (ii) ABRY or its affiliates consummate a transaction involving a company or business that competes with any business then engaged in (or contemplated to be engaged in) by us, (iii) any partner, member or employee of ABRY or any of its affiliates becomes a director, board observer or executive officer of any competitor of ours, (iv) we sell all or substantially all of our assets, (v) we participate in a merger, consolidation or similar transaction in which our stockholders immediately prior to the consummation of the transaction hold less than 50% of all of the outstanding common stock or other securities entitled to vote for the election of directors of the surviving entity in such transaction or (vi) ABRY gives written notice to us that it desires to terminate its nomination right. The ABRY Nomination Agreement also requires that, subject to exceptions, ABRY and its affiliates will be subject to a “standstill” provision. This provision prohibits ABRY and its affiliates from taking actions to influence or control us (including by acquiring additional securities) until six months after the termination of ABRY’s nomination right.
masFlight Earnout Payments
In connection with our acquisition of the masFlight business on August 4, 2015 (the “masFlight Closing Date”), the Company agreed that if, prior to the second anniversary of the masFlight Closing Date, the Company terminated Joshua Marks without “cause” or he resigned with “good reason” (as such terms are defined in the masFlight purchase agreement), earnout payments in an aggregate amount equal to $10 million would be accelerated and become immediately due and payable to Mr. Marks and the other masFlight sellers. The Company did not terminate Mr. Marks prior to this date, and so Mr. Marks’ acceleration right is no longer applicable. The Company entered into the masFlight acquisition agreements prior to Mr. Marks becoming an executive officer of our Company.
Lumexis Loan Agreement
On February 24, 2016, we entered into a loan agreement (the “Lumexis Loan Agreement”) with Lumexis Corporation, a company that provided in-flight entertainment systems to airlines (“Lumexis”). Lumexis was at the time controlled by PAR Investment Partners, L.P., or PAR. (PAR was at the time and remains our largest stockholder, holding approximately 31.9% of our outstanding common stock as of October 31, 2017.) At the time the Company entered into the Lumexis Loan Agreement, Mr. Shapiro, our Board Chair, was a Managing Partner of PAR and a member of Lumexis’s board of directors. The Lumexis Loan Agreement provided for senior secured extensions of credit by us to Lumexis of up to $5,000,000, bearing an annual interest rate of 15% with a maturity date of December 31, 2016. After due consideration, our Board determined that it was appropriate and in the best interests of the Company and its stockholders to enter into the Lumexis Loan Agreement given (x) Lumexis’s position as a key supplier to flydubai, one of our connectivity customers, (y) Lumexis’s position as a key supplier to another potential connectivity customer of our company, and (z) Lumexis’s future M&A prospects. Our Board further determined that the parties’ relationships did not give rise to any material conflict of interest (including for our Board Chair) in entering into the Lumexis Loan Agreement. Our Board Chair recused himself from the Board’s decision to approve the transaction.
In June 2016, Lumexis notified the Company that Lumexis had become insolvent and that its M&A prospects were no longer likely. On December 5, 2016, the Company and Lumexis entered into a Partial Cancellation of Debt and Acceptance of Collateral, pursuant to which Lumexis transferred its rights and title to specified content integration equipment to the Company in partial satisfaction of the amounts owed under the Loan Agreement. On January 5, 2017, at a public auction of Lumexis’s assets, the Company credit bid on, and purchased, substantially all of Lumexis’s remaining assets. We continue to hold a note receivable from Lumexis but we do not anticipate any further value in its collateral or any opportunity to collect on that note.
Registration Rights Agreement
In connection with the closing of our business combination in January 2013 with Row 44 and Advanced Inflight Alliance AG, we entered into an amended and restated registration rights agreement, dated January 31, 2013 by and among the Company, Global Eagle Acquisition LLC (the “Sponsor”), Par Investment Partners, L.P. (“PAR”), Putnam Capital Spectrum Fund and Putnam Equity Spectrum Fund, and the members of the Sponsor signatory thereto, including our Board members Harry E. Sloan and Jeff Sagansky, pursuant to which the parties thereto obtained the right to cause the Company to register the resale of certain securities
held by them (the “registrable securities”) and to sell such registrable securities pursuant to an effective registration statement in a variety of manners, including in underwritten offerings, all on the terms and conditions set forth therein. We are required under the terms of the amended and restated registration rights agreement to pay the securityholders’ expenses in connection with the exercise of these rights.
Director Independence
Pursuant to Nasdaq Listing Rules, a majority of the members of our Board must qualify as “independent,” as affirmatively determined by our Board. Consistent with this requirement, our Board and Governance Committee reviewed all relevant identified transactions and relationships between each of our directors, or any of their family members, and us, our senior management and our independent registered public accounting firm. Our Board – based on the review and recommendation of our Governance Committee – affirmatively determined that each of our current directors (other than Mr. Leddy, who is our CEO and an employee director) meets the standards of independence under applicable Nasdaq Listing Rules. In making this determination, our Board found all of our directors (other than Mr. Leddy) to be free of any relationship that would impair his individual exercise of independent judgment with regard to the Company. Our Board also determined that each member of its Audit Committee, Compensation Committee and Governance Committee is independent under Nasdaq Listing Rule 5605.
ITEM 14. PRINCIPAL ACCOUNTANT FEES AND SERVICES
Independent Registered Public Accounting Firm Fees
The following table shows the fees billed for professional services rendered by our independent registered public accounting firm, Ernst & Young LLP (“EY”), for the audit of the Company’s annual consolidated financial statements for the years ended December 31, 2016 and 2015, and fees billed for other services rendered by EY during those years.
|
| | | | | | | | |
| | Year Ended December 31, |
| | 2016 | | 2015 |
Audit fees(1) | | $ | 18,685,000 |
| | $ | 3,886,000 |
|
Audit-related fees(2) | | 1,166,000 |
| | — |
|
Tax fees(3) | | 438,000 |
| | 353,000 |
|
All other fees(4) | | 2,000 |
| | 2,000 |
|
Total fees | | $ | 20,291,000 |
| | $ | 4,241,000 |
|
| |
(1) | Audit fees consist of fees associated with the annual audit, the reviews of our quarterly reports on Form 10-Q, statutory audits required internationally and fees related to registration statements. |
| |
(2) | Audit-related fees consist of fees for professional services for assurance and related services that are reasonably related to the performance of the audit or review of our financial statements and are not reported under “Audit fees.” These services include accounting consultations concerning financial accounting and reporting standards. |
| |
(3) | Tax fees consist of fees for tax compliance, tax advice and tax planning. |
| |
(4) | All other fees consist of permitted services other than those that meet the criteria described above and are related to risk management advisory services and the Company’s subscription to an EY online service used for accounting research purposes. |
All fees described above were pre-approved by the Audit Committee or our Audit Committee Chair in accordance with our Audit Committee’s Pre-Approval Policy discussed in the immediately following subsection.
Pre-Approval Policy
The Audit Committee has adopted an Audit Committee Pre-Approval Policy addressing the pre-approval by the Audit Committee or its members of audit and non-audit services rendered by our independent registered public accounting firm. The policy generally requires pre-approval of specified services in the defined categories of audit services, audit-related services and tax services. Pre-approval may also be given as part of the Audit Committee’s approval of the scope of the engagement of the independent registered public accounting firm or on an individual, explicit, case-by-case basis before the independent registered public accounting firm is engaged to provide each service. The pre-approval of services may be delegated to one or more of the Audit Committee’s members, but the decision must be reported to the full Audit Committee at its next regularly-scheduled meeting.
The Audit Committee has determined that the rendering of the services other than audit services by EY was compatible with maintaining the principal accountant’s independence.
PART IV
ITEM 15. EXHIBITS AND FINANCIAL STATEMENT SCHEDULES
(a)(1). Financial Statements
(a)(2). Financial Statement Schedules
All financial statement schedules have been omitted, since they are not applicable, not required, or the information required has been otherwise supplied in our consolidated financial statements or notes thereto included in this Form 10-K.
(a)(3). Exhibits
EXHIBIT INDEX
|
| | | | | | | | | | | | |
| | | | Incorporated by Reference |
Exhibit No. | | Exhibit Index | | Form | | SEC File No. | | Exhibit | | Filing Date | | Filed Herewith |
2.1 | | | | 10-Q | | 001-35176 | | 10.2 | | 11/14/2012 | | |
2.2 | | | | 8-K | | 001-35176 | | 10.2 | | 11/14/2012 | | |
2.3 | | | | 8-K | | 001-35176 | | 2.1 | | 7/10/2013 | | |
2.4 | | | | 8-K | | 001-35176 | | 2.2 | | 7/10/2013 | | |
2.5 | | | | 8-K | | 001-35176 | | 2.1 | | 10/18/2013 | | |
2.6 | | | | 8-K | | 001-35176 | | 2.1 | | 5/13/2016 | | |
2.7 | | Investment Agreement, dated as of November 8, 2016, by and among the Company and Shareco Group of America, Inc., and for limited purposes set forth therein, HNA Group Co., Ltd., Beijing Shareco Technologies Co., Ltd. and, upon entering into a joinder thereto, Bluefocus (Beijing) Investment Management Co., Ltd. | | 8-K | | 001-35176 | | 2.1 | | 11/14/2016 | | |
2.8 | | | | 8-K | | 001-35176 | | 2.2 | | 11/14/2016 | | |
2.9 | | Stage 2 Letter Agreement, dated as of November 8, 2016, by and among the Company, Shareco Group of America, Inc., HNA Group Co., Ltd., Beijing Shareco Technologies Co., Ltd. and PAR Investment Partners, L.P. | | 8-K | | 001-35176 | | 2.3 | | 11/14/2016 | | |
3.1 | | | | 8-K | | 001-35176 | | 3.1 | | 2/6/2013 | | |
3.2 | | | | 8-K | | 001-35176 | | 3.1 | | 9/23/2016 | | |
4.1 | | | | S-1/A#4 | | 333-172267 | | 4.2 | | 5/11/2011 | | |
4.2 | | | | S-1/A#2 | | 333-172267 | | 4.4 | | 4/6/2011 | | |
4.3 | | | | S-1/A | | 333-172267 | | 4.3 | | 4/6/2011 | | |
4.4 | | | | 8-K | | 001-35176 | | 4.1 | | 2/19/2015 | | |
4.5 | | | | S-3 | | 333-214065 | | 4.5 | | 10/11/2016 | | |
4.6 | | | | S-3 | | 333-214065 | | 4.5(B) | | 10/11/2016 | | |
10.1 | | | | 8-K | | 001-35176 | | 10.1 | | 1/12/2017 | | |
10.2 | | | | 8-K | | 001-35176 | | 10.1 | | 5/5/2017 | | |
10.3 | | | | 8-K | | 001-35176 | | 10.1 | | 6/30/2017 | | |
10.4 | | | | 8-K | | 001-35176 | | 10.1 | | 9/14/17 | | |
10.5 | | | | 8-K | | 001-35176 | | 10.1 | | 10/3/2017 | | |
10.6 | | | | 8-K | | 001-35176 | | 10.1 | | 10/12/2017 | | |
10.7 | | | | 8-K | | 001-35176 | | 10.1 | | 11/1/2017 | | |
10.8 | | | | 8-K | | 001-35176 | | 10.1 | | 11/16/2017 | | |
10.9 | | | | 8-K | | 001-35176 | | 10.2 | | 1/12/2017 | | |
10.10 | | First Lien Credit Agreement, dated as of July 1, 2015, as amended by Amendment No. 1 to First Lien Credit Agreement, dated as of May 9, 2016, by and among EMC Acquisition, LLC, Emerging Markets Communications, LLC, Morgan Stanley Senior Funding, Inc., as the Administrative Agent, the guarantors party thereto and the lenders from time to time party thereto. | | 8-K | | 001-35176 | | 10.1 | | 8/2/2016 | | |
10.11 | | | | 8-K | | 001-35176 | | 10.2 | | 8/2/2016 | | |
10.12 | | | | 8-K | | 001-35176 | | 10.3 | | 8/2/2016 | | |
10.13 | | First Lien Security Agreement, dated as of July 1, 2015, as amended by Amendment No. 1 to the First Lien Security Agreement, dated as of May 9, 2016, as further supplemented by that First Lien Security Agreement Supplement, dated as of July 27, 2016, made by the Company, and each entity listed on Schedule 1 thereto, by and among the grantors party thereto and Morgan Stanley Senior Funding, Inc., as the Administrative Agent. | | 10-Q | | 001-35176 | | 10.4 | | 8/9/2016 | | |
10.14 | | Second Lien Credit Agreement dated as of July 1, 2015, as amended by Amendment No. 1 to Second Lien Credit Agreement, dated as of May 9, 2016, by and among the Emerging Markets Communications, LLC, EMC Acquisition, LLC, and the other Guarantors party thereto, Morgan Stanley Senior Funding, Inc., as the Administrative Agent, the guarantors party thereto and the lenders from time to time party thereto. | | 10-Q | | 001-35176 | | 10.5 | | 8/9/2016 | | |
10.15 | | | | 8-K | | 001-35176 | | 10.6 | | 8/2/2016 | | |
10.16 | | | | 8-K | | 001-35176 | | 10.7 | | 8/2/2016 | | |
10.17 | | Second Lien Security Agreement, dated as of July 1, 2015, as amended by Amendment No. 1 to the Second Lien Security Agreement, dated as of May 9, 2016, as further supplemented by the Second Lien Security Agreement Supplement, dated as of July 27, 2016 made by the Company, and each entity listed on Schedule 1 thereto, by and among the grantors party thereto and Morgan Stanley Senior Funding, Inc., as the Administrative Agent. | | 10-Q | | 001-35176 | | 10.8 | | 8/9/2016 | | |
10.18 | | Intercreditor Agreement, dated July 1, 2015, as amended by Amendment No. 1 to the Intercreditor Agreement, dated July 27, 2016, by and between Morgan Stanley Senior Funding, Inc., as First Lien Credit Agreement Administrative Agent and Morgan Stanley Senior Funding, Inc., as Second Lien Credit Agreement Administrative Agent. | | 8-K | | 001-35176 | | 10.9 | | 8/2/2016 | | |
10.19 | | | | 8-K | | 001-35176 | | 10.10 | | 8/2/2016 | | |
10.20+ | | OEM Purchase and Development Agreement, dated October 12, 2009, by and between TECOM Industries, Inc. and Row 44, Inc., as amended on December 19, 2011, December 23, 2011, January 6, 2012 and January 18, 2012. | | 8-K/A#2 | | 001-35176 | | 10.8 | | 5/16/2013 | | |
10.21+ | | | | 8-K | | 001-35176 | | 10.1 | | 12/13/2016 | | |
10.22 | | | | 8-K | | 001-35176 | | 10.1 | | 2/6/2013 | | |
10.23 | | | | 8-K | | 001-35176 | | 10.4 | | 10/21/2013 | | |
10.24 | | | | 8-K | | 001-35176 | | 10.11 | | 8/2/2016 | | |
10.25 | | | | 8-K | | 001-35176 | | 10.5 | | 10/21/2013 | | |
10.26 | | | | 8-K/A | | 001-35176 | | 10.1 | | 5/16/2016 | | |
10.27*+ | | | | 10-Q | | 001-35176 | | 10.8 | | 5/8/2015 | | |
10.28* | | | | DEF-14A | | 001-35176 | | Annex A | | 4/29/2016 | | |
10.29* | | | | | | | | | | | | X |
10.30* | | | | 8-K | | 001-35176 | | 10.13 | | 8/2/2016 | | |
10.31* | | | | | | | | | | | | X |
10.32* | | | | 8-K | | 001-35176 | | 10.2 | | 12/24/2013 | | |
10.33* | | | | 8-K | | 001-35176 | | 10.3 | | 12/24/2013 | | |
10.34* | | | | 8-K | | 001-35176 | | 10.4 | | 12/24/2013 | | |
10.35* | | | | 10-Q | | 001-35176 | | 10.6 | | 5/8/2015 | | |
10.36* | | | | 10-Q | | 001-35176 | | 10.7 | | 5/8/2015 | | |
10.37* | | | | 8-K | | 001-35176 | | 10.14 | | 8/2/2016 | | |
10.38* | | | | 8-K | | 001-35176 | | 10.15 | | 8/2/2016 | | |
10.39* | | | | 8-K | | 001-35176 | | 10.16 | | 8/2/2016 | | |
10.40* | | | | 8-K | | 001-35176 | | 10.1 | | 10/17/2016 | | |
10.41* | | | | 10-Q | | 001-35176 | | 10.5 | | 11/9/2016 | | |
10.42* | | | | 10-Q | | 001-35176 | | 10.6 | | 11/9/2016 | | |
10.43* | | | | 8-K | | 001-35176 | | 10.3 | | 7/15/2014 | | |
10.44* | | | | 8-K | | 001-35176 | | 10.1 | | 4/16/2015 | | |
10.45* | | | | 10-K | | 001-35176 | | 10.30 | | 3/17/2016 | | |
10.46* | | | | 8-K | | 001-35176 | | 10.2 | | 2/21/2017 | | |
10.47* | | | | 8-K | | 001-35176 | | 10.3 | | 2/21/2017 | | |
10.48* | | | | 8-K | | 001-35176 | | 10.1 | | 11/6/2014 | | |
10.49* | | | | 10-Q | | 001-35176 | | 10.5 | | 5/8/2015 | | |
10.50* | | | | 10-K | | 001-35176 | | 10.41 | | 3/17/2016 | | |
10.51* | | | | 10-K | | 001-35176 | | 10.42 | | 3/17/2016 | | |
10.52* | | | | 10-K | | 001-35176 | | 10.43 | | 3/17/2016 | | |
10.53* | | | | 10-Q | | 001-35176 | | 10.1 | | 5/9/2016 | | |
10.54* | | | | 10-Q | | 001-35176 | | 10.2 | | 5/9/2016 | | |
10.55* | | | | 8-K | | 001-35176 | | 10.12 | | 8/2/2016 | | |
10.56* | | | | 8-K | | 001-35176 | | 10.1 | | 4/24/2017 | | |
10.57* | | | | 10-Q | | 001-35176 | | 10.17 | | 8/9/2016 | | |
10.58* | | | | 10-Q | | 001-35176 | | 10.18 | | 8/9/2016 | | |
10.59* | | | | 10-Q | | 001-35176 | | 10.19 | | 8/9/2016 | | |
10.60* | | | | | | | | | | | | X |
10.61* | | | | 10-Q | | 001-35176 | | 10.20 | | 8/9/2016 | | |
10.62* | | | | 8-K | | 001-35176 | | 10.1 | | 8/26/2016 | | |
10.63* | | | | 8-K | | 001-35176 | | 10.4 | | 2/21/2017 | | |
10.64* | | | | 8-K | | 001-35176 | | 10.1(C) | | 8/26/2016 | | |
10.65* | | | | 8-K | | 001-35176 | | 10.3 | | 8/26/2016 | | |
10.66* | | | | 8-K | | 001-35176 | | 10.1 | | 11/3/2016 | | |
10.67* | | | | | | | | | | | | X |
10.68* | | | | 8-K | | 001-35176 | | 10.1 | | 11/16/2016 | | |
10.69* | | | | 8-K | | 001-35176 | | 10.2 | | 11/16/2016 | | |
10.70* | | | | 8-K | | 001-35176 | | 10.1 | | 5/2/2017 | | |
10.71* | | | | 8-K | | 001-35176 | | 10.1 | | 2/21/2017 | | |
10.72* | | | | 8-K | | 001-35176 | | 10.1 | | 4/7/2017 | | |
10.73* | | | | 8-K | | 001-35176 | | 10.1 | | 5/11/2017 | | |
10.74* | | | | 10-Q | | 001-35176 | | 10.8 | | 11/9/2016 | | |
10.75* | | | | 8-K | | 001-35176 | | 10.2 | | 4/7/2017 | | |
10.76* | | | | 8-K | | 001-35176 | | 10.3 | | 4/7/2017 | | |
10.77+ | | Limited Liability Company Agreement of Wireless Maritime Services, LLC, dated as of February 19, 2004, by and between AT&T Wireless Services, Inc. and Maritime Telecommunications Network, Inc., as amended on January 26, 2005, May 18, 2005, February 27, 2006, March 16, 2006, September 30, 2010, and July 2012. | | | | | | | | | | X |
21 | | | | | | | | | | | | X |
23.1 | | | | | | | | | | | | X |
24 | | | | | | | | | | | | X |
31.1 | | | | | | | | | | | | X |
31.2 | | | | | | | | | | | | X |
32.1 | | | | | | | | | | | | X |
32.2 | | | | | | | | | | | | X |
99.1 | | | | | | | | | | | | X |
101.INS | | XBRL Instance Document | | | | | | | | | | X |
101.PRE | | XBRL Taxonomy Extension Presentation Linkbase Document | | | | | | | | | | X |
101.SCH | | XBRL Taxonomy Extension Schema Document | | | | | | | | | | X |
101.CAL | | XBRL Taxonomy Extension Calculation Linkbase Document | | | | | | | | | | X |
101.DEF | | XBRL Taxonomy Extension Definition Linkbase Document | | | | | | | | | | X |
101.LAB | | XBRL Taxonomy Extension Label Linkbase Document | | | | | | | | | | X |
* | | Management contract or compensatory plan or arrangement. | | | | | | | | | | |
+ | | Confidential treatment has been requested or granted for certain portions omitted from this Exhibit pursuant to Rule 24b-2 under the Securities Exchange Act of 1934, as amended. | | | | | | | | | | |
SIGNATURES
Pursuant to the requirements of Section 13 or 15(d) of the Securities Exchange Act of 1934, the registrant has duly caused this report to be signed on its behalf by the undersigned, thereunto duly authorized on November 17, 2017.
|
| | |
| GLOBAL EAGLE ENTERTAINMENT INC. |
| | |
| By: | /s/ PAUL RAINEY |
| | Paul Rainey |
| | Chief Financial Officer |
| | (Principal Financial Officer) |
POWER OF ATTORNEY
The undersigned directors and officers of Global Eagle Entertainment Inc. hereby constitute and appoint each of Jeffrey A. Leddy, Paul Rainey and Stephen Ballas, with the power to act without the others and with full power of substitution and resubstitution, our true and lawful attorney-in-fact and agent with full power to execute in our name and behalf in the capacities indicated below any and all amendments to this report and to file the same, with all exhibits and other documents relating thereto and hereby ratify and confirm all that such attorney-in-fact, or such attorney-in-fact’s substitute, may lawfully do or cause to be done by virtue hereof.
Pursuant to the requirements of the Securities Exchange Act of 1934, this report has been signed below by the following persons in the capacities and on the dates indicated below.
|
| | | | |
Signature | | Title | | Date |
| | | | |
/s/ JEFFREY A. LEDDY | | Chief Executive Officer and Director | | November 17, 2017 |
Jeffrey A. Leddy | | (Principal Executive Officer) | | |
| | | | |
/s/ PAUL RAINEY | | Chief Financial Officer | | November 17, 2017 |
Paul Rainey | | (Principal Financial Officer) | | |
| | | | |
/s/ SARLINA SEE | | Chief Accounting Officer | | November 17, 2017 |
Sarlina See | | (Principal Accounting Officer) | | |
| | | | |
/s/ EDWARD L. SHAPIRO | | Chairman of the Board of Directors | | November 17, 2017 |
Edward L. Shapiro | | | | |
| | | | |
/s/ STEPHEN HASKER | | Director | | November 17, 2017 |
Stephen Hasker | | | | |
| | | | |
/s/ HARRY E. SLOAN | | Director | | November 17, 2017 |
Harry E. Sloan | | | | |
| | | | |
/s/ JEFF SAGANSKY | | Director | | November 17, 2017 |
Jeff Sagansky | | | | |
| | | | |
/s/ JEFFREY E. EPSTEIN | | Director | | November 17, 2017 |
Jeffrey E. Epstein | | | | |
| | | | |
/s/ ROBERT W. REDING | | Director | | November 17, 2017 |
Robert W. Reding | | | | |
| | | | |
/s/ RONALD STEGER | | Director | | November 17, 2017 |
Ronald Steger | | | | |
REPORT OF INDEPENDENT REGISTERED PUBLIC ACCOUNTING FIRM
The Board of Directors and Stockholders of Global Eagle Entertainment Inc.
We have audited the accompanying consolidated balance sheets of Global Eagle Entertainment Inc. as of December 31, 2016 and 2015, and the related consolidated statements of operations, comprehensive loss, stockholders’ equity and cash flows for each of the three years in the period ended December 31, 2016. These financial statements are the responsibility of the Company’s management. Our responsibility is to express an opinion on these financial statements based on our audits.
We conducted our audits in accordance with the standards of the Public Company Accounting Oversight Board (United States). Those standards require that we plan and perform the audit to obtain reasonable assurance about whether the financial statements are free of material misstatement. An audit includes examining, on a test basis, evidence supporting the amounts and disclosures in the financial statements. An audit also includes assessing the accounting principles used and significant estimates made by management, as well as evaluating the overall financial statement presentation. We believe that our audits provide a reasonable basis for our opinion.
In our opinion, the financial statements referred to above present fairly, in all material respects, the consolidated financial position of Global Eagle Entertainment Inc. at December 31, 2016 and 2015, and the consolidated results of its operations and its cash flows for each of the three years in the period ended December 31, 2016, in conformity with U.S. generally accepted accounting principles.
We also have audited, in accordance with the standards of the Public Company Accounting Oversight Board (United States), Global Eagle Entertainment Inc.’s internal control over financial reporting as of December 31, 2016, based on criteria established in Internal Control-Integrated Framework issued by the Committee of Sponsoring Organizations of the Treadway Commission (2013 framework) and our report dated November 17, 2017 expressed an adverse opinion thereon.
/s/ Ernst & Young LLP
Los Angeles, California
November 17, 2017
GLOBAL EAGLE ENTERTAINMENT INC.
CONSOLIDATED BALANCE SHEETS
(In thousands, except share and per share amounts)
|
| | | | | | | |
| December 31, |
| 2016 | | 2015 |
ASSETS | | | |
CURRENT ASSETS: | | | |
Cash and cash equivalents | $ | 50,686 |
| | $ | 223,552 |
|
Restricted cash | 17,992 |
| | 2,285 |
|
Accounts receivable, net | 120,492 |
| | 93,449 |
|
Inventories | 25,986 |
| | 14,998 |
|
Prepaid expenses | 17,658 |
| | 8,389 |
|
Other current assets | 20,786 |
| | 16,535 |
|
TOTAL CURRENT ASSETS: | 253,600 |
| | 359,208 |
|
Content library | 21,470 |
| | 16,083 |
|
Property, plant and equipment, net | 166,049 |
| | 39,066 |
|
Goodwill | 327,836 |
| | 93,796 |
|
Intangible assets, net | 166,720 |
| | 117,684 |
|
Equity method investments | 156,527 |
| | — |
|
Other non-current assets | 7,233 |
| | 12,024 |
|
TOTAL ASSETS | $ | 1,099,435 |
| | $ | 637,861 |
|
| | | |
LIABILITIES AND STOCKHOLDERS’ EQUITY | | | |
CURRENT LIABILITIES: | | | |
Accounts payable and accrued liabilities | $ | 240,344 |
| | $ | 118,224 |
|
Deferred revenue | 6,970 |
| | 10,449 |
|
Warrant liabilities | 433 |
| | 24,076 |
|
Current portion of long-term debt | 2,069 |
| | 1,055 |
|
Other current liabilities | 11,321 |
| | 12,111 |
|
TOTAL CURRENT LIABILITIES: | 261,137 |
| | 165,915 |
|
Deferred revenue, non-current | 1,536 |
| | 6,345 |
|
Long-term debt | 468,231 |
| | 70,099 |
|
Deferred tax liabilities | 33,205 |
| | 22,324 |
|
Other non-current liabilities | 36,329 |
| | 19,417 |
|
TOTAL LIABILITIES | 800,438 |
| | 284,100 |
|
| | | |
COMMITMENTS AND CONTINGENCIES |
| |
|
| | | |
STOCKHOLDERS' EQUITY: | | | |
Preferred stock, $0.0001 par value; 1,000,000 shares authorized, 0 shares issued and outstanding at December 31, 2016 and 2015, respectively | — |
| | — |
|
Common stock, $0.0001 par value; 375,000,000 shares authorized, 88,482,745 and 81,676,390 shares issued, 85,429,111 and 78,622,756 shares outstanding, at December 31, 2016 and 2015, respectively | 9 |
| | 8 |
|
Treasury stock, 3,053,634 shares at December 31, 2016 and 2015 | (30,659 | ) | | (30,659 | ) |
Additional paid-in capital | 747,005 |
| | 688,696 |
|
Subscriptions receivable | (553 | ) | | (528 | ) |
Accumulated deficit | (416,389 | ) | | (303,457 | ) |
Accumulated other comprehensive loss | (416 | ) | | (299 | ) |
TOTAL STOCKHOLDERS' EQUITY | 298,997 |
| | 353,761 |
|
TOTAL LIABILITIES AND STOCKHOLDERS’ EQUITY | $ | 1,099,435 |
| | $ | 637,861 |
|
The accompanying notes are an integral part of these consolidated financial statements.
GLOBAL EAGLE ENTERTAINMENT INC.
CONSOLIDATED STATEMENTS OF OPERATIONS
(In thousands, except per share amounts)
|
| | | | | | | | | | | |
| Year Ended December 31, |
| 2016 | | 2015 | | 2014 |
Revenue: | | | | | |
Licensing | $ | 261,912 |
| | $ | 252,775 |
| | $ | 231,521 |
|
Services | 234,623 |
| | 152,204 |
| | 120,707 |
|
Equipment | 33,220 |
| | 21,051 |
| | 35,507 |
|
Total revenue | 529,755 |
| | 426,030 |
| | 387,735 |
|
Operating expenses: | | | | | |
Cost of sales: | | | | | |
Licensing and services | 336,702 |
| | 261,635 |
| | 249,878 |
|
Equipment | 28,768 |
| | 17,521 |
| | 31,995 |
|
Total cost of sales | 365,470 |
| | 279,156 |
| | 281,873 |
|
Sales and marketing | 30,941 |
| | 17,705 |
| | 13,287 |
|
Product development | 37,718 |
| | 28,610 |
| | 23,010 |
|
General and administrative | 115,195 |
| | 77,715 |
| | 69,743 |
|
Provision for legal settlements | 43,446 |
| | 4,250 |
| | 8,030 |
|
Amortization of intangible assets | 35,648 |
| | 26,994 |
| | 24,552 |
|
Goodwill impairment | 64,000 |
| | — |
| | — |
|
Restructuring charges | — |
| | 411 |
| | 4,223 |
|
Total operating expenses | 692,418 |
| | 434,841 |
| | 424,718 |
|
Loss from operations | (162,663 | ) | | (8,811 | ) | | (36,983 | ) |
Other income (expense): | | | | | |
Interest (expense) income, net | (18,198 | ) | | (2,492 | ) | | 88 |
|
Income (loss) from equity method investments | 3,829 |
| | — |
| | (1,500 | ) |
Change in fair value of derivatives | 25,515 |
| | 11,938 |
| | (6,955 | ) |
Other expense, net | (6,326 | ) | | (1,140 | ) | | (1,270 | ) |
Loss before income taxes | (157,843 | ) | | (505 | ) | | (46,620 | ) |
Income tax (benefit) expense | (44,911 | ) | | 1,621 |
| | 10,574 |
|
Net loss | (112,932 | ) | | (2,126 | ) | | (57,194 | ) |
Net income attributable to non-controlling interest | — |
| | — |
| | 194 |
|
Net loss attributable to Global Eagle Entertainment Inc. common stockholders | $ | (112,932 | ) | | $ | (2,126 | ) | | $ | (57,388 | ) |
| | | | | |
Net loss per share: | | | | | |
Basic | $ | (1.39 | ) | | $ | (0.03 | ) | | $ | (0.78 | ) |
Diluted | $ | (1.39 | ) | | $ | (0.18 | ) | | $ | (0.78 | ) |
| | | | | |
Weighted average shares outstanding: | | | | | |
Basic | 81,269 |
| | 77,558 |
| | 73,300 |
|
Diluted | 81,269 |
| | 78,394 |
| | 73,300 |
|
The accompanying notes are an integral part of these consolidated financial statements.
GLOBAL EAGLE ENTERTAINMENT INC.
CONSOLIDATED STATEMENTS OF COMPREHENSIVE LOSS
(In thousands)
|
| | | | | | | | | | | |
| Year Ended December 31, |
| 2016 | | 2015 | | 2014 |
Net loss | $ | (112,932 | ) | | $ | (2,126 | ) | | $ | (57,194 | ) |
Other comprehensive (loss) income, net of tax: | | | | | |
Unrealized foreign currency translation adjustments | (117 | ) | | (303 | ) | | 4 |
|
Unrealized gain on available for sale securities | — |
| | — |
| | 112 |
|
Less: reclassification adjustments for recognized gains included in net loss | — |
| | — |
| | (112 | ) |
Total unrealized gain on available for sale securities | — |
| | — |
| | — |
|
Other comprehensive (loss) income | (117 | ) | | (303 | ) | | 4 |
|
Comprehensive loss | (113,049 | ) | | (2,429 | ) | | (57,190 | ) |
Comprehensive income attributable to non-controlling interests | — |
| | — |
| | 194 |
|
Comprehensive loss attributable to Global Eagle Entertainment Inc. common stockholders | $ | (113,049 | ) | | $ | (2,429 | ) | | $ | (57,384 | ) |
The accompanying notes are an integral part of these consolidated financial statements.
GLOBAL EAGLE ENTERTAINMENT INC.
CONSOLIDATED STATEMENTS OF STOCKHOLDERS’ EQUITY
(In thousands) |
| | | | | | | | | | | | | | | | | | | | | | | | | | | | | | | | | | | | | | | | | | | | | | | | |
| Common Stock | | Common Stock Non-Voting | | Treasury Stock | | Additional Paid-in | | Subscriptions | | Accumulated | | Accumulated Other Comprehensive | | Total Global Eagle Entertainment Inc. Stockholders’ | | Non-Controlling | | Total |
| Shares | | Amount | | Shares | | Amount | | Shares | | Amount | | Capital | | Receivable | | Deficit | | Income (Loss) | | Equity | | Interest | | Equity |
Balance, December 31, 2013 | 55,902 |
| | $ | 5 |
| | 19,118 |
| | $ | 2 |
| | (3,054 | ) | | $ | (30,659 | ) | | $ | 620,862 |
| | $ | (478 | ) | | $ | (243,943 | ) | | $ | — |
| | $ | 345,789 |
| | $ | 10,395 |
| | $ | 356,184 |
|
Conversion of non-voting common stock | 19,118 |
| | 2 |
| | (19,118 | ) | | (2 | ) | | — |
| | — |
| | — |
| | — |
| | — |
| | — |
| | — |
| | — |
| | — |
|
Exercise of common stock options and warrants, net | 351 |
| | — |
| | — |
| | — |
| | — |
| | — |
| | 2,942 |
| | — |
| | — |
| | — |
| | 2,942 |
| | — |
| | 2,942 |
|
Issuance of common stock to former Row 44 stockholders | 28 |
| | — |
| | — |
| | — |
| | — |
| | — |
| | 345 |
| | — |
| | — |
| | — |
| | 345 |
| | — |
| | 345 |
|
Issuance of common stock in exchange for warrants, net of transaction fees of $362 | 4,227 |
| | 1 |
| | — |
| | — |
| | — |
| | — |
| | 24,046 |
| | — |
| | — |
| | — |
| | 24,047 |
| | — |
| | 24,047 |
|
Stock-based compensation | — |
| | — |
| | — |
| | — |
| | — |
| | — |
| | 8,067 |
| | — |
| | — |
| | — |
| | 8,067 |
| | — |
| | 8,067 |
|
Interest income on subscription receivable | — |
| | — |
| | — |
| | — |
| | — |
| | — |
| | — |
| | (25 | ) | | — |
| | — |
| | (25 | ) | | — |
| | (25 | ) |
Other comprehensive income, net of tax | — |
| | — |
| | — |
| | — |
| | — |
| | — |
| | — |
| | — |
| | — |
| | 4 |
| | 4 |
| | — |
| | 4 |
|
Net loss | — |
| | — |
| | — |
| | — |
| | — |
| | — |
| | — |
| | — |
| | (57,388 | ) | | — |
| | (57,388 | ) | | 194 |
| | (57,194 | ) |
Purchase of subsidiary share from a non-controlling interest | — |
| | — |
| | — |
| | — |
| | — |
| | — |
| | (11,152 | ) | | — |
| | — |
| | — |
| | (11,152 | ) | | (10,589 | ) | | (21,741 | ) |
Balance, December 31, 2014 | 79,626 |
| | 8 |
| | — |
| | — |
| | (3,054 | ) | | (30,659 | ) | | 645,110 |
| | (503 | ) | | (301,331 | ) | | 4 |
| | 312,629 |
| | — |
| | 312,629 |
|
Convertible note conversion option fair value | — |
| | — |
| | — |
| | — |
| | — |
| | — |
| | 12,674 |
| | — |
| | — |
| | — |
| | 12,674 |
| | — |
| | 12,674 |
|
Exercise of common stock options and warrants, net | 607 |
| | — |
| | — |
| | — |
| | — |
| | — |
| | 6,006 |
| | — |
| | — |
| | — |
| | 6,006 |
| | — |
| | 6,006 |
|
Restricted stock units vested and distributed, net of tax | 31 |
| | — |
| | — |
| | — |
| | — |
| | — |
| | (208 | ) | | — |
| | — |
| | — |
| | (208 | ) | | — |
| | (208 | ) |
Issuance of common stock in exchange for warrants | 1,412 |
| | — |
| | — |
| | — |
| | — |
| | — |
| | 16,600 |
| | — |
| | — |
| | — |
| | 16,600 |
| | — |
| | 16,600 |
|
Stock-based compensation | — |
| | — |
| | — |
| | — |
| | — |
| | — |
| | 8,235 |
| | — |
| | — |
| | — |
| | 8,235 |
| | — |
| | 8,235 |
|
Tax benefit on stock options exercise | — |
| | — |
| | — |
| | — |
| | — |
| | — |
| | 279 |
| | — |
| | — |
| | — |
| | 279 |
| | — |
| | 279 |
|
Interest income on subscription receivable | — |
| | — |
| | — |
| | — |
| | — |
| | — |
| | — |
| | (25 | ) | | — |
| | — |
| | (25 | ) | | — |
| | (25 | ) |
Other comprehensive loss, net of tax | — |
| | — |
| | — |
| | — |
| | — |
| | — |
| | — |
| | — |
| | — |
| | (303 | ) | | (303 | ) | | — |
| | (303 | ) |
Net loss | — |
| | — |
| | — |
| | — |
| | — |
| | — |
| | — |
| | — |
| | (2,126 | ) | | — |
| | (2,126 | ) | | — |
| | (2,126 | ) |
Balance, December 31, 2015 | 81,676 |
| | 8 |
| | — |
| | — |
| | (3,054 | ) | | (30,659 | ) | | 688,696 |
| | (528 | ) | | (303,457 | ) | | (299 | ) | | 353,761 |
| | — |
| | 353,761 |
|
GLOBAL EAGLE ENTERTAINMENT INC.
CONSOLIDATED STATEMENTS OF EQUITY (continued)
(In thousands)
|
| | | | | | | | | | | | | | | | | | | | | | | | | | | | | | | | | | | | | | | | | | | | | | | | |
| Common Stock | | Common Stock Non-Voting | | Treasury Stock | | Additional Paid-in | | Subscriptions | | Accumulated | | Accumulated Other Comprehensive | | Total Global Eagle Entertainment Inc. Stockholders’ | | Non-Controlling | | Total |
| Shares | | Amount | | Shares | | Amount | | Shares | | Amount | | Capital | | Receivable | | Deficit | | Income (Loss) | | Equity | | Interest | | Equity |
Issuance of common stock for Emerging Markets Communication Acquisition | 5,467 |
| | 1 |
| | — |
| | — |
| | — |
| | — |
| | 40,606 |
| | — |
| | — |
| | — |
| | 40,607 |
| | — |
| | 40,607 |
|
Issuance of common stock for legal settlements | 1,751 |
| | — |
| | — |
| | — |
| | — |
| | — |
| | 13,705 |
| | — |
| | — |
| | — |
| | 13,705 |
| | — |
| | 13,705 |
|
Repurchase and retirement of common stock | (614 | ) | | — |
| | — |
| | — |
| | — |
| | — |
| | (5,219 | ) | | — |
| | — |
| | — |
| | (5,219 | ) | | — |
| | (5,219 | ) |
Exercise of common stock options | 26 |
| | — |
| | — |
| | — |
| | — |
| | — |
| | 255 |
| | — |
| | — |
| | — |
| | 255 |
| | — |
| | 255 |
|
Restricted stock units vested and distributed, net of tax | 177 |
| | — |
| | — |
| | — |
| | — |
| | — |
| | (705 | ) | | — |
| | — |
| | — |
| | (705 | ) | | — |
| | (705 | ) |
Purchase of subsidiary shares from non-controlling interests | — |
| | — |
| | — |
| | — |
| | — |
| | — |
| | (876 | ) | | — |
| | — |
| | — |
| | (876 | ) | | — |
| | (876 | ) |
Stock-based compensation | — |
| | — |
| | — |
| | — |
| | — |
| | — |
| | 10,747 |
| | — |
| | — |
| | — |
| | 10,747 |
| | — |
| | 10,747 |
|
Tax deficiency on stock options exercise | — |
| | — |
| | — |
| | — |
| | — |
| | — |
| | (204 | ) | | — |
| | — |
| | — |
| | (204 | ) | | — |
| | (204 | ) |
Interest income on subscription receivable | — |
| | — |
| | — |
| | — |
| | — |
| | — |
| | — |
| | (25 | ) | | — |
| | — |
| | (25 | ) | | — |
| | (25 | ) |
Other comprehensive loss, net of tax | — |
| | — |
| | — |
| | — |
| | — |
| | — |
| | — |
| | — |
| | — |
| | (117 | ) | | (117 | ) | | — |
| | (117 | ) |
Net loss | — |
| | — |
| | — |
| | — |
| | — |
| | — |
| | — |
| | — |
| | (112,932 | ) | | — |
| | (112,932 | ) | | — |
| | (112,932 | ) |
Balance, December 31, 2016 | 88,483 |
| | $ | 9 |
| | — |
| | $ | — |
| | (3,054 | ) | | $ | (30,659 | ) | | $ | 747,005 |
| | $ | (553 | ) | | $ | (416,389 | ) | | $ | (416 | ) | | $ | 298,997 |
| | $ | — |
| | $ | 298,997 |
|
The accompanying notes are an integral part of these consolidated financial statements.
GLOBAL EAGLE ENTERTAINMENT INC.
CONSOLIDATED STATEMENTS OF CASH FLOWS
(In thousands)
|
| | | | | | | | | | | |
| Year Ended December 31, |
| 2016 | | 2015 | | 2014 |
CASH FLOWS FROM OPERATING ACTIVITIES: | | | | | |
Net loss | $ | (112,932 | ) | | $ | (2,126 | ) | | $ | (57,194 | ) |
Adjustments to reconcile net loss to net cash (used in) provided by operating activities: | | | | | |
Depreciation and amortization of property, equipment and intangibles | 57,158 |
| | 36,592 |
| | 34,422 |
|
Amortization of content library | 14,932 |
| | 14,929 |
| | 15,022 |
|
Non-cash interest expense, net | 1,916 |
| | 903 |
| | 23 |
|
Stock-based compensation | 10,747 |
| | 8,235 |
| | 8,067 |
|
Issuance of shares for working capital settlement | — |
| | — |
| | 345 |
|
Issuance of common stock for legal settlements | 13,705 |
| | — |
| | — |
|
Impairment of goodwill | 64,000 |
| | — |
| | — |
|
Impairment of internally developed software | 4,069 |
| | — |
| | — |
|
Impairment of related party loan | 4,353 |
| | — |
| | — |
|
(Income) loss from equity method investments | (3,829 | ) | | — |
| | 1,500 |
|
Change in fair value of derivatives | (25,515 | ) | | (11,938 | ) | | 6,955 |
|
Provision for bad debt | 2,624 |
| | 797 |
| | 5,539 |
|
Deferred income taxes | (60,369 | ) | | (6,452 | ) | | (5,068 | ) |
Other | (1,488 | ) | | 96 |
| | — |
|
Changes in operating assets and liabilities: | | | | | |
Restricted cash | 2,700 |
| | (722 | ) | | (767 | ) |
Accounts receivable | (8,032 | ) | | (5,879 | ) | | (26,386 | ) |
Inventories | 2,123 |
| | (1,580 | ) | | (3,557 | ) |
Prepaid expenses | (4,382 | ) | | (1,272 | ) | | (449 | ) |
Other current assets | 16,366 |
| | (1,252 | ) | | (5,493 | ) |
Content library | (18,614 | ) | | (15,406 | ) | | (16,765 | ) |
Other non-current assets | 2,695 |
| | 2,814 |
| | (2,703 | ) |
Accounts payable and accrued liabilities | 14,854 |
| | 4,183 |
| | 19,641 |
|
Deferred revenue | (12,891 | ) | | (3,134 | ) | | 3,151 |
|
Other current liabilities | (790 | ) | | 3,067 |
| | 322 |
|
NET CASH (USED IN) PROVIDED BY OPERATING ACTIVITIES | (36,600 | ) | | 21,855 |
| | (23,395 | ) |
CASH FLOWS FROM INVESTING ACTIVITIES: | | | | | |
Acquisitions of businesses, net of cash acquired | (92,246 | ) | | (60,242 | ) | | (500 | ) |
Purchases of property and equipment | (54,173 | ) | | (20,653 | ) | | (9,074 | ) |
Issuance of loan to related party | (4,400 | ) | | — |
| | — |
|
Proceeds from sale of investment | — |
| | — |
| | 583 |
|
Other | — |
| | — |
| | (732 | ) |
NET CASH USED IN INVESTING ACTIVITIES | (150,819 | ) | | (80,895 | ) | | (9,723 | ) |
GLOBAL EAGLE ENTERTAINMENT INC.
CONSOLIDATED STATEMENTS OF CASH FLOWS (continued)
|
| | | | | | | | | | | |
| Year Ended December 31, |
| 2016 | | 2015 | | 2014 |
CASH FLOWS FROM FINANCING ACTIVITIES: | | | | | |
Acquisition of non-controlling interest | — |
| | — |
| | (21,741 | ) |
Proceeds from borrowings | 27,500 |
| | 81,250 |
| | 2,047 |
|
Repayment of debt | (3,806 | ) | | (1,126 | ) | | (9,669 | ) |
Repurchase of common stock warrants | (5,219 | ) | | — |
| | (1,406 | ) |
Proceeds from exercise of common stock options and warrants | (450 | ) | | 5,604 |
| | 3,100 |
|
Convertible senior note issuance fees | — |
| | (831 | ) | | — |
|
Other financing activities, net | (4,127 | ) | | (339 | ) | | (362 | ) |
NET CASH PROVIDED BY (USED IN) FINANCING ACTIVITIES | 13,898 |
| | 84,558 |
| | (28,031 | ) |
Effects of exchange rate changes on cash and cash equivalents | 655 |
| | 386 |
| | 1 |
|
Net (decrease) increase in cash and cash equivalents | (172,866 | ) | | 25,904 |
| | (61,148 | ) |
CASH AND CASH EQUIVALENTS AT BEGINNING OF YEAR | 223,552 |
| | 197,648 |
| | 258,796 |
|
CASH AND CASH EQUIVALENTS AT END OF YEAR | $ | 50,686 |
| | $ | 223,552 |
| | $ | 197,648 |
|
SUPPLEMENTAL DISCLOSURES OF CASH FLOW INFORMATION: | | | | | |
Cash paid for: | | | | | |
Taxes | $ | 12,562 |
| | $ | 5,435 |
| | $ | 4,203 |
|
Interest | $ | 19,249 |
| | $ | 1,161 |
| | $ | 447 |
|
SIGNIFICANT NON-CASH INVESTING AND FINANCING ACTIVITIES: | | | | | |
Issuance of common stock in connection with acquisition of business | $ | 40,607 |
| | $ | — |
| | $ | — |
|
Deferred consideration liabilities incurred in connection with acquisition of business | $ | 25,000 |
| | $ | — |
| | $ | — |
|
Issuance of common stock to repurchase Global Eagle public company warrants | $ | — |
| | $ | 16,600 |
| | $ | 24,448 |
|
Purchase consideration for equipment included in accounts payable | $ | 13,500 |
| | $ | — |
| | $ | — |
|
The accompanying notes are an integral part of these consolidated financial statements.
Global Eagle Entertainment Inc.
Notes to Consolidated Financial Statements
Note 1. Business
Global Eagle Entertainment Inc. (“GEE”) is a Delaware corporation headquartered in Los Angeles, California. GEE and its subsidiaries (collectively herein as the “Company”) are a leading provider of satellite-based connectivity and media to fast-growing, global mobility markets across air, land and sea. GEE offers a fully integrated suite of rich media content and seamless connectivity solutions that cover the globe. Its business is comprised of three operating segments: Media & Content, Aviation Connectivity and Maritime & Land Connectivity.
As discussed further in Note 3. Business Combinations, the Company completed the acquisition of Emerging Markets Communications (“EMC”) (the “EMC Acquisition”) on July 27, 2016 (the “EMC Acquisition Date”). EMC is a communications services provider that offers land-based sites and marine vessels globally a multimedia platform delivering communications, Internet, live television, on-demand video, voice, cellular and 3G/LTE services. EMC leverages its satellite-terrestrial-cellular broadband network with fully meshed Multiprotocol Label Switching (“MPLS”) interconnected teleports and has a portfolio of patented technologies. EMC owns and operates its own ground infrastructure and global field support centers, permitting EMC to deploy support to customers around the world. Key aspects of EMC’s services include:
| |
• | Connectivity – EMC provides global satellite bandwidth (C-Band, Ku-Band, Ka-Band), terrestrial broadband network, cellular and 3G services, remote fiber network and fully meshed MPLS interconnected teleports; |
| |
• | Access – EMC provides access to live television worldwide, video (on demand and subscription), 3G cellular services, Internet, voice, data, high-definition video conferencing and universal portals, including through its proprietary SpeedNet product; and |
| |
• | Support – EMC has field support centers worldwide, each of which has a spare parts inventory, a 24 hour/7 days network operations center, certified technicians, system integration and project management. |
Media & Content
The Media & Content segment selects, manages, provides lab services and distributes wholly-owned and licensed media content, video and music programming, advertising, applications and video games to the airline, maritime and other “away from home” non-theatrical markets.
The Media & Content operations commenced on January 31, 2013, when the Company acquired 86% of the issued and outstanding shares of Advanced Inflight Alliance AG (“AIA”) in January 2013.
Prior to January 31, 2013, the Company was known as Global Eagle Acquisition Corp. (“GEAC”), which was formed in February 2011 to effect a merger, capital stock exchange, asset acquisition or similar business combination with one or more businesses. Upon completion of the business combination with Row 44 and AIA, the Company changed its name from Global Eagle Acquisition Corp. to Global Eagle Entertainment Inc. In addition, the Company purchased substantially all the assets of Post Modern Edit, LLC and related companies (“PMG”) in July 2013 and completed the stock acquisition of the U.K. parent of the Travel Entertainment Group Equity Limited and subsidiaries (“IFES”) in October 2013. In 2013, the Company acquired additional outstanding shares of AIA to increase its ownership of AIA’s shares to 94%, and in April 2014, the Company acquired the remaining outstanding shares in AIA.
Aviation Connectivity and Maritime & Land Connectivity
The Aviation Connectivity and Maritime & Land Connectivity segments are distinguished primarily based on the type of customers they serve. These operating segments provide their customers, including their passengers and crew, with (i) Wi-Fi connectivity via X, L, C, Ka and Ku-band satellite transmissions that enable access to the Internet, live television, on-demand content, shopping and travel-related information and (ii) operational solutions that allow customers to improve the management of their internal operations.
The Aviation Connectivity segment operations commenced when the Company acquired all of the outstanding shares of common stock of Row 44, Inc. (“Row 44”) pursuant to a business combination transaction that closed on January 31, 2013 in which the Company acquired Row 44 and 86% of the issued and outstanding shares of AIA.
The Maritime & Land Connectivity segment operations commenced upon the closing of the EMC Acquisition in July 2016.
Note 2. Basis of Presentation and Summary of Significant Accounting Policies
The following is a summary of the significant accounting policies consistently applied in the preparation of the accompanying consolidated financial statements.
Basis of Presentation
The accompanying consolidated financial statements have been prepared in accordance with accounting principles generally accepted in the United States (“GAAP”). These financial statements have been prepared on the basis of the Company having sufficient liquidity to fund its operations for at least the next twelve months from the issuance of these consolidated financial statements in accordance with the Financial Accounting Standards Board (“FASB”) Accounting Standards Codification (“ASC”) Topic 205-40, Presentation of Financial Statements - Going Concern. The Company’s principal sources of liquidity have historically been its debt and equity issuances and its cash and cash equivalents (which cash and cash equivalents amounted to $50.7 million as of December 31, 2016). The Company’s internal plans and forecasts indicate that it will have sufficient liquidity to continue to fund its business and operations for at least the next twelve months in accordance with ASC Topic 205-40.
For the year ended December 31, 2016, the Company adopted ASC Topic 205-40, which requires that an entity’s management evaluate whether there are relevant conditions and events that in aggregate raise substantial doubt about the entity’s ability to continue as a going concern and to meet its obligations as they become due within one year after the date that the financial statements are issued. Under this standard, the assessment by the entity’s management shall not take into consideration the potential mitigating effects of management’s plans that have not been fully implemented as of the date the financial statements are issued. Under ASC Topic 205-40, the first step of the assessment requires the entity to conclude that it will meet its obligations as they become due within one year after the date that the financial statements are issued, and the second step considers management’s mitigating measures in the event that management has concluded there is substantial doubt about the entity’s ability to continue as a going concern and to meet its obligations as they become due within one year after the date the financial statements are issued.
The Company’s management completed the first step of the assessment required by ASC Topic 205-40, considering, among other things, the Company’s current financial condition, taking into account recent negative indicators such as the Company’s lack of remaining capacity on its revolving credit facility, delay in filing its financial statements and its delay in achieving its anticipated acquisition synergies as well as its material weaknesses in its internal controls and the substantial time and resources that management must dedicate to remediate and compensate for them; obligations coming due within the next 12 months; funds necessary to maintain its operations; and other conditions and events that may adversely affect the Company’s ability to meet its obligations within one year, such as a potential failure to satisfy its reporting obligations under its debt instruments as described below. Following this assessment, the Company’s management concluded that the Company will meet its obligations as they become due within one year after the date that the financial statements are issued. As such, management did not need to conduct a second-step assessment.
The assessment by the Company’s management that the Company will have sufficient liquidity to continue as a going concern is based on underlying estimates and assumptions, including that the Company: (i) files its delinquent periodic reports with the U.S. Securities and Exchange Commission (the “SEC”) and remains current in its SEC public-reporting obligations; (ii) services its indebtedness and complies with the covenants (including the financial-reporting covenants) in the agreements governing its indebtedness; and (iii) remains listed on The Nasdaq Stock Exchange. Under the terms of its credit agreement (as modified) and waivers related thereto, the Company must file its Quarterly Reports on Form 10-Q for the quarters ended March 31, June 30 and September 30, 2017 on or before January 2, 2018. In addition, under the terms of an extension that Nasdaq granted the Company, the Company must file these Quarterly Reports on or before January 31, 2018. The Company is currently in compliance with its credit-agreement covenants due to waivers and amendments it has obtained through the date of filing of this Form 10-K.
If the Company is unable to satisfy the foregoing requirement relating to its credit agreement or obtain additional waivers (if needed), then its lenders have the option to immediately accelerate all outstanding indebtedness, which the Company may not have the ability to repay. In addition, if the Company is unable to satisfy the terms of its Nasdaq extension, then Nasdaq could determine to delist the Company’s common stock from Nasdaq, which would in turn constitute a “fundamental change” under the
Global Eagle Entertainment Inc.
Notes to Consolidated Financial Statements
terms of the indenture governing its 2.75% convertible senior notes due 2035. This would give the noteholders the option to require the Company to repurchase all or a portion of their convertible notes at a repurchase price equal to 100% of the principal amount thereof. In this event, the Company may not have the ability to repurchase the tendered notes. If these events occur, then the Company could be required to repay its credit-agreement debt and convertible notes as early as the first quarter of 2018.
An acceleration or “fundamental change” repurchase event under the Company’s credit agreement or indenture (as applicable) could materially and adversely affect the Company’s operating results, financial condition, liquidity and the carrying value of the Company’s assets and liabilities. The Company intends to satisfy its current and future debt service obligations with its existing cash and cash equivalents. However, the Company may not have sufficient funds or may be unable to arrange for additional financing to pay the amounts due under its existing debt instruments in the event of an acceleration event or repurchase event (as applicable). In this event, funds from external sources may not be available on acceptable terms, if at all.
Reclassifications
Certain reclassifications have been made to the consolidated financial statements of prior years and the accompanying notes to conform to the current year presentation.
The presentation of the Provision for legal settlements included in the Consolidated Statements of Operations for the years ended December 31, 2015 and 2014 has been reclassified from General and administrative expenses to a separate line item within Operating expenses to conform to the current year presentation. The Company also reclassified its share of losses and the impairment of an equity method investment for the year ended December 31, 2014 from Other expense, net to Income (loss) from equity method investments to conform to the current year presentation.
In 2016, the Company reclassified the $12.3 million of content library as of December 31, 2015 included in current assets to non-current assets. The $3.8 million of non-current content library amount previously included in Intangible assets, net, as of December 31, 2015 was reclassified at this time and included in this new line item presentation. In addition, the Company made a further correction pertaining to the accounting for deferred revenue and deferred equipment costs as of December 31, 2015, and as a result, during the year ended December 31, 2016, the Company adjusted the carrying amount of deferred revenue of $8.0 million and deferred equipment costs of $7.9 million. The net impact of the adjustment of $0.1 million was recorded in Cost of sales in the Consolidated Statements of Operations. Further, in connection with the adoption of a new accounting pronouncement in the first quarter of 2016, the Company began presenting debt issuance costs related to a recognized debt liability as a direct deduction from the carrying amount of that debt liability. See Adoption of New Accounting Pronouncements for further discussion. Additionally, the presentation of Restricted cash, Prepaid assets and Other current assets which were aggregated and included as Prepaid and other current assets on the December 31, 2015 Consolidated Balance Sheet have been disaggregated to conform to the December 31, 2016 presentation.
As of December 31, 2016, the Company re-evaluated its classification of its investments in securities and determined that given its practice, beginning in 2015, of liquidating its securities holdings before the end of each reporting period, they should have been classified as trading instead of as available-for-sale. There was no impact on the Consolidated Balance Sheet or the Consolidated Statement of Operations as of and for the year ended December 31, 2015 as a result of this re-classification. Purchases and sales of marketable securities included in cash flow from investing activities in the Consolidated Statement of Cash Flows for the year ended December 31, 2015 have been restated and are now reflected as operating activities instead of investing activities. As a consequence of this reclassification, cash provided by operating activities for the year ended December 31, 2015 increased by $5,000, which was offset by a corresponding increase in cash used in investing activities.
Global Eagle Entertainment Inc.
Notes to Consolidated Financial Statements
Principles of Consolidation
The consolidated financial statements include the accounts of the Company and its wholly-owned, majority-owned and controlled subsidiaries. Intercompany balances and transactions have been eliminated in consolidation. The results of acquired businesses are included in the consolidated financial statements from the date of acquisition. Earnings or losses attributable to any non-controlling interests in a Company subsidiary are included in Net loss in the Consolidated Statements of Operations. Any investments in affiliates over which the Company has the ability to exert significant influence but does not control and with respect to which it is not the primary beneficiary are accounted for using the equity method. As a result of the EMC Acquisition, the Company has two such equity affiliates. In addition, during the year ended December 31, 2013, the Company acquired an approximate 18% interest in a privately held company for approximately $1.5 million. The Company’s ownership percentage increased to approximately 22% during that same year at which time the Company began to account for this investment using the equity method of accounting. During the year ended December 31, 2014, as described above, the Company recognized an impairment loss on the $1.5 million investment. Investments in affiliates for which the Company has no ability to exert significant influence are accounted for using the cost method of accounting.
Use of Estimates
The preparation of the Company’s consolidated financial statements in conformity with GAAP requires management to make estimates and assumptions that affect the reported amounts of assets and liabilities, the disclosure of contingent assets and liabilities at the date of the financial statements, and the reported amounts of revenue (allocated on the basis of the relative selling price of deliverables) and expenses during the reporting period. Significant items subject to such estimates and assumptions include revenue, allowance for doubtful accounts, the assigned value of acquired assets and assumed and liabilities associated with business combinations, legal settlements, valuation of media content library and equipment inventory, useful lives and impairment of property, plant and equipment, intangible assets, goodwill and other assets, the fair value of the Company’s equity-based compensation awards and convertible debt instruments, and deferred income tax assets and liabilities. Actual results could differ materially from those estimates. On an ongoing basis, the Company evaluates its estimates compared to historical experience and trends, which form the basis for making judgments about the carrying value of assets and liabilities.
Revenue Recognition
The Company recognizes revenue when persuasive evidence of a sales arrangement exists, the services have been rendered or goods have been delivered, the sales price is fixed or determinable, and collectability is reasonably assured. If any of these criteria are not met, revenue recognition is deferred until such time as all of the criteria are met. The Company considers persuasive evidence of a sales arrangement to be the receipt of a signed contract or purchase order. Collectability is assessed based on a number of factors, including transaction history and the creditworthiness of a customer. If it is determined that collection is not reasonably assured, revenue is not recognized until collection becomes reasonably assured, which is generally upon receipt of cash.
For arrangements with multiple deliverables, the Company allocates revenue to each deliverable if the delivered item(s) has value to the customer on a standalone basis and, if the arrangement includes a general right of return relative to the delivered item, delivery or performance of the undelivered item(s) is considered probable and substantially in the Company’s control. The fair value of the selling price for a deliverable is determined using a hierarchy of (1) Company-specific objective and reliable evidence, then (2) third-party evidence, then (3) best estimate of selling price. The Company allocates any arrangement fee to each of the elements based on their relative selling prices.
When the Company enters into revenue sharing arrangements where it acts as the principal, the Company recognizes the underlying revenue on a gross basis. In determining whether to report revenue gross for the fees received from its customers, the Company assesses whether it is the primary obligor, responsible for fulfillment, has the general inventory risk, bears credit risk and has latitude in establishing prices with its customers, and among other factors. Revenues are presented net of the taxes that are collected from customers and remitted to governmental authorities.
Global Eagle Entertainment Inc.
Notes to Consolidated Financial Statements
The Company’s revenue is principally derived from the following sources:
Media & Content
Licensing Revenue. The Company curates and manages the licensing of content to the airline, maritime, and non-theatrical industries globally. Media & Content licensing revenue is principally generated through the sale or license of media content, video and music programming, applications and video games to customers in the aviation, maritime and non-theatrical markets. Revenue from the sale or license of content is recognized when the content has been delivered and the contractual performance obligations have been fulfilled, generally at the time a customer’s license period begins. In certain cases, the Company estimates licensing revenue from customers, typically for revenue based on usage, including fees based on number of flights or number of aircraft or pay-per-view. The Company believes it has the ability to reasonably estimate the amounts that will ultimately be collected and therefore recognizes these amounts when earned.
Services Revenue. Media & Content services revenue, such as technical services, delivery of digital media advertising, the encoding of video and music products, development of graphical interfaces or the provision of materials, are billed and revenue is recognized as services are performed and/or when the committed advertisement impressions have been delivered. Obligations pursuant to the Company’s advertising revenue arrangements typically include a minimum number of impressions or the satisfaction of other performance criteria. Revenue from performance-based arrangements is recognized as the related performance criteria are met. The Company assesses whether performance criteria have been met and whether the fees are fixed or determinable based on a reconciliation of the performance criteria and an analysis of the payment terms associated with the transaction. The reconciliation of the performance criteria generally includes a comparison of third-party performance data to the contractual performance obligation and to internal or customer performance data in circumstances where that data is available. Where the Company enters into revenue-sharing arrangements with its customers, such as those relating to advertising, and when we are considered the principal, the Company reports the underlying revenue on a gross basis in its Consolidated Statements of Operations, and records these revenue-sharing payments to its customers in service costs.
Aviation Connectivity and Maritime & Land Connectivity
Services Revenue. Services revenue for Aviation Connectivity and Maritime & Land Connectivity includes satellite-based Internet services and related technical and network operational support and management services, live television, on-demand content, music streaming, shopping and click-through advertising revenue from travel-related information. The revenue is recognized after the service has been rendered and the customer can use such service, which customarily is in the form of (i) enplanement for boarded passengers, (ii) usage by passengers, depending upon the specific customer contract, and/or (iii) other revenue such as advertising sponsorship. The Company assesses whether performance criteria have been met and whether its service fees are fixed or determinable based on a reconciliation of the performance criteria and an analysis of the payment terms associated with the customer transaction. The reconciliation of the performance criteria generally includes a comparison of third-party performance data to the contractual performance obligation and to internal or customer performance data in circumstances where that data is available. In certain cases, the Company records licensing and services revenue based on available and preliminary information from its network operations. Amounts collected on the related receivables may vary from reported information based upon third party reported amounts owed that typically occurs within thirty days of the end of the period end. For all years presented, the difference between the amounts recognized based on preliminary information and cash collected was not material.
Equipment Revenue. Equipment revenue is recognized when title and risk pass to the buyer, which is generally upon shipment or arrival at destination depending on the contractual arrangement with the customer. In determining whether an arrangement exists, the Company ensures that a binding arrangement is in place, such as a purchase order or a fully executed customer-specific agreement. In cases where a customer has the contractual ability to return equipment within a specific time frame, the Company will provide for return reserves when and if necessary (based upon historical experience). The Company generally believes the acceptance clauses in our contracts are perfunctory and will recognize revenue upon shipment provided that all other criteria have been met including delivery of the Supplemental Type Certificates (“STC”). In certain cases where the Company sells its equipment to an aviation customer on a stand-alone basis, it may charge a fee for obtaining STC from the Federal Aviation Administration (“FAA”), which allow its equipment to operate on certain model/type of aircraft. To the extent that the Company contracts to charge STC fees in equipment-only sales, the Company will record these fees as revenue. The Company recognized STC fee revenue of $1.2 million and $0.6 million for the years ended December 31, 2016 and 2014, respectively. The Company recognized no STC revenue for the year ended December 31, 2015.
Global Eagle Entertainment Inc.
Notes to Consolidated Financial Statements
Cost of Sales
Media & Content
Cost of sales for Media & Content consist primarily of the costs to license or purchase media content, direct costs to service content for aviation, maritime and other non-theatrical markets, and advertising revenue-sharing payments to our customers. Included in the cost of sales, when applicable, is amortization expense associated with the purchase of film content libraries acquired in business combinations and, in the ordinary course of business, personnel, support and occupancy costs.
Aviation Connectivity and Maritime & Land Connectivity
Cost of sales for Aviation Connectivity and Maritime & Land Connectivity consists primarily of equipment fees paid to third-party manufacturers, royalty expense as a result of revenue-sharing arrangements, Internet connection, satellite charges and related network operational support costs, and other platform operating expenses, including depreciation of property and equipment and internally developed software, website development costs, hardware and services used to build and operate the Connectivity platform and personnel costs relating to information technology.
Sales and marketing
Sales and marketing expense is primarily comprised of personnel costs, advertising costs, including promotional events and other brand building and product marketing expenses, corporate communications, certain professional fees, occupancy costs and travel expenses.
Advertising costs are expensed as incurred. Advertising expenses for the years ended December 31, 2016, 2015, and 2014 were not material.
Product Development
Product research and software development costs, other than certain internal-use software costs qualifying for capitalization, are expensed as incurred. Costs of computer software or websites developed or obtained for internal use that are incurred in the preliminary project and post-implementation stages are expensed as incurred. Certain costs of developing internal-use software incurred during the application and development stage, which include employee and outside consulting compensation and related expenses, costs of computer hardware and software, website development costs and costs incurred in developing additional features and functionality of the services, are capitalized. The estimated useful life of costs capitalized is evaluated for each specific project. Capitalized costs are generally amortized using the straight-line method over a three-year estimated useful life, beginning in the period in which the software is ready for its intended use. Unamortized amounts are included in Property, plant and equipment, net, in the Consolidated Balance Sheets.
The Company’s product development expenditures are focused on developing new products and services, and obtaining STC as required by the FAA for each model/type of aircraft prior to providing Connectivity services. To the extent that the Company is contracted to obtain STC, and customers reimburse these costs, the Company will record these reimbursements directly against its product development expenses.
Stock-Based Compensation
Stock-based awards are comprised principally of stock options, restricted stock units (“RSUs”) and beginning in 2016, performance-based RSU (“PSU”) awards. Stock-based awards are generally issued to certain senior management personnel and non-employee directors. Stock-based compensation cost is measured at the grant date based on the fair value of the award and is recognized as an expense over the requisite service period, which is the vesting period, on a straight-line basis, net of estimated forfeitures.
Global Eagle Entertainment Inc.
Notes to Consolidated Financial Statements
The Company uses the Black-Scholes option pricing model to determine the grant date fair value of stock options. This model requires the Company to estimate the expected volatility and the expected term of the stock options, which are highly complex and subjective variables. The Company uses an expected volatility of its stock price during the expected life of the options that is based on the historical performance of the Company’s stock price as well as including an estimate using similar companies. The expected term is computed using the simplified method as the Company’s best estimate given its lack of actual exercise history. The Company has selected a risk-free rate based on the implied yield available on U.S. Treasury securities with a maturity equivalent to the expected exercise term of the stock option. The Company currently has no history or expectation of paying cash dividends on its common stock.
The grant date fair value of the time-vesting RSUs equals the closing price of the Company’s common stock on the grant date.
For PSU awards, the Company recognizes stock-based compensation expense over the requisite service period based on the grant date fair value of a unit multiplied by the number of units granted. The grant date fair value of a unit is computed using a Monte-Carlo simulation which uses a risk free interest rate based on the U.S. Treasury rate on the date of grant commensurate with the term of the performance period.
Stock option awards issued to non-employees (e.g., consultants) are accounted for at fair value determined using the Black-Scholes option-pricing model. Management believes that the fair value of the stock options is more reliably measured than the fair value of the services received. The fair value of each non-employee stock-based compensation award is re-measured each period until performance is completed, which generally is on each vesting date.
Stock Repurchases
Shares of the Company’s stock repurchased by the Company are accounted for when the transaction is settled. Repurchased shares held for future issuance are classified as treasury stock. Shares formally or constructively retired are deducted from common stock at par value and from additional paid-in capital for the excess of cash paid over par value. If additional paid-in capital has been exhausted, the excess over par value is deducted from retained earnings. Direct costs incurred to acquire the shares are included in the total cost of the repurchased shares.
Cash and Cash Equivalents
The Company considers all highly liquid investments purchased with an initial maturity of 90 days or less to be cash equivalents.
Restricted Cash
The Company maintains certain letters of credit agreements with its customers that are secured by the Company’s cash for periods up to three years. Additionally, included in Restricted cash in the Consolidated Balance Sheet as of December 31, 2016, is cash held in an escrow account for a previous EMC acquisition that was released to the former stockholders of the acquired company in 2017, net of any claims that might arise prior to such date. As of December 31, 2016 and 2015, the Company had restricted cash of $18.0 million and $4.4 million, respectively, including $2.1 million in Other non-current assets in the Consolidated Balance Sheets as of December 31, 2015. There was no restricted cash included in Other non-current assets as of December 31, 2016. Subsequent to December 31, 2016, $17.1 million of restricted cash was released from restrictions.
Accounts Receivable, net
The Company extends credit to its customers. An allowance for doubtful accounts is maintained for estimated losses resulting from the inability of the Company’s customers to make required payments. Management specifically analyzes the age of customer balances, historical bad debt experience, customer credit-worthiness and changes in customer payment terms when making estimates of the collectability of the Company’s accounts receivable balances. If the Company determines that the financial condition of any of its customers has deteriorated, whether due to customer specific or general economic issues, an increase in the allowance may be made. After all attempts to collect a receivable have failed, the receivable is written off. Accounts receivable consist of the following (in thousands):
Global Eagle Entertainment Inc.
Notes to Consolidated Financial Statements
|
| | | | | | | |
| December 31, |
| 2016 | | 2015 |
Accounts receivable, gross | $ | 130,583 |
| | $ | 102,089 |
|
Less: Allowance for doubtful accounts | (10,091 | ) | | (8,640 | ) |
Accounts receivable, net | $ | 120,492 |
| | $ | 93,449 |
|
Movements in the balance for bad debt reserve and sales allowance for the years ended December 31, 2016, 2015, and 2014, are as follows (in thousands):
|
| | | | | | | | | | | |
| 2016 | | 2015 | | 2014 |
Beginning balance | $ | 8,640 |
| | $ | 7,468 |
| | $ | 1,929 |
|
Additions charged to statements of operations | 2,624 |
| | 1,172 |
| | 5,539 |
|
Less: Bad debt write offs | (1,173 | ) | | — |
| | — |
|
Ending balance | $ | 10,091 |
| | $ | 8,640 |
| | $ | 7,468 |
|
Inventories
Equipment inventory, which is classified as finished goods, is comprised of individual equipment parts and assemblies. It is accounted for using the first-in, first-out method of accounting and is stated at the lower of cost or market. The Company provides inventory write-downs based on excess and obsolete inventories determined primarily by future demand forecasts. The write-down is measured as the difference between the cost of the inventory and market, based upon assumptions about future demand; and is charged to the provision for inventory, which is a component of cost of sales. At the point of the loss recognition, a new, lower cost basis for that inventory is established, and subsequent changes in facts and circumstances do not result in the restoration or increase in that newly established cost basis.
The Company generally is not directly responsible for warranty costs related to equipment it sells to its customers. The vendors that supply each of the individual parts, which comprise the assemblies sold by the Company to customers, are responsible for the equipment warranty directly to the customer.
Investments in Securities
The Company classifies its investments in securities in one of three categories: trading, available-for-sale or held-to-maturity. Trading securities are bought and held principally for the purpose of selling them in the near term. Securities classified as held-to-maturity are those securities in which the Company has the ability and intent to hold the security until maturity. All other securities not included in trading or held to maturity are classified as available-for-sale. Trading and available-for-sale securities are recorded at fair value, and the fair values of equity securities are based on quoted market prices for those or similar investments at the reporting date. Unrealized holding gains and losses on trading securities are included in earnings. Unrealized holding gains and losses, net of the related tax effect, on available-for-sale securities are excluded from earnings and are reported as a separate component of other comprehensive income until realized. Realized gains and losses from the sale of available-for-sale securities are included in earnings and are determined on a specific identification basis. Transfers of securities between categories are recorded at fair value at the date of transfer. Unrealized holding gains and losses are recognized in earnings for transfers into trading securities.
Impairment of Long-Lived Assets
The Company evaluates the recoverability of its long-lived assets with finite useful lives for impairment when events or changes in circumstances indicate that the carrying amount of an asset group may not be recoverable. Such trigger events or changes in circumstances may include: a significant decrease in the market price of a long-lived asset, a significant adverse change in the extent or manner in which a long-lived asset is being used, a significant adverse change in legal factors or in the business climate, including those resulting from technology advancements in the industry, the impact of competition or other factors that could affect the value of a long-lived asset, a significant adverse deterioration in the amount of revenue or cash flows the Company expects to generate from an asset group, an accumulation of costs significantly in excess of the amount originally expected for the acquisition or development of a long-lived asset, current or future operating or cash flow losses that demonstrate continuing losses associated
Global Eagle Entertainment Inc.
Notes to Consolidated Financial Statements
with the use of a long-lived asset, or a current expectation that, more likely than not, a long-lived asset will be sold or otherwise disposed of significantly before the end of its previously estimated useful life. Assets to be disposed of would be separately presented on the Consolidated Balance Sheets and reported at the lower of their carrying amount or fair value less costs to sell, and would no longer be depreciated or amortized.
The Company performs impairment testing at the asset group level that represents the lowest level for which identifiable cash flows are largely independent of the cash flows of other assets and liabilities. If events or changes in circumstances indicate that the carrying amount of an asset group may not be recoverable and the expected undiscounted future cash flows attributable to the asset group are less than the carrying amount of the asset group, an impairment loss equal to the excess of the asset’s carrying value over its fair value is recorded. Fair value is determined based upon estimated discounted future cash flows. During the year ended December 31, 2016, the Company recorded an impairment loss of $4.1 million in the Consolidated Statement of Operations. The impairment loss represented the write-off of capitalized costs associated with internally developed software projects which were abandoned. Other than is stated in Content Library below, there were no impairment losses recorded during the years ended December 31, 2015 and 2014.
Content Library
Content library represents minimum guaranteed amounts to acquire distribution rights. The Company capitalizes the fee per title and records a corresponding liability at the gross amount of the liability when the license period begins. Amounts owed in excess of the capitalized minimum guarantees are expensed when the Company’s revenue from exploiting the film right have fully recouped the minimum guarantee based on the contractual royalty rates. The useful life of licensed film rights within the content library corresponds to the respective period over which the film rights will be licensed. Capitalized film rights are amortized ratably over their expected revenue streams and included in cost of sales. The Company anticipates that $12.3 million of its capitalized film costs will be amortized within the next 12 months with the remainder being amortized in the subsequent two years. As of December 31, 2016, unamortized film costs for released films were not material due to the short duration of the exploitation period. Participation and residuals are accrued on an individual title basis and expensed in the proportion that the revenue is generated over the exploitation period. As of December 31, 2016, the Company expects to pay accrued participation liabilities of $13.5 million during the next 12 months. As of December 31, 2016 and 2015, the Company had minimum guarantee liabilities, current of $5.5 million and $8.0 million, respectively, which are included in Accounts payable and accrued liabilities in the Consolidated Balance Sheets. As of December 31, 2016 and 2015, the Company had minimum guarantee liabilities of $8.6 million and $6.1 million, respectively, which are included in Other non-current liabilities in the Consolidated Balance Sheets.
Content library is periodically tested for impairment, but no less than annually. The marketability of the individual film right can determine the fair value of such film and whether an impairment loss is necessary. If the fair value determined based on the estimated future cash flows for an individual film right is lower than its carrying amount as of the reporting date, an impairment loss is recognized in such period. For the years ended December 31, 2016 and 2015, the impairment charges for the content library were $3.1 million and $0.9 million included in Cost of sales in the Consolidated Statements of Operations. During the year ended December 31, 2014, the Company recognized no impairment charges for its content library.
Property, Plant and Equipment, net
Property, plant and equipment is stated at cost less accumulated depreciation and impairment losses. Depreciation is recorded on a straight-line basis over the underlying assets’ useful lives. The estimated useful life of technical and operating equipment is three to 10 years. Leasehold improvements are amortized on the straight-line method over the shorter of the remaining lease term or estimated useful life of the asset. Buildings are depreciated on the straight-line method over 30 years. Repairs and maintenance costs are expensed as incurred.
In 2013, the Company capitalized the costs of certain Connectivity equipment installed on aircraft of a single customer to facilitate expanded services over a five-year use period, as the Company retains legal title to the equipment. The Company is amortizing this equipment over its five-year useful life period.
In 2016, the Company began installing aviation connectivity equipment under an agreement entered into with a customer in 2015. Under this agreement, legal title of the equipment is transferred upon delivery but sales are not recognized for accounting purposes because the risks and rewards of ownership are not fully transferred due to the Company’s continuing involvement with the equipment, the term of the agreement with the airline and restrictions in the agreement regarding the airline’s use of the equipment. The Company will take possession of the equipment upon the end of the term. The assets are recorded as Property,
Global Eagle Entertainment Inc.
Notes to Consolidated Financial Statements
plant and equipment, net, on the Consolidated Balance Sheets. The Company will begin depreciating the assets when they are ready for their intended use and depreciate them over the 10-year term of the agreement which approximates the expected useful lives of the equipment.
Intangible Assets and Liabilities and Goodwill
The Company performs valuations of assets acquired and liabilities assumed on each acquisition accounted for as a business combination, and allocates the purchase price of each acquired business to its respective net tangible and intangible assets and liabilities. Acquired intangible assets principally comprise of technology, customer relationships, backlog and trademarks. Liabilities related to intangibles principally consist of unfavorable vendor contracts. The Company determines the appropriate useful life by performing an analysis of expected cash flows based on projected financial information of the acquired businesses. Intangible assets are amortized over their estimated useful lives using the straight-line method, which approximates the pattern in which the majority of the economic benefits is expected to be consumed. Intangible liabilities are amortized into cost of sales ratably over their expected related revenue streams over their useful lives.
Goodwill represents the excess of the cost of an acquired entity over the fair value of the acquired net assets. The Company does not amortize goodwill but evaluates it for impairment at the reporting unit level annually during the fourth quarter of each fiscal year or when an event occurs or circumstances change that indicates the carrying value may not be recoverable. When testing goodwill for impairment, the Company first performs a qualitative assessment to determine whether it is necessary to perform step one of a two-step annual goodwill impairment test for each reporting unit. The Company is required to perform step one only if it concludes that it is more likely than not that a reporting unit's fair value is less than its carrying value. If this is the case, the first step of the two-step process is to identify whether a potential impairment exists by comparing the estimated fair values of the Company's reporting units with their respective book values, including goodwill. The Company utilizes the discounted cash flow (“DCF”) method under the income approach and the guideline company method and the comparable transaction method, both of which are market-based approaches, to estimate a reporting unit’s fair value. The key assumptions used in the DCF valuation model include discount rates, growth rates, cash flow projections and terminal value rates. Discount rates, growth rates and cash flow projections are the most sensitive and susceptible to change as they require significant management judgment. Discount rates are determined by using a weighted average cost of capital (“WACC”). The WACC considers market and industry data as well as Company-specific risk factors for each reporting unit in determining the appropriate discount rates to be used. Using historical and projected data, growth rates and cash flow projections are generated for each reporting unit. Terminal value rate determination follows common methodology of capturing the present value of perpetual cash flow estimates beyond the last projected period assuming a constant WACC and low long-term growth rates.
In the event that the estimated fair value of the reporting unit is less than its carrying amount, the Company would then proceed to the second step to determine if goodwill is impaired and to measure the amount of impairment loss, if any. The amount of the impairment loss is the excess of the carrying amount of the goodwill over its implied fair value. The estimate of implied fair value of goodwill is primarily based on an estimate of the DCF expected to result from that reporting unit, but may require valuations of certain internally generated and unrecognized intangible assets such as the Company's customer relationships, backlog, software, technology, patents and trademarks. If the carrying amount of goodwill exceeds the implied fair value of that goodwill, an impairment loss is recognized in an amount equal to the excess.
The Company periodically analyzes whether any indicators of impairment have occurred. As part of these periodic analyses, the Company compares its estimated fair value, as determined based on its stock price, to its net book value. As the estimated fair value of the Company was higher than its net book value as of March 31, June 30, and September 30, 2016, no additional testing was deemed necessary.
Prior to completion of its annual 2016 goodwill impairment test during the fourth quarter, the Company experienced a continuing significant decline in its stock price, which the Company attributed to certain events occurring in the fourth quarter of 2016.
On October 1, 2016, initial indications of the annual goodwill impairment assessment suggested the Company's derived fair value would exceed its carrying value as of the testing date. During the fourth quarter of 2016, due to a continuing significant decline in its stock price and other indicators of impairment that arose during the fourth quarter of 2016, the Company deemed it more appropriate to assess goodwill impairment as of December 31, 2016, rather than the historical testing date. The Company believes this conclusion is consistent with the Financial Accounting Standards Board's intent with regards to testing goodwill for impairment.
Global Eagle Entertainment Inc.
Notes to Consolidated Financial Statements
In conjunction with the events occurring in the fourth quarter, and for purposes of its annual impairment testing at December 31, 2016, the Company updated its long-term business plan, which was used as the basis for estimating the future cash flows of its reporting units. That plan considered current economic conditions and trends, estimated future operating results, its views of growth rates and anticipated future economic and regulatory conditions.
The Company determined the fair value of the Media & Content and Aviation Connectivity reporting units exceeded its carrying value, while the fair value of the Maritime & Land Connectivity reporting unit was below its carrying value. Therefore, the Company conducted step two of the impairment test for Maritime & Land Connectivity reporting unit and determined the carrying value of goodwill in Maritime & Land Connectivity reporting unit exceeded its implied fair value, resulting in an impairment charge of $64.0 million. This was as a result of reduced financial projections for the Maritime & Land Connectivity reporting unit, due to, among other things: lower than expected actual financial results from this business due to margin compression resulting from competition in the Company’s cellular backhaul land business in Africa, resulting in diminished financial performance relative to its original expectations; delayed new deal executions and slower than anticipated installations and upgrades, also resulting in diminished financial performance relative to its original expectations; and operational challenges in integrating a legacy EMC acquiree in 2015 into this reporting unit, resulting in delayed acquisition synergies. Given the foregoing, the Company determined there was greater uncertainty in achieving its prior financial projections and so applied a higher discount rate for purposes of its goodwill impairment analysis. The higher discount rate affected the fair value of the Maritime & Land Connectivity reporting unit. At December 31, 2016, the remaining amount of goodwill was $327.8 million, of which $146.4 million belongs to the Maritime & Land Connectivity reporting unit.
In addition, for the quarter ended March 31, 2017, the Company expects to record an additional goodwill impairment charge of between $75.0 million and $80.0 million related to this reporting unit. This additional impairment is due to continuing challenges in the business operations at this segment as well as delay in realizing our expected synergies, which resulted in lower results than the projections as of December 31, 2016. The Company determined that there is a higher degree of uncertainty in achieving our financial projections and as such, increased its discount rate, which reduced the fair value of the Maritime & Land Connectivity reporting unit. Also, the adoption of ASU 2017-04, Intangibles-Goodwill and Others (Topic 350): Simplifying the Test for Goodwill Impairment, changed the measurement of the goodwill impairment, which increased the impairment. The Company has not completed its evaluation of goodwill impairment at any dates subsequent to March 31, 2017, and as such, it is possible that additional goodwill impairment charges may occur.
Based on an assessment of its accounting policies and the underlying judgments and uncertainties affecting the application of those policies, the Company believes that its consolidated financial statements fairly present in all material respects the financial position, results of operations and cash flows as of and for the years presented in this Form 10-K. However, the Company does not suggest that other general risk factors, such as those discussed elsewhere in this report as well as changes in its growth objectives or performance of operating segments, could not adversely impact its consolidated financial position, results of its operations and its cash flows in future periods.
Business Combinations
The Company accounts for acquisitions of businesses using the acquisition method of accounting where the cost is allocated to the underlying net tangible and intangible assets acquired, based on their respective estimated fair values. The excess of the purchase price over the estimated fair values of the net assets acquired is recorded as goodwill. Determining the fair value of certain acquired assets and liabilities is subjective in nature and often involves the use of significant estimates and assumptions, including, but not limited to, the selection of appropriate valuation methodologies, projected revenue, expenses and cash flows, weighted average cost of capital, discount rates, estimates of advertiser and publisher turnover rates and estimates of terminal values. Additionally, non-controlling interests in an acquired business, if any, are recorded at their acquisition date fair values. Business acquisitions are included in the Company’s consolidated financial statements as of the date of the acquisition. Refer to Note 3. Business Combinations for further information on the Company’s business acquisitions.
Investments in Equity Affiliates
Wireless Maritime Services, LLC (“WMS”)
In connection with the EMC Acquisition, the Company acquired a 49% equity interest in WMS. The remaining 51% equity interest in WMS is owned by an unaffiliated U.S. company (the “WMS third-party investor”) which is the managing member of
Global Eagle Entertainment Inc.
Notes to Consolidated Financial Statements
WMS and is responsible for its day-to-day management. Certain matters including determination of capital contributions and distributions and business plan revisions require approval of WMS’s board of directors, which consists of five voting members, three of which are from the WMS third-party investor and two of which are from the Company. Profits and losses for any fiscal year are allocated between the Company and the WMS third-party investor in proportion to their respective ownership interests, after giving effect to any special allocations made pursuant to the WMS operating agreement. EMC’s carrying value of the investment in WMS was adjusted to fair value as a result of the EMC Acquisition. The excess of the fair value over the underlying equity in net assets of WMS is primarily comprised of amortizable intangible assets and nonamortizable goodwill. The Company’s carrying value in its investment in WMS is subsequently adjusted for contributions, distributions and net income (loss) attributable to WMS, including the amortization of the cost basis difference associated with the amortizable intangible assets.
Santander Teleport S.L. (“Santander”)
Also in connection with the EMC Acquisition, the Company acquired an investment in a teleport in Santander, Spain, which provides various telecommunication services, including teleport and terrestrial services. The Company holds a 49% interest in Santander while the remaining 51% is held by an unaffiliated Spanish company (the “Santander third-party investor”). The Santander third-party investor is responsible for the day-to-day management of Santander. Certain matters including determination of capital contributions, capital expenditures over budget and distributions require approval of Santander’s board of directors, which consists of five voting members, three of which are from the Santander third-party investor and two of which are from the Company. Profits and losses for any fiscal year are allocated between the Company and the Santander third-party investor in proportion to their respective ownership interests. EMC’s carrying value of the investment in Santander approximated its fair value on the date the Company acquired EMC and is subsequently adjusted for contributions, distributions, and net income (loss) attributable to Santander.
Deferred Revenue
Deferred revenue consists substantially of amounts received from customers in advance of the Company’s performance service period and of fees deferred for future support services. Deferred revenue is recognized as revenue on a systematic basis that is proportionate to the period that the underlying services are rendered, which in a majority of arrangements is straight line over the remaining contractual term or estimated customer life of an agreement.
Derivative Financial Instruments
The Company recognizes all of its derivative instruments as either assets or liabilities at fair value in the Consolidated Balance Sheets. The accounting for changes in the fair value of a derivative instrument depends upon whether the derivative has been formally designated and qualifies as part of a hedging relationship under the applicable accounting standards and, further, on the type of hedging relationship. For derivatives formally designated as hedges, the Company assesses both at inception and quarterly thereafter, whether the hedging derivatives are highly effective in offsetting changes in either the fair value or cash flows of the hedged item. The Company’s derivatives that are not designated and do not qualify as hedges are adjusted to fair value through current earnings.
The Company’s public warrants issued in its initial public offering to non-sponsor shareholders (“Public SPAC Warrants”) and contingently issuable shares issuable in partial consideration for a legal settlement qualify as derivatives. These derivatives are not designated and do not qualify as hedges. As a result, the Company accounts for such derivatives as liability instruments which are fair valued at each reporting period. Changes in fair value of such derivatives are recognized in earnings.
Net Income (Loss) Per Share
Basic income (loss) per common share is computed using the weighted-average number of common shares outstanding during the period. Diluted income (loss) per share is computed using the weighted-average number of common shares and the dilutive effect of contingent shares outstanding during the period. Potentially dilutive contingent shares, which consist of stock options, restricted stock units (including performance stock units), liability warrants, warrants issued to third parties and accounted for as equity instruments, convertible senior notes and contingently issuable shares, have been excluded from the diluted income (loss) per share calculation when the effect of including such shares is anti-dilutive. Common shares to be issued upon the exercise of warrant instruments classified as liabilities are included in the calculation of diluted loss per share when dilutive.
Global Eagle Entertainment Inc.
Notes to Consolidated Financial Statements
Foreign Currency Translation
The Company translates the assets and liabilities of its non-U.S. dollar functional currency subsidiaries into U.S. dollars using exchange rates in effect at the end of each period. Revenue and expenses for these subsidiaries are translated using rates that approximate those in effect during the period. Gains and losses from these translations are recognized in foreign currency translation included in Accumulated other comprehensive loss in the Consolidated Balance Sheet. The Company’s subsidiaries that use the U.S. dollar as their functional currency remeasure monetary assets and liabilities at exchange rates in effect at the end of each period, and inventories, property and nonmonetary assets and liabilities at historical rates.
Income Taxes
Deferred income tax assets and liabilities are recognized for temporary differences between the financial statement carrying amounts of assets and liabilities and the amounts that are reported in the income tax returns. Deferred taxes are evaluated for realization on a jurisdictional basis. The Company records valuation allowances to reduce deferred tax assets to the amount that is more likely than not to be realized. In making this assessment, management analyzes future taxable income, reversing temporary differences and ongoing tax planning strategies. Should a change in circumstances lead to a change in judgment about the realizability of deferred tax assets in future years, the Company will adjust related valuation allowances in the period that the change in circumstances occurs, along with a corresponding increase or charge to income.
The Company recognizes the tax benefit from an uncertain tax position only if it is more likely than not that the tax position will be sustained upon examination by the taxing authorities based on the technical merits of the position. The tax benefit recognized in the financial statements for a particular tax position is based on the largest benefit that is more likely than not to be realized. The amount of unrecognized tax benefits (UTBs) is adjusted as appropriate for changes in facts and circumstances, such as significant amendments to existing tax law, new regulations or interpretations by the taxing authorities, new information obtained during a tax examination, or resolution of an examination. The Company recognizes both accrued interest and penalties associated with uncertain tax positions as a component of Income tax (benefit) expense in the Consolidated Statements of Operations.
Fair Value Measurements
The accounting guidance for fair value establishes a framework for measuring fair value and establishes a three-level valuation hierarchy for disclosure of fair value measurement. The valuation hierarchy is based upon the transparency of inputs to the valuation of an asset or liability as of the measurement date. The three levels are defined as follows:
| |
• | Level 1: Observable quoted prices in active markets for identical assets and liabilities. |
| |
• | Level 2: Observable quoted prices for similar assets and liabilities in active markets, quoted prices for identical or similar instruments in markets that are not active, and model-based valuation techniques for which all significant assumptions are observable in the market. |
| |
• | Level 3: Model-based techniques that use at least one significant assumption not observable in the market. These unobservable assumptions reflect estimates of assumptions that market participants would use in pricing the asset or liability. Valuation techniques include use of option pricing models, discounted cash flow models, and similar techniques. |
Fair value is defined as the price that would be received to sell an asset or paid to transfer a liability in an orderly transaction between market participants at the measurement date. The assets and liabilities which are fair valued on a recurring basis are described below and contained in the following tables. In addition, on a non-recurring basis, the Company may be required to record other assets and liabilities at fair value. These non-recurring fair value adjustments involve the lower of carrying value or fair value accounting and write-downs resulting from impairment of assets.
Global Eagle Entertainment Inc.
Notes to Consolidated Financial Statements
The following tables summarize the Company’s assets and liabilities measured at fair value on a recurring basis as of December 31, 2016, and 2015, respectively (in thousands, except as presented in footnotes to the tables):
|
| | | | | | | | | | | | | | | |
| December 31, 2016 | | Quotes Prices in Active Markets (Level 1) | | Significant Other Observable Inputs (Level 2) | | Significant Other Unobservable Inputs (Level 3) |
Liabilities: | | | | | | | |
Earn-out liability (1) | $ | 1,987 |
| | $ | — |
| | $ | — |
| | $ | 1,987 |
|
Liability warrants (2) | 433 |
| | — |
| | — |
| | 433 |
|
Contingently issuable shares (3) | 4,545 |
| | — |
| | — |
| | 4,545 |
|
Total | $ | 6,965 |
| | $ | — |
| | $ | — |
| | $ | 6,965 |
|
|
| | | | | | | | | | | | | | | |
| December 31, 2015 | | Quotes Prices in Active Markets (Level 1) | | Significant Other Observable Inputs (Level 2) | | Significant Other Unobservable Inputs (Level 3) |
Liabilities: | | | | | | | |
Earn-out liability (1) | $ | 9,652 |
| | $ | — |
| | $ | — |
| | $ | 9,652 |
|
Liability warrants (2) | 24,076 |
| | 24,076 |
| | — |
| | — |
|
Total | $ | 33,728 |
| | $ | 24,076 |
| | $ | — |
| | $ | 9,652 |
|
| |
(1) | Represents aggregate earn-out liabilities for the Company’s acquisitions of WOI, RMG, navAero and masFlight assumed in business combinations for the year ended December 31, 2015. |
| |
(2) | Includes 6,173,228 Public SPAC Warrants at December 31, 2016 and 2015. |
| |
(3) | In connection with the Sound-Recording Settlements, the Company is obligated to issue to UMG up to 0.5 million shares of its common stock when and if he closing price of the Company's common stock exceeds $10.00 per share and 0.4 million shares of common stock when and if the closing price of the Company’s common stock exceeds $12.00 per share. Based on conditions of the award, such contingently issuable shares are classified as liabilities and are remeasured to fair value each reporting period. |
Public SPAC Warrants. Through the quarter ended September 30, 2016, the fair value of the outstanding Public SPAC Warrants issued in its initial public offering, recorded as derivative warrant liabilities, was determined by the Company using the quoted market prices for the Public SPAC Warrants traded over the counter. During the quarter ended December 31, 2016, the Company determined that there was a significant decrease in transaction volume and level of activity. As a result, the Company transferred the Public SPAC Warrants from Level 1 to Level 3 of the valuation hierarchy and determined the fair value using the Black-Scholes option pricing model at the end of the reporting period. For the years ended December 31, 2016 and 2015, related to the change in the fair value of these warrants, the Company recorded income of $23.6 million and $11.9 million, respectively, and a loss of $7.0 million for the year ended December 31, 2014. The Public SPAC Warrants are included in Warrant liabilities on the Consolidated Balance Sheets. The change in value of these Public SPAC warrants is included in Change in fair value of derivatives in the Consolidated Statements of Operations.
Global Eagle Entertainment Inc.
Notes to Consolidated Financial Statements
The following tables present the fair value roll-forward reconciliation of Level 1 and 3 assets and liabilities measured at fair value for the years ended December 31, 2016 and 2015, respectively (in thousands):
|
| | | | | | | | | | | | | | | |
| Liability Warrants (Level 1) | | Liability Warrants (Level 3) | | Contingently Issuable Shares (Level 3) | | Earn-Out Liabilities (Level 3) |
Balance, December 31, 2015 | $ | 24,076 |
| | $ | — |
| | $ | — |
| | $ | 9,652 |
|
Fair value of contingently issuable shares associated with Sound-Recording Settlement | — |
| | — |
| | 6,417 |
| | — |
|
Payments of earn-out liability | — |
| | — |
| | — |
| | (4,127 | ) |
Transfer-in | — |
| | 6,235 |
| | — |
| | — |
|
Transfer-out | (6,235 | ) | | — |
| | — |
| | — |
|
Change in value | (17,841 | ) | | (5,802 | ) | | (1,872 | ) | | (3,538 | ) |
Balance, December 31, 2016 | $ | — |
| | $ | 433 |
| | $ | 4,545 |
| | $ | 1,987 |
|
|
| | | |
| Earn-Out Liabilities (Level 3) |
Balance, December 31, 2014 | $ | 1,710 |
|
Fair value of earn-out liability assumed in 2015 acquisitions | 9,652 |
|
Payments of earn-out liability | (1,519 | ) |
Non-cash adjustment to 2014 earn-out liability | (191 | ) |
Balance, December 31, 2015 | $ | 9,652 |
|
The valuation methodology used to estimate the fair value of the financial instruments in the tables above is summarized as follows:
Earn-Out Liability. The earn-out liabilities are estimated using the income approach. Based on the respective purchase agreements, management estimated the present value of best case, base case, and worst case scenarios. The sum of the discounted weighted average probabilities was used to arrive at the fair value of the earn-out liability. The current and non-current portions of the earn-out liabilities are included in Accounts payable and accrued liabilities and Other non-current liabilities, respectively, on the Consolidated Balance Sheets. The change in value of these earn-out liabilities is included in General and administrative in the Consolidated Statements of Operations.
Contingently Issuable Shares. The liabilities for these contingently issuable shares are included in Accounts payable and accrued liabilities on the December 31, 2016 Consolidated Balance Sheet. The fair values of these contingently issuable shares were determined using a quantitative put option method. The change in the fair value of the contingently issuable shares are included in Change in fair value of derivatives in the December 31, 2016 Consolidated Statement of Operations.
Global Eagle Entertainment Inc.
Notes to Consolidated Financial Statements
The following table presents information about significant unobservable inputs related to Level 3 financial liabilities as of December 31, 2016.
|
| | | | | | | | | | | |
| Liability Warrants | | Contingently Issuable Shares |
Assumed liquidation company share price | N/A |
| | $ | 10.00 |
| | $ | 12.00 |
|
Common stock price at December 31, 2016 | $ | 6.46 |
| | $ | 6.46 |
| | $ | 6.46 |
|
Exercise price | $ | 11.50 |
| | N/A |
| | N/A |
|
Estimated term (in years) | 1.09 |
| | 4.54 |
| | 6.44 |
|
Expected stock volatility | 34.0 | % | | 46.0 | % | | 46.0 | % |
Risk free rate | 0.9 | % | | N/A |
| | N/A |
|
Dividend yield | — | % | | — | % | | — | % |
Implied discount for lack of marketability (1) | — | % | | 20.5 | % | | 23.5 | % |
| |
(1) | A discount for lack of marketability was applied to the resulting values as the shares, when issued, may not initially be registered with the SEC. |
Summary of the Fair Values of Other Financial Instruments
Our other current financial assets and liabilities are recorded at book value, which approximate their fair values due to their short term nature.
The following table shows the carrying amounts of the Company’s long-term debt in the consolidated financial statements (in thousands):
|
| | | | | | | | | | | | | | | |
| December 31, 2016 | | December 31, 2015 |
| Carrying Amount | | Fair Value | | Carrying Amount | | Fair Value |
Senior secured term loan facility, due July 2021 | $ | 256,004 |
| | $ | 260,020 |
| | $ | — |
| | $ | — |
|
Senior secured revolving credit facility, due July 2020 | 53,891 |
| | 52,932 |
| | — |
| | — |
|
Senior secured term loan facility, due July 2022 | 88,082 |
| | 88,780 |
| | — |
| | — |
|
2.75% convertible senior notes, due February 2035 (1) | 69,024 |
| | 67,444 |
| | 68,335 |
| | 78,557 |
|
Other debts | 3,299 |
| | 3,299 |
| | 2,819 |
| | 2,819 |
|
| |
(1) | The fair value of the convertible senior notes is exclusive of the conversion feature, which was originally valued for reporting purposes at $13.0 million, and is included in Additional paid-in capital in the Consolidated Balance Sheets (see Note 13. Common Stock, Stock-Based Awards and Warrants). |
Senior Secured Credit Facilities: The majority of the senior secured credit facilities, which consist of senior secured term loan facility due July 2021, senior secured revolving credit facility due July 2020 and senior secured term loan facility due July 2022, was assumed in connection with the EMC Acquisition and was recorded at fair value on the EMC Acquisition Date. The estimated fair value of the term and revolving credit facilities, which are classified as Level 2 financial instruments, was determined based on quoted prices of the notes in an over-the-counter market as of December 31, 2016.
Convertible Senior Notes: The estimated fair value of the convertible senior notes, which are classified as Level 2 financial instruments, was determined based on the price of the notes in an over-the-counter market trade on December 31, 2016.
Other Debts: The estimated fair value of our other debts is considered to approximate carrying value given the short term maturity and are classified as Level 3 financial instruments.
Adoption of New Accounting Pronouncements
In February 2015, the Financial Accounting Standards Board (the “FASB”) issued Accounting Standards Update (“ASU”) No. 2015-02, Consolidation (Topic 810): Amendments to the Consolidation Analysis (“ASU 2015-02”). ASU 2015-02 amends the
Global Eagle Entertainment Inc.
Notes to Consolidated Financial Statements
consolidation guidance for variable interest entities and voting interest entities, among other items, by eliminating the consolidation model previously applied to limited partnerships, emphasizing the risk of loss when determining a controlling financial interest and reducing the frequency of the application of related-party guidance when determining a controlling financial interest. ASU 2015-02 is effective for periods beginning after December 15, 2015, for public companies. The adoption of ASU 2015-02 did not have a material impact on our consolidated financial statements.
In April 2015, the FASB issued ASU No. 2015-03, Interest—Imputation of Interest: Simplifying the Presentation of Debt Issuance Costs, amending the existing accounting standards for the presentation of debt issuance costs in the statement of financial position. The amendment requires debt issuance costs related to a recognized debt liability to be presented in the balance sheet as a direct deduction from the carrying amount of that debt liability, consistent with the treatment of a debt discount. The Company adopted this new standard in the first quarter of 2016 as required, applying it on a retrospective basis for all balance sheet periods presented.
The table below shows the effect of the reclassifications of unamortized debt issuance costs associated with the convertible senior notes and also capital lease obligation in the Company’s previously reported Consolidated Balance Sheet as of December 31, 2015 (in thousands):
|
| | | | | | | | | | | | | | | |
| As Reported | | Reclassifications | | As Reclassified |
| December 31, 2015 | | Capital Lease Obligation | | Unamortized Debt Issuance Costs | | December 31, 2015 |
Other non-current assets | $ | 13,702 |
| | $ | — |
| | $ | (1,678 | ) | | $ | 12,024 |
|
Long-term debt | 71,493 |
| | 284 |
| | (1,678 | ) | | 70,099 |
|
In September 2015, the FASB issued ASU 2015-16, Business Combinations (Topic 805): Simplifying the Accounting for Measurement-Period Adjustments (“ASU 2015-16”). ASU 2015-16 eliminates the requirement to retrospectively account for adjustments to provisional amounts within the measurement period recognized at the acquisition date in a business combination. ASU 2015-16 requires that these adjustments be recognized in the reporting period in which the adjustment amounts are determined and be calculated as if the accounting had been completed as of the acquisition date. ASU 2015-16 was effective prospectively for fiscal years, and for interim periods within those years, beginning after December 15, 2015. The adoption of this standard is reflected in Note 3. Business Combinations.
Recently Issued Accounting Pronouncements
In May 2017, the FASB issued ASU 2017-09, Compensation - Stock Compensation (Topic 718): Scope of Modification Accounting, which requires an entity to account for the effects of a modification unless (i) the fair value of the modified award is the same as the fair value of the original award immediately before the original award is modified, (ii) the vesting conditions of the modified award are the same as the vesting conditions of the original award immediately before the original award is modified and (iii) the classification of the modified award as an equity instrument or a liability instrument is the same as the classification of the original award immediately before the original award is modified. The amendment is effective for annual periods, and interim periods, within those annual periods, beginning after December 15, 2017. Early adoption is permitted, including adoption in any interim periods. Management is currently evaluating the impact of this standard on its consolidated financial statements.
In January 2017, the FASB issued ASU 2017-04, Intangibles—Goodwill and Others (Topic 350): Simplifying the Test for Goodwill Impairment, which eliminates Step 2 from the goodwill impairment test. Under the amendments, an entity should perform its annual, or interim, goodwill impairment test by comparing the fair value of a reporting unit with its carrying amount. An entity should recognize an impairment charge for the amount by which the carrying amount exceeds the reporting unit’s fair value; however, the loss recognized should not exceed the total amount of goodwill allocated to that reporting unit. This standard is effective for the annual or any interim goodwill impairment tests in fiscal years beginning after December 15, 2019 with early-adoption permitted. The Company intends to early-adopt this guidance as of January 1, 2017 on a prospective basis. The adoption of this update will have an adverse impact on the Consolidated Statements of Operations and Consolidated Balance Sheets.
Global Eagle Entertainment Inc.
Notes to Consolidated Financial Statements
In November 2016, the FASB issued ASU 2016-18, Statement of Cash Flows (Topic 230): Restricted Cash (a consensus of the FASB Emerging Issues Task Force), which requires that a statement of cash flows explains the change during the period in cash, cash equivalents, and amounts generally described as restricted cash. Amounts generally described as restricted cash should be included with cash and cash equivalents when reconciling the beginning-of-period and end-of-period total amounts shown on the statement of cash flows. The standard is effective for fiscal years, and for interim periods within those fiscal years, beginning after December 15, 2017, with early adoption permitted. Management is currently evaluating the impact of this standard on its consolidated financial statements.
In October 2016, the FASB issued ASU 2016-17, Consolidation (Topic 810): Interests Held through Related Parties That Are under Common Control, which amends the consolidation guidance on how a reporting entity that is the single decision maker of a variable interest entity (“VIE”) should treat indirect interests in the entity held through related parties that are under common control with the reporting entity when determining whether it is the primary beneficiary of that VIE. This standard is effective for fiscal years beginning after December 15, 2016, including interim periods within those fiscal years. Management is currently evaluating the impact of this standard on its consolidated financial statements.
In October 2016, the FASB issued ASU 2016-16, Income Taxes (Topic 740): Intra-Entity Transfers of Assets Other Than Inventory, which requires the recognition of income tax effects of intra-entity transfers of assets other than inventory when the transfer occurs. Current GAAP prohibits the recognition of those tax effects until the asset has been sold to an outside party. The standard is effective for fiscal years, and interim periods within those fiscal years, beginning after December 15, 2017, with early adoption permitted. Management is currently evaluating the timing of adoption and the effect on its consolidated financial statements.
In August 2016, the FASB issued ASU 2016-15, Classification of Certain Cash Receipts and Cash Payments (“ASU 2016-15”), which amends Accounting Standards Codification (“ASC”) 230, Statement of Cash Flows, the FASB’s standards for reporting cash flows in general-purpose financial statements. The amendments address the diversity in practice related to the classification of certain cash receipts and payments including contingent consideration payments made after a business combination and debt prepayment or debt extinguishment costs. ASU 2016-15 is effective for fiscal years, and interim periods within, beginning after December 15, 2017. Early adoption is permitted. Management is currently evaluating the impact of this standard on its consolidated financial statements.
In March 2016, the FASB issued ASU No. 2016-09, Compensation - Stock Compensation (Topic 781), Improvements to Employee Share-Based Payment Accounting (“ASU 2016-09”), which amends and simplifies the accounting for share-based payment awards in three areas: (1) income tax consequences, (2) classification of awards as either equity or liabilities, and (3) classification on the statement of cash flows. ASU 2016-09 is effective for annual periods beginning after December 15, 2016, and interim periods within those annual periods. Management is currently evaluating the impact of this standard on its consolidated financial statements.
In February 2016, the FASB issued ASU No. 2016-02, Leases (Topic 842) (“ASU 2016-02”). This update will require lease assets and lease liabilities to be recognized on the balance sheet and disclosure of key information about leasing arrangements. ASU 2016-02 is effective for the Company commencing in the first quarter of fiscal 2019 and must be adopted using a modified retrospective transition, and provides for certain practical expedients. Early adoption is permitted. Management is currently in preliminary assessment phase of the impact of the adoption of this standard on its consolidated financial statements.
In July 2015, the FASB issued ASU No. 2015-11, Inventory (Topic 330): Simplifying the Measurement of Inventory (“ASU 2015-11”). ASU 2015-11 requires that inventory measured using any method other than last-in, first out (“LIFO”) or the retail inventory method to be subsequently measured at the lower of cost or net realizable value, rather than at the lower of cost or market value. Under this ASU, subsequent measurement of inventory using the LIFO and retail inventory method is unchanged. ASU 2015-11 is effective prospectively for fiscal years, and for interim periods within those years, beginning after December 15, 2016. Early application is permitted. The Company is currently evaluating the impact of this ASU on its consolidated financial statements.
In May 2014, the FASB issued ASU 2014-09, Revenue from Contracts with Customers (Topic 606) (“ASU 2014-09”), which will supersede nearly all existing revenue recognition guidance under GAAP. The core principle of the guidance is that an entity should recognize revenue when it transfers promised goods or services to customers in an amount that reflects the consideration to which the company expects to be entitled in exchange for those goods or services. Further, the guidance requires improved disclosures to help users of financial statements better understand the nature, amount, timing and uncertainty of revenue that is recognized. The original effective date for ASU 2014-09 would have required the Company to adopt this standard beginning in
Global Eagle Entertainment Inc.
Notes to Consolidated Financial Statements
the first quarter of 2017. In July 2015, the FASB voted to amend ASU 2014-09 by approving a one-year deferral of the effective date as well as providing the option to early adopt the standard on the original effective date. The Company will adopt the standard in the first quarter of 2018. The new revenue standard may be applied retrospectively to each prior period presented or retrospectively with the cumulative effect recognized as of the date of adoption. Currently, management is in a preliminary assessment phase of the impact of the adoption of this standard on its consolidated financial statements.
Note 3. Business Combinations
2016 Transaction
Emerging Markets Communications
On July 27, 2016, the Company completed the EMC Acquisition. The acquisition date fair value consideration transferred to the member unit holders of EMC for all of their membership interests totaled approximately $166.3 million. This acquisition was intended to provide growth opportunities by expanding into a complementary maritime market in order to realize synergies by leveraging existing infrastructure and suppliers to achieve efficiencies and cost savings resulting from removing overlap in existing network infrastructure, reduced bandwidth costs, lower development expenses and integrating internal operations. The acquisition was also intended to achieve cross-selling opportunities for the Company’s content, digital media and operations solutions products into the maritime market.
The consideration for the EMC Acquisition consisted of the following (in thousands, except share amounts in the footnotes to the table):
|
| | | |
| Amount |
Cash consideration paid to seller (1) | $ | 100,454 |
|
Issuance of 5,466,886 shares of Company common stock (2) | 40,607 |
|
Deferred consideration (3) | 25,000 |
|
Settlement of pre-existing relationship | 228 |
|
Total | $ | 166,289 |
|
| |
(1) | In June 2017, the Company settled the working capital adjustments with the seller resulting in the release of $1.3 million from the adjustment escrow to the Company. |
| |
(2) | The fair value of the Company’s common stock issued as consideration was measured based on the stock price upon closing of the transaction on July 27, 2016, less a 7.5% discount for restriction on transferability. |
| |
(3) | On July 27, 2017, the Company elected to pay such amount in 5,080,049 newly issued shares of its common stock to the former unit holder of EMC. |
Global Eagle Entertainment Inc.
Notes to Consolidated Financial Statements
The following is a summary of the purchase price allocation to the estimated fair values of the identifiable assets acquired and the liabilities assumed at the EMC Acquisition date (dollars in thousands):
|
| | | | | | | | | | | | | |
| Weighted Average Useful Life (Years)(4) | | Preliminary | | Adjustments | | Final |
Cash and cash equivalents | | | $ | 9,032 |
| | $ | (824 | ) | | $ | 8,208 |
|
Restricted cash (1) | | | 17,802 |
| | (1,545 | ) | | 16,257 |
|
Other current assets (1) | | | 58,220 |
| | 2,405 |
| | 60,625 |
|
Property, plant and equipment (2) | | | 94,321 |
| | (12,101 | ) | | 82,220 |
|
Equity method investments (2)(3) | | | 102,719 |
| | 49,981 |
| | 152,700 |
|
Intangible assets (2): | | | | | | | |
Completed technology | 3.4 | | 21,800 |
| | (3,300 | ) | | 18,500 |
|
Customer relationships | 8.0 | | 19,100 |
| | 28,600 |
| | 47,700 |
|
Backlog | 3.0 | | — |
| | 18,300 |
| | 18,300 |
|
Favorable vendor agreements | 9.0 | | 91,800 |
| | (91,800 | ) | | — |
|
Trademarks | 5.0 | | 2,200 |
| | (1,200 | ) | | 1,000 |
|
Other non-current assets (1) | | | 1,074 |
| | 1,247 |
| | 2,321 |
|
Accounts payable and accrued liabilities (1) | | | (47,067 | ) | | (21,797 | ) | | (68,864 | ) |
Debt, including current (1) | | | (370,845 | ) | | (1,145 | ) | | (371,990 | ) |
Deferred tax liabilities, net (1) | | | (74,082 | ) | | 2,128 |
| | (71,954 | ) |
Unfavorable vendor contracts, including current (2) | | | — |
| | (13,500 | ) | | (13,500 | ) |
Deferred revenue, including current (1)(2) | | | (8,930 | ) | | 4,328 |
| | (4,602 | ) |
Other non-current liabilities (1)(2) | | | (22,170 | ) | | 12,691 |
| | (9,479 | ) |
Fair value of net assets acquired | | | (105,026 | ) | | (27,532 | ) | | (132,558 | ) |
Consideration transferred | | | 166,493 |
| | (204 | ) | | 166,289 |
|
Goodwill | | | $ | 271,519 |
| | $ | 27,328 |
| | $ | 298,847 |
|
| |
(1) | The amounts represent reclassifications to conform with the year-end presentation. |
| |
(2) | The amounts represent measurement period adjustments that were recorded as a result of further validating the fair value of acquired assets and assumed liabilities based on obtaining new facts and circumstances that existed as of the acquisition date. |
| |
(3) | Represents 49% investments in WMS and Santander. |
| |
(4) | The weighted average useful life in total is 5.9 years. |
Goodwill arising from the EMC Acquisition was allocated primarily to Maritime & Land Connectivity reporting unit, which was established as a result of the EMC Acquisition, and the remaining was allocated to the existing Aviation Connectivity and Media & Content reporting units based on the assessment of expected synergies these reporting units would benefit as a result of the EMC Acquisition. See Note 5. Goodwill for the amount allocated to each reporting unit. The allocation of fair value resulted in tax deductible goodwill of $74.9 million.
For the years ended December 31, 2016 and 2015, $15.4 million and $1.8 million, respectively, of transaction costs related to the EMC Acquisition, primarily consisting of legal and advisory fees, are classified in General and administrative in the Consolidated Statements of Operations.
The following unaudited pro forma summary presents consolidated information of EMC for the years ended December 31, 2016 and 2015 assuming the EMC Acquisition had occurred on January 1, 2015 (in thousands). The most significant pro forma adjustments were to reflect the (net of tax) impact of: (i) the amortization expenses related to intangibles; and (ii) the interest expense on the existing debt taking into account the fair value adjustment to the debt as of the EMC Acquisition Date. The unaudited pro forma financial information is for informational purposes only and may not necessarily reflect the actual results of operations
Global Eagle Entertainment Inc.
Notes to Consolidated Financial Statements
had the EMC Acquisition been consummated on January 1, 2015. These pro forma amounts are not designed to represent the future expected financial results of the Company.
|
| | | | | | | |
| Year Ended December 31, |
| 2016 | | 2015 |
Revenue | $ | 634,649 |
| | $ | 631,552 |
|
Net loss | (168,497 | ) | | (1,310 | ) |
The revenue and net loss of EMC included in the Company’s Consolidated Statements of Operations were $73.2 million and $94.8 million, respectively, from the acquisition date through December 31, 2016.
2015 Transactions
During the year ended December 31, 2015, the Company completed four acquisitions discussed further below. The fair values of these acquisitions, as set forth in the table below, were considered preliminary and subject to adjustment as of December 31, 2015. During the three months ended March 31, 2016, the Company revised its analysis of the fair value of the RMG asset acquisition. The revised analysis related to a pre-acquisition contingency that was subsequently identified resulting in the Company’s ability to recover amounts held in escrow by the seller of the RMG Assets. The fair value of the assets and liabilities of these acquisitions were finalized during the six months ended June 30, 2016.
The following table summarizes the fair value of the assets acquired and liabilities assumed in the acquisitions (dollars in thousands):
|
| | | | | |
| Weighted Average Useful Life (Years)(1) | | (Final)
December 31, 2016 |
Goodwill | | | $ | 40,281 |
|
Customer relationships | 7.6 | | 14,000 |
|
Developed technology | 5.7 | | 21,900 |
|
Trade name | 5.0 | | 200 |
|
Accounts receivable | | | 6,450 |
|
Property and equipment | | | 1,783 |
|
Deferred tax liability | | | (11,047 | ) |
Accrued expenses | | | (4,379 | ) |
Other liabilities assumed, net of assets acquired | | | (857 | ) |
Total consideration transferred | | | $ | 68,331 |
|
| |
(1) | The weighted average useful life in total is 6.4 years. |
Pro forma results of operations for these four acquisitions have not been presented because the effects of these business combinations, individually and in aggregate, are not material to our Consolidated Statements of Operations.
WOI Stock Purchase
On July 1, 2015, the Company acquired WOI for approximately $38.3 million in cash and $3.1 million in contingent consideration. WOI produces and licenses games and applications for global in-flight entertainment, provides technical services to third parties for global in-flight entertainment user interfaces. The acquisition was intended to augment and diversify the Company’s Media & Content operating segment. The goodwill recorded for the WOI acquisition was $19.6 million. Key factors that contributed to the recognition of WOI goodwill were trained workforce, expansion of international operations, the opportunity to consolidate and complement existing content operations, and the opportunity to generate future synergies within the existing Media & Content business. As a result of the stock purchase of WOI, the goodwill is not deductible for tax purposes.
Global Eagle Entertainment Inc.
Notes to Consolidated Financial Statements
Significant other assets and net liabilities assumed and included in the table above were approximately $4.1 million in accounts receivable, $9.1 million of deferred tax liabilities and $1.8 million of fixed assets that included two long-term office buildings lease arrangements. The net tax liability is made up of short-term deferred tax assets of $0.2 million and long-term deferred tax liabilities of $9.3 million, largely driven by the tax impact of the fair value of the intangible assets. The Company incurred approximately $0.5 million in transaction costs associated with the WOI purchase. The sellers of WOI have the opportunity to receive an additional $5.0 million in cash if, among other things, WOI achieves certain revenue and earnings targets within the first and second annual anniversaries of the closing date (the “WOI earn-out”). The fair value of the WOI earn-out as of the acquisition date was approximately $3.1 million. During the year ended December 31, 2016, the Company paid additional consideration of $2.5 million upon the achievement of the first anniversary revenue and earnings targets. As of December 31, 2016, the fair value of the WOI earn-out of $0.9 million was included in Accounts payable and accrued liabilities in the Consolidated Balance Sheets.
The amount of revenue for WOI included in the Consolidated Statement of Operations for the year ended December 31, 2015 was $5.9 million.
RMG Asset Acquisition
On July 1, 2015, the Company acquired certain assets and assumed certain liabilities of RMG Networks Holding Corporation (“RMG”) for approximately $1.4 million in cash. These assets were integrated into the Company’s advertising and sponsorship team, which provides digital media advertising and related services through executive clubs, in-flight entertainment systems, in-flight Wi-Fi portals and in private terminals. The acquisition is intended to enhance the Company’s digital media offerings within its Media & Content operating segment. The goodwill recorded for the acquisition of assets from RMG, after the adjustment recorded during the measurement period, was $1.4 million. Key factors that contributed to the recognition of goodwill were the opportunity to expand the Company’s digital media offerings to the travel industry, the opportunity to consolidate and complement existing Media & Content operations, and the opportunity to generate future synergies with our existing business. As a result of the asset purchase, the goodwill is deductible for tax purposes.
Significant other assets and net liabilities assumed and included in the table above were approximately $2.2 million in accounts receivable, $3.1 million of revenue share liabilities and a $1.3 million provision for losses on a specific loss contract expiring in December 2015. The Company incurred approximately $0.2 million in transaction costs associated with the acquisition of assets from RMG. .
The amount of revenue for RMG included in the Consolidated Statement of Operations for the year ended December 31, 2015 was $4.6 million.
navAero, Inc. Stock Purchase
On August 4, 2015, the Company acquired NavAero Holding AB (“navAero”) for approximately $4.8 million in cash and $0.3 million in contingent consideration. navAero is engaged in developing and commercializing technologies to enable and deploy electronic flight bag solutions for the commercial aviation market, which allows airlines to improve their in-flight operations. The acquisition is intended to enhance the Company’s Connectivity operating segment. The goodwill recorded for the navAero acquisition was $3.2 million. Key factors that contributed to the recognition of navAero goodwill were trained workforce, expansion of international operations, the opportunity to expand into new product and technology offerings within the airline industry, and to a lesser extent the opportunity to generate future synergies with our existing business. As a result of the stock purchase of navAero, the goodwill is not deductible for tax purposes.
Significant other assets and net liabilities assumed included a net tax liability of $0.5 million, which is made up of short-term deferred tax assets of $0.1 million and long-term deferred tax liabilities of $0.6 million. The Company incurred approximately $0.3 million in transaction costs associated with the navAero purchase. The sellers of navAero had the opportunity to receive an additional $1.0 million in cash if navAero achieves certain revenue targets through December 31, 2016 (the “navAero earn-out”). There were no additional payments made to the sellers through December 31, 2016. As of December 31, 2016, the fair value of contingent consideration of $0.2 million was included in Accounts payable and accrued liabilities in the Consolidated Balance Sheets.
Global Eagle Entertainment Inc.
Notes to Consolidated Financial Statements
The amount of revenue for navAero included in the Consolidated Statement of Operations for the year ended December 31, 2015 was $2.4 million.
masFlight, Inc. Stock Purchase
On August 4, 2015, the Company acquired Marks Systems, Inc. doing business as masFlight for approximately $10.3 million in cash and $9.3 million in contingent consideration. The acquisition was completed as a merger resulting in the acquisition subsidiary, masFlight Inc. (“masFlight”) as the surviving corporation. masFlight pioneered the adoption of cloud-based technologies to collect, compile, link, validate and host a variety of information and offer a single solution enabling airlines to analyze predictive data to run their operations more effectively and efficiently. The acquisition is intended to enhance the Company’s Connectivity operating segment. The goodwill recorded for the masFlight acquisition was $16.1 million. Key factors that contributed to the recognition of masFlight goodwill were trained workforce, expansion into new operations data solutions offerings, the opportunity to consolidate and complement current connectivity operations within the airline industry as well as expand into new industries, and the opportunity to generate future savings through synergies with our existing business. As a result of the acquisition, the goodwill is not deductible for tax purposes.
Significant other assets and net liabilities assumed included a net tax liability of $1.4 million, which is made up of net short-term deferred tax assets of $0.3 million and long-term deferred tax liabilities of $1.7 million. The Company incurred approximately $0.3 million in transaction costs associated with the masFlight purchase. The sellers of masFlight have the opportunity to receive up to an additional $20.0 million in cash if, among other things, masFlight achieves certain operational, revenue and earnings targets at various dates through December 31, 2019. As a portion of the contingent consideration is subject to future employment of certain key employee of masFlight, certain contingent consideration will be recorded as compensation expense after the acquisition date. The fair value of masFlight contingent consideration as of the acquisition date was $9.3 million. During the year ended December 31, 2016, consideration totaling $1.7 million was paid to the sellers upon the achievement of the targets. As of December 31, 2016, the fair value of the contingent consideration of $0.9 million was included in Accounts payable and accrued liabilities in the Consolidated Balance Sheets.
The amount of revenue for masFlight included in the Consolidated Statement of Operations for the year ended December 31, 2015 was less than $1.0 million.
2014 Transactions
Purple Inflight Entertainment Asset Purchase
On August 2, 2014, the Company purchased substantially all of the assets of Purple Inflight Entertainment (“Purple”) to further expand its ability to deliver Indian content in local languages. Pursuant to the terms of the purchase, which was accounted for as a business combination, the Company acquired such assets of Purple in exchange for approximately $0.5 million in cash. In addition, the Company made an additional payment to the stockholders of Purple of $0.2 million in 2014 that was contingent upon the renewal of the terms of a certain supplier’s contract. The estimated fair value of the contingent consideration obligation amounted to $0.1 million as of the acquisition date and was determined using a probability factor of 70% for the renewal of the supplier’s contract. There are no further contingent consideration obligation in connection with this acquisition.
The Company allocated the consideration to acquire Purple to finite-lived intangible assets (supplier’s relationship) of $0.2 million with an estimated useful life of approximately one year, $0.4 million to goodwill and other net liabilities of less than $0.1 million. The amount of revenue for Purple included in the Consolidated Statements of Operations for the years ended December 31, 2015 and 2014 was not material.
Global Eagle Entertainment Inc.
Notes to Consolidated Financial Statements
Note 4. Property, Plant and Equipment, net
Property, plant and equipment, net, consisted of the following (in thousands):
|
| | | | | | | |
| December 31, |
| 2016 | | 2015 |
Leasehold improvements | $ | 5,737 |
| | $ | 3,886 |
|
Furniture and fixtures | 1,332 |
| | 2,154 |
|
Equipment (3) | 86,339 |
| | 21,043 |
|
Computer equipment | 8,002 |
| | 6,967 |
|
Computer software (1) | 18,207 |
| | 8,677 |
|
Automobiles | 325 |
| | 255 |
|
Buildings | 7,039 |
| | 2,649 |
|
Albatross (aircraft) | 425 |
| | 425 |
|
Satellite transponder (2) | 62,131 |
| | 6,700 |
|
Construction in-progress (3) | 8,380 |
| | 6,319 |
|
Total property, plant, and equipment | 197,917 |
| | 59,075 |
|
Accumulated depreciation (1) (2) (3) | (31,868 | ) | | (20,009 | ) |
Property, plant and equipment, net | $ | 166,049 |
| | $ | 39,066 |
|
| |
(1) | Includes computer software acquired under capital leases of $1.0 million and $0.9 million and related accumulated amortization of $0.4 million and $0.1 million as of December 31, 2016 and 2015. |
| |
(2) | Includes satellite transponders acquired under capital leases of $2.0 million and the related accumulated depreciation of $0.6 million as of December 31, 2016. There was no satellite transponders acquired under capital leases as of December 31, 2015. |
| |
(3) | Includes internally developed software of $10.7 million and $7.6 million and related accumulated amortization of $6.3 million and $2.7 million as of December 31, 2016 and 2015, respectively. Amortization expense for the years ended December 31, 2016, 2015 and 2014 was $3.6 million, $1.7 million and $0.8 million, respectively. Impairment loss for the year ended December 31, 2016 was $4.1 million included in the Consolidated Statements of Operations. There were no impairment losses during the years ended December 31, 2015 and 2014. During the years ended December 31, 2016, 2015 and 2014, the Company capitalized software development costs totaling $5.0 million, $3.3 million and $3.3 million, respectively. |
Depreciation expense for property, plant and equipment, including software amortization expense and amortization of assets under capital leases, for the years ended December 31, 2016, 2015, and 2014 is as follows (in thousands):
|
| | | | | | | | | | | |
| Year Ended December 31, |
| 2016 | | 2015 | | 2014 |
Consolidated Statement of Operations Classification: | | | | | |
Cost of sales | $ | 10,855 |
| | $ | 2,957 |
| | $ | 2,820 |
|
Sales and marketing | 1,793 |
| | 893 |
| | 471 |
|
Product development | 2,186 |
| | 1,443 |
| | 858 |
|
General and administrative | 6,677 |
| | 4,154 |
| | 3,030 |
|
Total | $ | 21,511 |
| | $ | 9,447 |
| | $ | 7,179 |
|
Note 5. Goodwill
The changes in the carrying amounts of goodwill by segment are as follows (in thousands):
Global Eagle Entertainment Inc.
Notes to Consolidated Financial Statements
|
| | | | | | | | | | | | | | | |
| Aviation Connectivity | | Maritime & Land Connectivity | | Media & Content | | Total |
Balance as of December 31, 2014 | $ | — |
| | $ | — |
| | $ | 53,014 |
| | $ | 53,014 |
|
Goodwill related to acquisitions | 19,298 |
| | — |
| | 21,795 |
| | 41,093 |
|
Foreign currency translation and other | (25 | ) | | — |
| | (286 | ) | | (311 | ) |
Balance as of December 31, 2015 | 19,273 |
| | — |
| | 74,523 |
| | 93,796 |
|
Goodwill related to the EMC acquisition | 78,764 |
| | 210,380 |
| | 9,703 |
| | 298,847 |
|
Impairment loss | — |
| | (64,000 | ) | | — |
| | (64,000 | ) |
Adjustment to RMG goodwill | — |
| | — |
| | (812 | ) | | (812 | ) |
Foreign currency translation | — |
| | — |
| | 5 |
| | 5 |
|
Balance as of December 31, 2016 |
|
| |
|
| |
|
| |
|
|
Gross carrying amount | 98,037 |
| | 210,380 |
| | 83,419 |
| | 391,836 |
|
Accumulated impairment loss | — |
| | (64,000 | ) | | — |
| | (64,000 | ) |
Balance as of December 31, 2016, net | $ | 98,037 |
| | $ | 146,380 |
| | $ | 83,419 |
| | $ | 327,836 |
|
Refer to Note 3. Business Combinations for the details of goodwill that arose from the EMC Acquisition in 2016 and WOI, RMG, navAero and masFlight acquisitions in 2015 and for changes during the years ended December 31, 2016 and 2015 affecting goodwill. During the year ended December 31, 2016, the Company determined that the goodwill relating to the Maritime & Land Connectivity reporting unit was impaired due to the conclusion during the fourth quarter that the estimated internal financial projections for this reporting unit would be lower than previously anticipated. Refer to Note 2. Basis of Presentation and Summary of Significant Accounting Policies for the details on further reasons of impairment. Therefore, the Company recognized an impairment loss of $64.0 million during the year ended December 31, 2016. There was no goodwill impairment recognized in the years ended December 31, 2015 and 2014.
Subsequent to December 31, 2016, due to the significant decline in our stock price and other events that had occurred during the first quarter of 2017, the Company assessed its goodwill for impairment as of March 31, 2017 by applying the recently adopted accounting standard ASU 2017-04, which eliminated the Step Two from the goodwill impairment test. The Company will recognize goodwill impairment preliminarily estimated between $75.0 million and $80.0 million in the Maritime & Land Connectivity reporting unit as of March 31, 2017. The Company has not closed its books for any periods subsequent to December 31, 2016. As stated above, the Company expects to have a significant impairment during the quarter ended March 31, 2017 and may have additional impairment charges in later periods after completing its impairment assessments for these periods.
Had ASU 2017-04 been available for adoption for the year ended December 31, 2016, the Company would have recognized a goodwill impairment charge of $91.1 million during the year-ended December 31, 2016.
Note 6. Intangible Assets, net
As a result of historical business combinations, the Company acquired finite-lived intangible assets that are primarily amortized on a straight-line basis, which approximate their expected cash flow patterns. The Company’s finite-lived intangible assets have assigned useful lives ranging from 2.0 to 10.0 years.
Global Eagle Entertainment Inc.
Notes to Consolidated Financial Statements
Intangible assets, net, consisted of the following (in thousands):
|
| | | | | | | | | | | | | |
| | | December 31, 2016 |
| Weighted Average Useful Lives | | Gross Carrying Amount | | Accumulated Amortization | | Net Carrying Amount |
Existing technology - software | 4.8 years | | $ | 43,019 |
| | $ | 9,842 |
| | $ | 33,177 |
|
Existing technology - games | 5.0 years | | 12,331 |
| | 9,659 |
| | 2,672 |
|
Developed technology | 8.0 years | | 7,317 |
| | 2,973 |
| | 4,344 |
|
Customer relationships | 7.9 years | | 170,716 |
| | 61,579 |
| | 109,137 |
|
Backlog | 3.0 years | | 18,300 |
| | 2,542 |
| | 15,758 |
|
Other | 4.5 years | | 3,702 |
| | 2,070 |
| | 1,632 |
|
Total | | | $ | 255,385 |
| | $ | 88,665 |
| | $ | 166,720 |
|
|
| | | | | | | | | | | | | |
| | | December 31, 2015 |
| Weighted Average Useful Lives | | Gross Carrying Amount | | Accumulated Amortization | | Net Carrying Amount |
Existing technology - software | 5.8 years | | $ | 24,474 |
| | $ | 2,978 |
| | $ | 21,496 |
|
Existing technology - games | 5.0 years | | 12,331 |
| | 7,193 |
| | 5,138 |
|
Developed technology | 8.0 years | | 7,317 |
| | 2,058 |
| | 5,259 |
|
Customer relationships | 7.5 years | | 133,566 |
| | 50,184 |
| | 83,382 |
|
Other | 3.7 years | | 7,399 |
| | 4,990 |
| | 2,409 |
|
Total | | | $ | 185,087 |
| | $ | 67,403 |
| | $ | 117,684 |
|
The Company expects to record amortization of the intangible assets as follows (in thousands):
|
| | | |
Year Ending December 31, | Amount |
2017 | $ | 44,001 |
|
2018 | 38,486 |
|
2019 | 28,691 |
|
2020 | 22,307 |
|
2021 | 13,826 |
|
Thereafter | 19,409 |
|
Total | $ | 166,720 |
|
The Company recorded amortization expense of $35.6 million, $27.0 million and $24.6 million for the years ended December 31, 2016, 2015 and 2014, respectively. In addition, amortization expense of $0.2 million and $2.7 million from content library (acquired in business combination) is included in Cost of sales in the Consolidated Statements of Operations for the years ended December 31, 2015 and 2014, respectively.
Note 7. Equity Method Investments
In connection with the EMC Acquisition, the Company acquired 49% interests in WMS and Santander. Following is the summarized financial information for such equity method investments on an aggregated basis from the EMC Acquisition Date through December 31, 2016 (in thousands):
Global Eagle Entertainment Inc.
Notes to Consolidated Financial Statements
|
| | | |
| December 31, 2016 |
Current assets | $ | 30,837 |
|
Non-current assets | 21,822 |
|
Current liabilities | 20,455 |
|
Non-current liabilities | 1,307 |
|
|
| | | |
| Year Ended |
| December 31, 2016 |
Revenue | $ | 64,637 |
|
Operating expenses | 51,240 |
|
Net income | 13,397 |
|
As of December 31, 2016, there was an aggregate difference of $141.1 million between the carrying amounts of these investments and the amounts of underlying equity in net assets in these investments. The difference was determined by applying the acquisition method of accounting in connection with the EMC Acquisition and is being amortized ratably over the life of the related acquired intangible assets. The weighted-average life of the intangible assets in total was 14.9 years. There were no equity method investments as of and for the year ended December 31, 2015.
Note 8. Investments in Securities
During the year ended December 31, 2016, the Company purchased and sold approximately $16.5 million of investment securities and recognized a de minimis gain from the sale.
During the year ended December 31, 2015, the Company sold investment securities for proceeds of approximately $3.3 million and recognized a de minimis gain from the sale.
During the year ended December 31, 2014, the Company sold approximately $0.6 million of investment securities and recognized a gain of approximately $0.1 million.
Note 9. Accounts Payable and Accrued Liabilities
Accounts payable and accrued liabilities consisted of the following (in thousands):
|
| | | | | | | |
| December 31, |
| 2016 | | 2015 |
Accounts payable | $ | 67,562 |
| | $ | 27,622 |
|
Content license and royalties | 53,008 |
| | 57,143 |
|
Deferred consideration for EMC Acquisition | 25,000 |
| | — |
|
Accrued legal settlements | 17,291 |
| | 6,200 |
|
Accrued payroll obligations | 12,251 |
| | 9,492 |
|
Deferred acquisition earn-out liability | 1,883 |
| | 5,105 |
|
Other accrued expenses | 63,349 |
| | 12,662 |
|
Total | $ | 240,344 |
| | $ | 118,224 |
|
Note 10. Financing Arrangements
Global Eagle Entertainment Inc.
Notes to Consolidated Financial Statements
The following table sets forth the summary of the Company’s outstanding indebtedness (in thousands):
|
| | | | | | | |
| December 31, |
| 2016 | | 2015 |
Senior secured term loan facility, due July 2021 | $ | 263,980 |
| | $ | — |
|
Senior secured revolving credit facility, due July 2020 | 55,500 |
| | — |
|
Senior secured term loan facility, due July 2022 | 92,000 |
| | — |
|
2.75% convertible senior notes, due February 2035 | 82,500 |
| | 82,500 |
|
Other debts | 3,299 |
| | 2,819 |
|
Unamortized bond discounts, fair value adjustments and issue costs, net | (26,979 | ) | | (14,165 | ) |
Total carrying value of debt | 470,300 |
| | 71,154 |
|
Less: current portion, net | (2,069 | ) | | (1,055 | ) |
Total noncurrent debt | $ | 468,231 |
| | $ | 70,099 |
|
Convertible Senior Notes
In February 2015, the Company issued an aggregate principal amount of $82.5 million of convertible senior notes due in 2035 (the “Convertible Notes”) in a private placement. The Convertible Notes were issued at par, pay interest semi-annually in arrears at an annual rate of 2.75% and mature on February 15, 2035, unless earlier repurchased, redeemed or converted pursuant to the terms of the Convertible Notes. In certain circumstances and subject to certain conditions, the Convertible Notes are convertible at an initial conversion rate of 53.9084 shares of common stock per $1,000 principal amount of notes (which represents an initial conversion price of approximately $18.55 per share), subject to adjustment. Holders of the Convertible Notes may convert their Convertible Notes at their option at any time prior to the close of business on the business day immediately preceding November 15, 2034, only if one or more of the following conditions has been satisfied: 1) during any calendar quarter beginning after March 31, 2015 if the closing price of the Company’s common stock equals or exceeds 130% of the respective conversion price per share during a defined period at the end of the previous quarter, 2) during the five consecutive business day period immediately following any five consecutive trading day period in which the trading price per $1,000 principal amount of Convertible Notes for each trading day was less than 98% of the product of the last reported sale price of the Company’s common stock and the conversion rate on each such trading day, 3) if specified corporate transactions occur, or 4) if the Company calls any or all of the Convertible Notes for redemption, at any time prior to the close of business on the second business day immediately preceding the redemption date. On or after November 15, 2034, until the close of business on the second scheduled trading day immediately preceding the maturity date, a holder may convert all or a portion of its Convertible Notes at any time, regardless of the foregoing circumstances.
On February 20, 2022, February 20, 2025 and February 20, 2030 and if the Company undergoes a “fundamental change” (as defined in the indenture governing the Convertible Notes (the “Indenture”)), subject to certain conditions, a holder will have the option to require the Company to repurchase all or a portion of its Convertible Notes for cash at a repurchase price equal to 100% of the principal amount of the Convertible Notes to be repurchased, plus any accrued and unpaid interest, if any, to, but excluding, the relevant repurchase date. In addition, upon the occurrence of a “make-whole fundamental change” (as defined in the Indenture) or if the Company delivers a redemption notice prior to February 20, 2022, the Company will, in certain circumstances, increase the conversion rate for a holder that converts its Convertible Notes in connection with such make-whole fundamental change or redemption notice, as the case may be.
The Company may not redeem the Convertible Notes prior to February 20, 2019. The Company may, at its option, redeem all or part of the Convertible Notes at any time (i) on or after February 20, 2019 if the last reported sale price per share of the Company’s common stock has been at least 130% of the conversion price then in effect for at least 20 trading days during any 30 consecutive trading day period ending on, and including, the trading day immediately preceding the date on which the Company provides written notice of redemption and (ii) on or after February 20, 2022 regardless of the sale price condition described in clause (i), in each case, at a redemption price equal to 100% of the principal amount of the Convertible Notes to be redeemed, plus accrued and unpaid interest to, but excluding, the redemption date. Upon conversion of any Convertible Note, the Company shall pay or deliver to the converting Holder, cash, shares of Common Stock or a combination of cash and shares of the Company’s common stock, at the Company’s election.
Global Eagle Entertainment Inc.
Notes to Consolidated Financial Statements
The Company separated the notes into liability and equity components. The carrying amount of the liability component of $69.5 million was calculated by measuring the fair value of similar liabilities that do not have an associated convertible feature. The carrying amount of the equity component was calculated to be $13.0 million, and represents the conversion option which was determined by deducting the fair value of the liability component from the principal amount of the notes. This difference represents a debt discount that is amortized to interest expense over the term of the Convertible Notes. The equity component is not remeasured as long as it continues to meet the conditions for equity classification.
In accounting for the direct transaction costs (the “issuance costs”) related to the Convertible Notes, the Company allocated the total amount of issuance costs incurred to the liability and equity components based on their relative values. The Company recorded issuance costs of $1.8 million and $0.3 million to the liability and equity components, respectively. Issuance costs, including fees paid to the initial purchasers who acted as intermediaries in the placement of the Convertible Notes, attributable to the liability component are presented in the Consolidated Balance Sheets as a direct deduction from the carrying amount of the debt instrument and are amortized to interest expense over the term of the Convertible Notes in the Consolidated Statements of Operations, and the issuance costs attributable to the equity component were netted with the equity component and included within Additional paid-in capital in the Consolidated Balance Sheets. Interest cost related to the amortization expense of the issuance costs associated with the liability component was not material for the year ended December 31, 2016 and the period from February 2015 to December 31, 2015. The Convertible Notes do not have any financial covenants requirements the Company needs to comply.
As of December 31, 2016 and 2015, the outstanding principal on the Convertible Notes was $82.5 million, and the carrying amount of the liability component, net of the unamortized debt issuance costs and discount associated with the equity component, was $69.0 million and $68.3 million, respectively. The effective interest rate on the liability component for the year ended December 31, 2016 and the period from February 2015 through December 31, 2015 was 4.2% and 3.7%, respectively. Interest costs recognized relating to the contractual interest coupon was $2.3 million and $2.0 million for the year ended December 31, 2016 and the period February 2015 through December 31, 2015, respectively. Amortization of the discount on the liability component was $0.6 million and $0.5 million for the year ended December 31, 2016 and the period from February 2015 through December 31, 2015, respectively.
Subsequent to December 31, 2016, the Company became non-compliant with its obligations in the Indenture relating to the delivery to the Indenture trustee of the Company’s 2016 annual financial statements and interim financial statements for the quarters ended March 31, June 30 and September 30, 2017. As a result, immediately after the occurrence of the Event of Default (as defined in the Indenture) relating to the Company’s failure to timely deliver each of its 2016 annual financial statements and March 31, June 30 and September 30, 2017 interim financial statements, as applicable, and through such time as the noncompliance is continuing, the Company will incur additional interest on the Convertible Notes at a rate equal to (i) 0.25% per annum of the principal amount of the Convertible Notes outstanding for each day during the first 90 days after the occurrence of each Event of Default and (ii) 0.50% per annum of the principal amount of the Convertible Notes outstanding from the 91st day until the 180th day following the occurrence of each such Event of Default. However, the maximum additional interest is capped at 0.50% per annum irrespective of how many Events of Default are in existence at any time for the Company’s failure to deliver any required financial statements. On the 181st day after each Event of Default (such 181st date, the “Notes Acceleration Date”), the Convertible Notes will be immediately due and payable if the noncompliance is not cured or waived by such date and the noteholders elect to so accelerate. For the interim financial statements for the quarters ended March 31 and June 30, 2017, the Notes Acceleration Date will occur in February 2018 and May 2018, respectively. For the interim financial statements for the quarter ended September 30, 2017, the Notes Acceleration Date will occur in July 2018, assuming that the trustee delivers its notice of default relating thereto to the Company in mid-November 2017. The Company cured the Event of Default relating to the delivery of the 2016 annual financial statements upon filing this Form 10-K.
Senior Secured Credit Facilities
In connection with the EMC Acquisition, the Company assumed and became guarantor of the legacy EMC indebtedness comprising (i) a First Lien Credit Agreement, dated as of July 1, 2015, as amended, by and among Emerging Markets Communications, LLC, Morgan Stanley Senior Funding, Inc., as the Administrative Agent, the guarantors party thereto and the lenders from time to time party thereto (as amended, modified or otherwise supplemented from time to time, the “First Lien Credit Agreement”) and (ii) a Second Lien Credit Agreement, dated as of July 1, 2015, as amended, by and among the Borrower, Morgan Stanley Senior Funding, Inc., as the Administrative Agent, the guarantors party thereto and the lenders from time to time party thereto (as amended, modified or otherwise supplemented from time to time, the “Second Lien Credit Agreement” and together with the First Lien Credit Agreement, the “Credit Facilities”).
Global Eagle Entertainment Inc.
Notes to Consolidated Financial Statements
The First Lien Credit Agreement provides for loans in an original aggregate principal amount not to exceed $303.0 million, comprised of term loans (the “First Lien Term Loans”) and revolving loans (the “First Lien Revolving Loans” and together with the First Lien Term Loans, the “First Lien Loans”). Under an Amendment No. 1 to First Lien Credit Agreement dated May 9, 2016 and an Incremental Amendment dated June 29, 2016, the total revolving facility capacity under the First Lien Credit Agreement was increased from $35.0 million to $75.5 million. As of the closing of the EMC Acquisition, the outstanding principal amounts of First Lien Term Loans and First Lien Revolving Loans were $265.3 million and $28.0 million, respectively. The remaining availability under First Lien Revolving Loans as of December 31, 2016 was $16.7 million. Subject to certain exceptions, First Lien Term Loans bear interest on the outstanding principal amount thereof from the applicable borrowing date at a rate per annum equal to (i) the Base Rate (as defined in the First Lien Credit Agreement) plus 4.75% or (ii) at a rate per annum equal to the Eurocurrency Rate for each Interest Period (as defined in the First Lien Credit Agreement) plus 5.75%. Amounts borrowed under the First Lien Term Loans that are repaid or prepaid may not be re-borrowed. In addition, the First Lien Credit Agreement requires quarterly principal payments of 0.25% of the aggregate principal amount outstanding of First Lien Term Loans, subject to reduction as a result of the application of prepayments or cancellation of indebtedness in accordance with the terms of the First Lien Credit Agreement. First Lien Revolving Loans bear interest at a rate based on the Base Rate, Eurocurrency Rate or EURIBOR Rate, each as defined in the First Lien Credit Agreement (each such loan a “EURIBOR Rate Loan”). Subject to certain exceptions, First Lien Revolving Loans bear interest at varying rates based on the Consolidated First Lien Net Leverage Ratio (as defined in the First Lien Credit Agreement), which ratio ranges from greater than 3.50:1.00 (corresponding to a higher interest rate) to less than or equal to 3.00:1.00 (corresponding to a lower interest rate). The obligations of the First Lien Lenders to make loans under the First Lien Credit Agreement is subject to customary conditions precedent. Subject to certain conditions, the First Lien Loans may be voluntarily prepaid at any time without penalty or premium. The First Lien Credit Agreement also provides for mandatory prepayments relating to excess cash flow, asset dispositions, incurrence of indebtedness and casualty events, all subject to customary exceptions, conditions and qualifications. The First Lien Credit Agreement also provides for the issuance of letters of credit in the amount equal to the lesser of $10.0 million and the aggregate amount of revolving facility capacity. As of December 31, 2016, the Company had outstanding letters of credit of $3.3 million under the First Lien Credit Agreement.
The First Lien Credit Agreement contains customary affirmative and negative covenants, as well as a financial covenant which requires that the Company maintain a certain maximum Consolidated First Lien Net Leverage Ratio (as defined in the First Lien Credit Agreement) measured at the end of each fiscal quarter for the life of the First Lien Loans, which Consolidated First Lien Net Leverage Ratio shall not exceed 3.75 to 1.00 through the fourth fiscal quarter of 2017, 3.50 to 1.00 for each fiscal quarter in 2018, 3.25 to 1.00 for each fiscal quarter in 2019 and 3.00 to 1.00 for each fiscal quarter thereafter until the Latest Maturity Date (as defined in the First Lien Credit Agreement). The First Lien Term Loans mature on June 30, 2021. The First Lien Revolving Loans mature on June 30, 2020.
The Second Lien Credit Agreement provides for term loans (each such loan a “Second Lien Term Loan”) in an original aggregate principal amount not to exceed $92.0 million. As of the closing of the EMC Acquisition, the outstanding principal amount of Second Lien Term Loans was $92.0 million. Second Lien Term Loans bear interest at a rate based on (i) the Base Rate, as defined in the Second Lien Credit Agreement (each such loan, a “Second Lien Base Rate Loan”), or (ii) the Eurocurrency Rate, as defined in the Second Lien Credit Agreement (each such loan, a “Second Lien Eurocurrency Loan”). Subject to certain exceptions set forth in the Second Lien Credit Agreement, (i) each Second Lien Base Rate Loan bears interest on the outstanding principal amount thereof from the applicable borrowing date at a rate equal to the Base Rate plus 8.625% and (ii) each Second Lien Eurocurrency Loan bears interest on the outstanding principal amount thereof for each Interest Period (as defined in the Second Lien Credit Agreement) at a rate equal to the Eurocurrency Rate for such Interest Period plus 9.625%. Amounts borrowed under the Second Lien Credit Agreement that are repaid or prepaid are not permitted to be re-borrowed.
The Second Lien Credit Agreement provides for mandatory prepayments relating to excess cash flow, asset dispositions, incurrence of indebtedness and casualty events, all subject to customary exceptions, conditions and qualifications. The Second Lien Credit Agreement contains customary affirmative and negative covenants of the Second Lien Loan Parties, as well as a financial covenant which requires that the Company maintain a certain maximum Consolidated Total Net Leverage Ratio (as defined in the Second Lien Credit Agreement) measured at the end of each fiscal quarter for the life of the Second Lien Loans, which Consolidated Total Net Leverage Ratio shall not exceed 5.75 to 1.00 through the fourth fiscal quarter in 2017, 5.50 to 1.00 for each fiscal quarter in 2018, 5.25 to 1.00 for each fiscal quarter in 2019 and 5.00 to 1:00 for each fiscal quarter thereafter until the Latest Maturity Date (as defined in the Second Lien Credit Agreement). The Second Lien Term Loan matures on June 30, 2022.
Global Eagle Entertainment Inc.
Notes to Consolidated Financial Statements
The First and Second Line Credit Agreements are secured by substantially all of the Company’s and its subsidiaries’ tangible and intangible assets, including a pledge of all of the outstanding capital stock of substantially all of its subsidiaries and 65% of the shares or equity interests of foreign subsidiaries, subject to certain exceptions.
On January 6, 2017, the Company refinanced the above-mentioned legacy EMC indebtedness with a six-year $500 million senior secured term-loan facility and a five-year $85 million senior-secured revolving credit facility and repaid all outstanding legacy EMC indebtedness by the proceeds of the new term-loan facility. See Note 21. Subsequent Events. Due to this refinancing, the Company was not required to submit any deliverables under the affirmative and negative covenants to the lenders of legacy EMC indebtedness.
Other Debts
With the acquisition of IFES on October 18, 2013, the Company assumed approximately $1.3 million of debt in the form of two facility letters for a commercial mortgage loan with a bank for $0.2 million and $1.1 million. The commercial mortgage loan for $0.2 million matured in October 2014 and the remaining outstanding balance and accrued interest was repaid at the maturity. The $1.1 million mortgage letter matures in October 2032 and bears interest at a rate equal to 1.75%. Interest is paid on a monthly basis. There was no accrued interest on the mortgage letter as of December 31, 2016 and 2015. As of December 31, 2016 and 2015, there were $0.7 million and $0.9 million in borrowings outstanding under the remaining facility letter, respectively.
In connection with the EMC Acquisition in July 2016, the Company assumed approximately $1.1 million of capital lease obligations. The Company also entered into an additional $1.0 million capital lease obligation during 2016. These leases expire at various dates through 2020. As of December 31, 2016 and 2015, the Company had $2.0 million and $0.6 million of capital lease obligations, respectively. Other debts also include equipment financing arrangement totaling $0.6 million as of December 31, 2016, which is to mature in June 2019.
Citibank Loans
On December 22, 2014, the Company entered into a Credit Agreement with Citibank (the “Former Citibank Credit Agreement”), providing for $2.4 million of term loans (the “Former Citibank Term Loans), which the Company used to repay in full the PMG Term Loan and PMG LOC, and a revolving line of credit (the “Former Citibank Revolving Loans”) in an amount not to exceed $20.0 million. The Former Citibank Term Loans bore interest at a floating rate based on LIBOR plus an applicable interest margin per annum and were to mature on December 22, 2017. A total of $0.2 million of the principal amount of the Former Citibank Term Loans plus any accrued and unpaid interest is to be repaid at the end of each quarter. The outstanding balance of the Former Citibank Term Loans was prepayable in whole or in part at any time without penalty. As of December 31, 2015, there was $1.3 million outstanding under the Former Citibank Term Loans included in Other debts, and $20.0 million available for future borrowings under the Former Citibank Revolving Loans. The Company repaid the outstanding balance and terminated the Former Citibank Credit Agreement on July 27, 2016.
The aggregate contractual maturities of all borrowings due subsequent to December 31, 2016, are as follows (in thousands):
|
| | | |
Year Ending December 31, | Amount |
2017 | $ | 3,638 |
|
2018 | 3,485 |
|
2019 | 3,326 |
|
2020 | 58,552 |
|
2021 | 253,300 |
|
Thereafter | 174,978 |
|
Total | $ | 497,279 |
|
Global Eagle Entertainment Inc.
Notes to Consolidated Financial Statements
Note 11. Commitments and Contingencies
Movie License and Internet Protocol Television (IPTV) Commitments
The Company has certain long-term commitments including film license fees and guaranteed minimum payments owed to content providers. In addition, the Company has certain long-term arrangements with service and television providers to license and provide content and IPTV services that are subject to future guaranteed minimum payments.
The following is a schedule of future minimum payment obligations under movie and IPTV arrangements as of December 31, 2016 (in thousands):
|
| | | |
Year Ending December 31, | Amount |
2017 | $ | 46,207 |
|
2018 | 15,662 |
|
2019 | 5,142 |
|
2020 | 1,251 |
|
2021 | 650 |
|
Thereafter | 150 |
|
Total minimum payments | $ | 69,062 |
|
Operating Leases
The Company leases its operating facilities under non-cancelable operating leases that expire on various dates through 2025. Certain operating leases provide the Company with the option to renew for additional periods. Where operating leases contain escalation clauses, rent abatements, and/or concessions, such as rent holidays and landlord or tenant incentives or allowances, the Company applies them in the determination of straight-line rent expense over the lease term. Certain operating leases require the payment of real estate taxes or other occupancy costs, which may be subject to escalation. The Company also leases certain facilities and vehicles under month-to-month arrangements.
The following is a schedule of future minimum lease payments under operating leases as of December 31, 2016 (in thousands):
|
| | | |
Year Ending December 31, | Amount |
2017 | $ | 5,407 |
|
2018 | 3,312 |
|
2019 | 2,955 |
|
2020 | 2,585 |
|
2021 | 2,539 |
|
Thereafter | 7,042 |
|
Total minimum lease payments | $ | 23,840 |
|
Total lease expense for the year ended December 31, 2016, 2015, and 2014 was $5.6 million, $4.4 million, and $4.1 million, respectively. The Company is responsible for certain operating expenses in connection with these leases.
Capital Leases
The Company leases certain computer software and equipment under capital leases that expire on various dates through 2020. The current portion and non-current portion of capital lease obligations are included in Current portion of long-term debt and Long-term debt, respectively, on the Consolidated Balance Sheets. As of December 31, 2016, future minimum lease payments under these capital leases were as follows (in thousands):
Global Eagle Entertainment Inc.
Notes to Consolidated Financial Statements
|
| | | |
Year Ending December 31, | Amount |
2017 | $ | 758 |
|
2018 | 579 |
|
2019 | 486 |
|
2020 | 339 |
|
Total minimum lease payments | 2,162 |
|
Less: amount representing interest | (174 | ) |
Present value of net minimum lease payments | 1,988 |
|
Less current portion | (670 | ) |
Capital lease obligation, non-current | $ | 1,318 |
|
Satellite Capacity Commitments
The Company maintains agreements with satellite service providers to provide for satellite capacity. The Company expenses these satellite fees in the month the service is provided as a charge to licensing and services cost of sales.
In connection with the EMC Acquisition, the Company assumed a number of contractual commitments, including those for satellite services. During the third quarter of 2016 (prior to the EMC Acquisition), EMC entered into an amendment to its existing service agreement with one of its satellite service providers, Intelsat Corporation (“Intelsat”). Under this amendment, Intelsat will provide certain levels of satellite bandwidth in exchange for an additional $40 million from the Company over and above EMC’s prior contractual commitment.
During the year ended December 31, 2014, the Company entered into a satellite service agreement with New Skies Satellites B.V. (“SES”) to provide global, Ku-band satellite bandwidth to GEE for use in GEE’s in-flight connectivity system. The SES agreement required the Company to make an up-front pre-payment of $4.0 million as well as one additional pre-payment of $4.5 million due and paid in January 2016. During the first quarter of 2015, the Company entered into an agreement with Hughes Network Systems, LLC (“HNS”) to administer and assume the underlying obligations under the SES agreement, and transferred its first $4.0 million SES prepayment to HNS. The upfront $4.0 million pre-payment was applied to certain service fees through February 2016, while the $4.5 million prepayment made in January 2016 will be applied to certain future services expected to launch in 2017. In March 2016, the Company and HNS entered into an additional agreement under which HNS will deliver satellite connectivity for the Company’s next-generation, multi-band airborne services utilizing the high-throughput Ka-band Jupiter constellation of satellites. There is no minimum commitment under this HNS contract and the costs are based on actual usage. In December 2016, the Company entered into an agreement with SES to purchase Tranche 1 and 2 satellite transponders with $13.5 million payable in 2017 for Tranche 1 transponders and $23.0 million payable in 2017 for Tranche 2 transponders. The satellite transponders operate over certain parts of North and Central Americas.
The following is a schedule of future minimum satellite costs as of December 31, 2016 (in thousands):
|
| | | |
Year Ending December 31, | Amount |
2017 | $ | 94,269 |
|
2018 | 76,028 |
|
2019 | 63,896 |
|
2020 | 49,209 |
|
2021 | 29,426 |
|
Thereafter | 134,690 |
|
Total minimum payments | $ | 447,518 |
|
Other Commitments
In connection with the EMC Acquisition on July 27, 2016, the Company was obligated to pay the former member unit holder up to an additional $25.0 million on the first anniversary date in, at the Company’s option, (a) cash, (b) newly issued shares of the
Global Eagle Entertainment Inc.
Notes to Consolidated Financial Statements
Company’s common stock or (c) a combination of cash and newly issued shares of the Company’s common stock. On July 27, 2017, the Company elected to pay such amounts in shares of common stock and issued 5,080,049 shares of common stock to the former member unit holder of EMC.
Through the acquisitions of WOI, RMG, masFlight and navAero, the Company assumed certain obligations with respect to future contingent earn-outs. As of December 31, 2016 and 2015, the total liability was approximately $2.0 million and $9.7 million, respectively, with potential payouts on specified dates through 2020.
In the normal course of business, the Company enters into future purchase commitments with certain connectivity vendors to secure future inventory for its airlines customers and the development pertaining to engineering and antenna projects. As of December 31, 2016, the Company had approximately $40.0 million of future purchase commitments, which it expects to pay $39.0 million in 2017 and $1.0 million in 2018. At December 31, 2016, the Company also had outstanding letters of credit in the amount of $5.2 million, of which $3.3 million was secured by the First Lien Credit Agreement.
Contingencies
The Company is subject to various legal proceedings and claims that have arisen in the ordinary course of business and that have not been fully adjudicated. The Company records accruals for loss contingencies to the extent that management concludes it is probable that a liability has been incurred and the amount of the related loss can be reasonably estimated. On a regular basis, management evaluates developments in legal proceedings and other matters that could cause an increase or decrease in the amount of the liability that has been accrued previously. While it is not possible to accurately predict or determine the eventual outcomes of these matters, an adverse determination in one or more of these matters currently pending could have a material adverse effect on the Company’s consolidated financial position, results of operations or cash flows. Certain of the Company’s legal proceedings and other matters that management believes could become significant are discussed below:
| |
• | Music Infringement and Related Claims. On May 6, 2014, UMG Recordings, Inc., Capitol Records, Universal Music Corp. and entities affiliated with the foregoing (collectively, “UMG”) filed suit in the United States District Court for the Central District of California against the Company and Inflight Productions Ltd. (“IFP”) for copyright infringement and related claims and unspecified money damages. IFP is a direct subsidiary of Global Entertainment AG (formally AIA) and an indirect subsidiary of the Company. In August 2016, the Company entered into settlement agreements with major record labels and publishers, including UMG, to settle music copyright infringement and related claims (the “Sound-Recording Settlements”). As a result of the Sound-Recording Settlements, the Company paid approximately $18.0 million in cash and issued approximately 1.8 million shares of its common stock to settle lawsuits and other claims. Under the settlement agreement with UMG, the Company paid UMG an additional $5.0 million in cash in March 2017 and agreed to issue 500,000 additional shares of its common stock when and if the closing price of its common stock exceeds $10.00 per share and 400,000 additional shares of its common stock when and if the closing price of its common stock exceeds $12.00 per share. |
On July 1, 2014, American Airlines, Inc. (“AA”) filed suit in Texas State Court against IFP for breach of contract and seeking a declaration that IFP must defend and indemnify American against claims that UMG and others may assert against American for music-related copyright infringement insofar as such claims arise out of American’s use of content provided by IFP. In October 2016, the Company, IFP and AA entered into a settlement agreement pursuant to which the Company paid $3.7 million to AA to settle the litigation.
| |
• | In 2016, the Company received notices from several music rights holders and associations acting on their behalf regarding potential claims that the Company infringed their music rights and the rights of artists that they represent. To date, none of these rights holders or associations has initiated litigation against the Company. The Company has not accrued a reserve for these loss contingencies at this time because the Company does not currently believe that a material loss relating to these matters is probable. Based on the Company’s previous music litigation experience, the Company believes that a material loss relating to these matters is reasonably possible, but is currently unable to estimate the amount of such loss at this time due to the preliminary nature of the potential claims. The Company intends to vigorously defend itself against these claims. |
| |
• | SwiftAir Litigation. On August 14, 2014, SwiftAir, LLC filed suit against the Company’s wholly owned subsidiary Row 44 and one of its airline customers for breach of contract, quantum meruit, unjust enrichment and similar claims and money damages in the Superior Court of California for the County of Los Angeles. SwiftAir and Row 44 had a |
Global Eagle Entertainment Inc.
Notes to Consolidated Financial Statements
contractual relationship whereby Row 44 agreed to give SwiftAir access to its portal for one of its airline customers so that SwiftAir could market its destination deal product to the airline customer’s passengers. When Row 44’s customer decided not to proceed with SwiftAir’s destination deal product, Row 44 terminated the contract in 2013. In its lawsuit, SwiftAir seeks approximately $9.0 million in monetary damages against Row 44 and its airline customer. The Court has currently scheduled the trial for this matter in November 2017. The Company has not accrued a reserve for this loss contingency at this time because the Company does not currently believe that a material loss relating to these matters is probable. The Company believes that a material loss relating to this matter is reasonably possible, but is currently unable to estimate the amount of the potential loss at this time due to the preliminary nature of the matter. The Company intends to vigorously defend itself against this claim.
| |
• | AMN Litigation. On March 4, 2016, Advanced Media Networks (“AMN”) filed suit against EMC (which is a wholly owned subsidiary of the Company) and Maritime Telecommunications Network, Inc., a wholly-owned indirect subsidiary of EMC (“MTN”) in U.S. District Court for the Southern District of Florida, for allegedly infringing two of AMN’s patents and seeking injunctive relief and unspecified monetary damages. The Company had recorded a loss contingency and indemnification receivable due from the seller of EMC for this matter in the purchase price accounting and as of December 31, 2016. In June 2017 however, EMC and MTN settled the lawsuit with AMN, and pursuant to the purchase agreement whereby EMC purchased the MTN business, the sellers of the MTN business indemnified EMC and MTN for the full settlement amount and all related legal expenses. |
| |
• | STM Litigation. On April 12, 2016, STM Atlantic N.V. and STM Group, Inc. (jointly, the “STM Sellers”) filed a breach-of-contract action in Delaware Superior Court against EMC relating to EMC’s 2013 acquisition of STM Norway AS, STMEA (FZE), Vodanet Telecomuniçacões Ltda. and STM Networks from the STM Sellers. The STM Sellers allege, among other things, that EMC breached earnout provisions in the purchase agreement by failing to develop and sell sat-link technology following the acquisition closing. The STM Sellers seek $20 million in damages. The Court has currently scheduled the trial for this matter in December 2017. The Company has not accrued a reserve for these loss contingencies at this time because the Company does not currently believe that a material loss relating to these matters is probable. The Company believes that a material loss relating to these matters is reasonably possible, but is currently unable to estimate the amount of such loss at this time due to the preliminary nature of the potential claims. Additionally, pursuant to the purchase agreement whereby the Company purchased the EMC business, the sellers of the EMC business agreed to indemnify the Company in full for this claim and assumed the defense of this matter. The Company intends to vigorously defend itself against this claim. |
| |
• | Securities Class Action Litigation. On February 23, 2017 and on March 17, 2017, following the Company’s announcement that it anticipated a delay in its 2016 Form 10-K filing and that its former CEO and former CFO would separate from the Company, three putative securities class action lawsuits were filed in United States District Court for the Central District of California. These lawsuits alleged violations of Sections 10(b) and 20(a) of the Securities Exchange Act against the Company, its former CEO and two of its former CFOs. The plaintiffs voluntarily dismissed two of these lawsuits. The third lawsuit, brought by putative stockholder M&M Hart Living Trust and Randi Williams (the “Hart complaint”), alleged that the Company and the other Defendants made misrepresentations and/or omitted material information about the EMC Acquisition in July 2016, the Company’s projected financial performance and synergies following that acquisition, and the impact of that acquisition on the Company’s internal controls over financial reporting. Plaintiffs sought unspecified damages, attorneys’ fees and costs. On November 2, 2017, the Court granted the Company’s and the other defendants’ motion to dismiss the Hart complaint, and dismissed the action with prejudice. The plaintiffs may appeal that ruling, and their period in which to appeal has not yet expired. The Company has not accrued a reserve for this loss contingency at this time because the Company currently believes that a material loss relating to this matter is remote. If appealed, the Company intends to vigorously defend itself against this claim. |
In addition, from time to time the Company is or may be party to various additional legal matters incidental to the conduct of its business. Certain of the outstanding legal matters include speculative claims for indeterminate amounts of damages, for which no contingency reserve has been recorded. Additionally, the Company has determined that other legal matters are likely not material to our financial statements, and as such have not discussed those matters above. Although the ultimate resolution of these speculative and immaterial matters cannot be predicted with certainty, based on its current knowledge, the Company does not believe that the outcome of any of these matters will have a material adverse effect on its financial statements.
Global Eagle Entertainment Inc.
Notes to Consolidated Financial Statements
Note 12. Related Party Transactions
Loan Agreement with Lumexis
On February 24, 2016, the Company entered into a loan agreement (the “Loan Agreement”) with Lumexis Corporation, a company that provided in-flight entertainment systems to airlines (“Lumexis”). Lumexis is majority-owned by PAR Investment Partners, L.P. (“PAR”), which beneficially owned approximately 34.5% and 37.5% of the Company’s outstanding shares of common stock as of December 31, 2016 and 2015, respectively. At the time the Company entered into the Loan Agreement, the Chair of the Company’s Board of Directors was also a Managing Partner of PAR and a member of Lumexis’ board of directors.
The Loan Agreement provided for extensions of credit by the Company to Lumexis of up to $5.0 million. The Company’s Board of Directors considered the Loan Agreement under the Company’s policies and procedures regarding related person transactions, and determined that it was appropriate and in the best interests of the Company and its stockholders to enter into the Loan Agreement due to Lumexis’ position as an important supplier to flydubai, a Connectivity customer of the Company and to another airline that was a potential Connectivity customer, and in light of Lumexis’ future business prospects. The Board of Directors further determined that the parties’ relationships did not give rise to any material conflict of interest in entering into the Loan Agreement. The Board Chair recused himself from discussions regarding the Loan Agreement and did not vote on whether the Company should enter into the transaction.
The Loan Agreement qualifies Lumexis as a variable interest entity to the Company. In accordance with ASC 810, Consolidation, the Company was not deemed to be the primary beneficiary of Lumexis as the Company does not hold any power over Lumexis’ activities that most significantly impact its economic performance. Therefore, Lumexis is not subject to consolidation. The maximum exposure to loss as a result of the Loan Agreement is the outstanding principal balance and any accrued interest thereon.
The borrowings under the Loan Agreement were evidenced by a senior secured promissory note (the “Note”) and bore interest at a per annum rate of 15%. The outstanding principal and accrued interest thereon were payable in full on December 31, 2016. As a result of information provided by Lumexis, in June 2016 as to the note’s collectability and Lumexis’ insolvency, management impaired the value of Note during the three months ended June 30, 2016 and discontinued accruing interest receivable and wrote off the outstanding principal balance of the Note and accrued interest receivable of $0.2 million. As of December 31, 2016, the outstanding principal balance of the loan was $4.4 million, inclusive of a $0.1 million origination fee.
On December 5, 2016, the Company, Lumexis and PAR entered into a Partial Cancellation of Debt and Acceptance of Collateral, which provided a transfer of certain assets in the amount of $0.2 million to the Company in partial satisfaction of the Lumexis’ principal amount of the outstanding debt. The Company was the senior-most secured creditor of Lumexis and as such foreclosed on substantially all of its assets. On January 6, 2017, the Company acquired the remainder of Lumexis’ assets pursuant to a properly-noticed public foreclosure auction. The fair value of the acquired assets was $2.0 million. During the year ended December 31, 2016, the Company recognized an impairment loss related to the Lumexis loan and related accrued interest of $4.4 million included in Other expense, net, in the Consolidated Statements of Operations.
Due from WMS
In connection with the EMC Acquisition, the Company acquired a 49% equity interest in WMS. The Company accounts for its interest in WMS using the equity method and includes its share of WMS’ profits or losses in Income (loss) from equity method investments in the Consolidated Statement of Operations. During the period from the EMC Acquisition Date through December 31, 2016, the Company’s sales to WMS were approximately $0.7 million for the services provided for WMS’s onboard cellular equipment under the terms of the WMS operating agreement and an associated master services agreement. These sales are included in Revenue – Services in the Consolidated Statements of Operations. As of December 31, 2016, the Company had a due from WMS of $0.1 million included in Accounts receivable in the Consolidated Balance Sheets.
Due to Santander
Also in connection with the EMC Acquisition, the Company acquired a 49% equity interest in Santander. The Company accounts for its interest in Santander using the equity method and includes its share of Santander’s profits or losses in Income (loss) from equity method investments in the Consolidated Statement of Operations. During the period from the EMC Acquisition Date through December 31, 2016, the Company purchased approximately $1.3 million from Santander for their teleport services
Global Eagle Entertainment Inc.
Notes to Consolidated Financial Statements
and related network operations support services. These costs are included in Cost of sales - Licensing and services in the Consolidated Statements of Operations. As of December 31, 2016, the Company owed Santander $0.8 million included in Accounts payable and accrued liabilities in the Consolidated Balance Sheets.
Transactions with TRIO Connect, LLC and its Affiliates
In July 2015, EMC divested its interest in TRIO Connect, LLC (“TRIO”), a joint venture formed to commercialize EMC’s ARABSAT Ka Band contract, such that TRIO is now owned by funds affiliated with ABRY Partners (former EMC majority owner and current significant Company stockholder), Abel Avellan (the Company’s former President and Chief Strategy Officer) and other equity holders not affiliated with the Company. GEE did not acquire the TRIO business as a part of the EMC Acquisition.
Prior to the EMC Acquisition, EMC and its subsidiaries had collectively made various loans to TRIO and its affiliated entities in an aggregate principal of approximately $5.7 million. Also, prior to the EMC Acquisition, STMEA (FZE), a wholly-owned subsidiary of TRIO, had made equipment sales and provided employee payroll services to EMC and its subsidiaries in an aggregate amount equal to approximately $4.9 million. After applying the trade payables against the outstanding loan amounts, TRIO and its affiliates collectively owed EMC and its subsidiaries approximately $0.8 million in July 2016. Due to the deterioration of TRIO’s financial condition, EMC determined the remaining balance as uncollectible and fully impaired the value of the loan receivable prior to the Company’s acquisition of EMC in July 2016. The Company did not pay any consideration for the loan receivable in the EMC Acquisition, although it acquired the note in the EMC Acquisition. The Company believes that the receivable is now uncollectible, and as such expects to forgive it in full in the near future.
Immediately following the EMC Acquisition, EMC’s employees in the UAE were housed and employed by TRIO’s UAE entity. Because EMC did not have its own entity in UAE at the time the Company acquired EMC, the Company (through EMC) entered into a transition services agreement with TRIO whereby TRIO would continue to employ the UAE employees for the Company’s benefit—and “second” them to the Company at cost—until the Company formed its own licensed UAE subsidiary. For the three-month period (July 2016 to October 2016) following the EMC Acquisition, the Company paid to TRIO approximately $0.6 million for payroll related services and expenses for the “seconded” employees. The Company did not pay any further amounts under the transition services agreement after October 2016.
Between October 2016 and August 2017, we made payments to TRIO totaling $0.4 million for equipment purchases and service fees in connection with various customer contracts. In September 2017, we made additional equipment purchases totaling $0.4 million for customer orders and for inventory purposes. All of these purchase transactions were on arms’-length pricing and terms.
Subscription Receivable with Former Employee
The Company has an agreement with a former officer of Row 44 to settle his note receivable and accrued interest in exchange for certain shares of Row 44’s common stock held by the former officer. At December 31, 2016 and 2015, the balance of the former officer’s receivable amounted to $0.6 million and $0.5 million, respectively, and is presented as Subscriptions receivable in the Consolidated Balance Sheets. The Company recognizes interest income when earned, using the simple interest method. Interest amounts recognized by the Company during the years ended December 31, 2016, 2015 and 2014 were not material. The Company makes ongoing assessments regarding the collectability of the notes receivable and subscriptions receivable balances.
Office Lease Agreement with Former and Current Employees
In connection with the acquisition of PMG in 2013, the Company acquired an office lease that is currently being occupied and used as part of the operations in Irvine, California. This building was formerly majority owned by one of the founding members of PMG, who was an employee of the Company through March 2015, and by another current employee of the Company. During 2017, they sold their interest in the property to an unaffiliated third party. The lease terminates on June 31, 2020. The Company incurred $0.3 million of rent expense each for the years ended December 31, 2016, 2015 and 2014.
Administrative Services
One of the Company’s subsidiaries rents office space belonging to a company in which a former member of such subsidiary’s management had an ownership interest. The former member of management sold his interest in the office during the third quarter
Global Eagle Entertainment Inc.
Notes to Consolidated Financial Statements
of 2015. There were no unpaid lease liabilities as of December 31, 2015. The Company incurred $0.2 million of rent expense for each of the years ended December 31, 2015 and 2014.
masFlight Earn-Out
In August 2015, the Company acquired masFlight for approximately $10.3 million in cash and $9.3 million in contingent consideration. A former executive of masFlight is now an executive officer of the Company. As a portion of the contingent consideration is subject to future employment of certain employees of masFlight, such contingent consideration is recorded as compensation expense subsequent to the acquisition date. For the year ended December 31, 2016, the compensation expense incurred relating to the masFlight contingent consideration was insignificant. As of December 31, 2016, the remaining earn-out compensation liability was $0.2 million, the beneficiaries of which include a current executive officer of the Company who was formerly employed by masFlight. The compensation obligation was terminated in August 2017 without any required payment relating thereto.
AIA Earn-Out
The Company recognized an expense of $1.4 million during the year ended December 31, 2014 as a result of the remeasurement of the fair value of the earn-out liability acquired in the AIA stock acquisition. The earn-out was payable to one of the managing directors at Entertainment In Motion, a wholly owned subsidiary of the Company. At December 31, 2014, the outstanding balance relating to the earn-out liability was $1.7 million. The earn-out liability was paid and fully settled during the year ended December 31, 2015. As of December 31, 2016 and 2015, there was no outstanding balance.
AIA Noncontrolling Interests Acquisition
In April 2014, the Company acquired the remaining outstanding shares of AIA for cash consideration of approximately $21.7 million (the “AIA Consideration”). Included in the AIA Consideration was approximately $2.5 million owed to BF Ventures, an entity in which one of the Company’s former directors owned an indirect stake of approximately 25%, which was paid in full during the year ended December 31, 2014.
Warrant Exchange
In connection with the Company’s offer for the exchange of the Company’s outstanding Public SPAC Warrants for common stock of the Company that closed on September 11, 2014, two members of the Company’s board of directors exchanged 7,040,001 warrants for 2,346,446 shares of the Company’s common stock with an aggregate value of $32.1 million.
Registration Rights Agreement
In connection with the closing of its business combination with Row 44 and Advanced Inflight Alliance AG, the Company entered into an amended and restated registration rights agreement, dated January 31, 2013 by and among the Company, Global Eagle Acquisition LLC (the “Sponsor”), Par Investment Partners, L.P. (“PAR”), Putnam Capital Spectrum Fund and Putnam Equity Spectrum Fund, and the members of the Sponsor signatory thereto, including Harry E. Sloan and Jeff Sagansky, pursuant to which the parties thereto obtained the right to cause the Company to register the resale of certain securities held by them (the “registrable securities”) and to sell such registrable securities pursuant to an effective registration statement in a variety of manners, including in underwritten offerings, all on the terms and conditions set forth therein. The Company is required under the terms of the amended and restated registration rights agreement to pay the expenses in connection with the exercise of these rights.
Note 13. Common Stock, Stock-Based Awards and Warrants
Common Stock
Issuance of Common Stock
The Company issued approximately 5.5 million shares of its common stock in connection with the EMC Acquisition on July 27, 2016. On the first anniversary of the EMC Acquisition, on July 27, 2017, the Company issued to the former member unit holders an additional approximately 5.0 million shares of the Company’s common stock. Pursuant to the EMC purchase agreement,
Global Eagle Entertainment Inc.
Notes to Consolidated Financial Statements
50% of the newly issued shares was valued at $8.40 per share, and 50% of which was valued at the volume-weighted average price of a share of Company common stock measured two days prior the first anniversary date.
Additionally, in August 2016, the Company issued approximately 1.8 million shares of its common stock as partial consideration for the Sound-Recording Settlements. The Company is obligated to issue an additional 0.5 million shares of its common stock to UMG in connection with the litigation when and if the share price of the Company’s common stock exceeds $10 per share and an additional 0.4 million shares of its common stock when and if the closing price exceeds $12 per share (together, the “Supplemental Shares”) at any time in the future. In lieu of issuing the Supplemental Shares of the Company’s common stock upon exceeding the respective share price thresholds, the Company may pay the equivalent in cash at its sole discretion. If the Company were to experience a liquidation event, as defined in the applicable agreement, and the equivalent liquidation price per share exceeds one or both of the share price thresholds, the Company is obligated to pay the equivalent liquidation price per share in cash in lieu of issuing the Supplemental Shares.
During the year ended December 31, 2015, 257,058 of Row 44 warrants were exchanged for 93,161 shares of common stock.
During the year ended December 31, 2015, the Company issued 1,337,760 shares of common stock in exchange for the surrender of Public SPAC Warrants for 3,957,280 shares of the Company’s common stock.
On September 11, 2014, the Company completed an offer to all holders of the Company’s outstanding warrants exercisable for shares of the Company’s common stock, to receive 0.3333 shares of common stock at an exercise price of $11.50 per share in exchange for every warrant tendered by the holders thereof (approximately one share for every three warrants tendered), up to a maximum of 15,000,000 warrants. On September 11, 2014, the Company issued 4,227,187 shares of common stock in exchange for 12,682,755 warrants and recognized a gain on the exchange of approximately $0.8 million included in change in fair value of financial instruments in the Consolidated Statement of Operations for the year ended December 31, 2014.
In August 2014, the Company issued 28,161 shares of common stock as a working capital settlement to Row 44 former stockholders with an aggregate fair value of $0.3 million. The entire value was expensed during the year ended December 31, 2014 and included in other income (expense), net on the Consolidated Statement of Operations.
On June 17, 2014, PAR Investment Partners, L.P. (“PAR”) converted 19,118,233 shares of non-voting common stock of the Company into an equal number of shares of the Company’s common stock, par value $0.0001 per share, in accordance with the terms of the non-voting common stock set forth in the Company’s Second Amended and Restated Certificate of Incorporation. The conversion was exempt from the registration requirements of the Securities Act of 1933, as amended, pursuant to Section 3 (a)(9) thereof. No commission or other remuneration was paid or given directly or indirectly for soliciting the conversion.
Stock Repurchase Program
In March 2016, the Company’s Board of Directors (the “Board”) authorized a stock repurchase program under which the Company may repurchase up to $50.0 million of its common stock. Under the stock repurchase program, the Company may repurchase shares from time to time using a variety of methods, which may include open-market purchases and privately negotiated transactions. The extent to which the Company repurchases its shares, and the timing and manner of such repurchases, will depend upon a variety of factors, including market conditions, regulatory requirements and other corporate considerations, as determined by management. The Company measures all potential buybacks against other potential uses of capital which may arise from time to time. The repurchase program does not obligate the Company to repurchase any specific number of shares, and may be suspended or discontinued at any time. The Company expects to finance any purchases with existing cash on hand, cash from operations and potential additional borrowings. During the year ended December 31, 2016, the Company repurchased 0.6 million shares of its common stock for aggregate consideration of $5.2 million. As of December 31, 2016, the remaining authorization under the stock repurchase plan was $44.8 million.
Stock-Based Awards
EMC Employment Inducement Awards
On July 27, 2016, the Company granted its then President and Chief Strategy Officer the following stock-based awards: (i) non-qualified stock options to purchase 450,000 shares of the Company’s common stock (the “Option Award”), (ii) an award of 275,000 restricted stock units (the “Stock Award”), and (iii) 175,000 shares of fully-vested restricted stock. Such compensation
Global Eagle Entertainment Inc.
Notes to Consolidated Financial Statements
expense is recorded in General and administrative in the Consolidated Statement of Operations for the year ended December 31, 2016. Mr. Avellan terminated his employment with the Company in April 2017. Under the terms of his consulting agreement, Mr. Avellan received continued vesting on his outstanding equity awards through the date of cessation of those consulting services. Mr. Avellan ceased providing consulting services to the Company in November 2017.
The exercise price per share of the Option Award was equal to the closing price of the Company’s stock on the EMC Acquisition Date. Each of the Option Award and the Stock Award are subject to the terms and conditions applicable to such awards granted under the Company’s 2016 Inducement and Retention Stock Plan for EMC Employees (effective as of the date thereof as it may be amended from time to time, the “Inducement Equity Plan”). Subject to continued vesting due to his consulting relationship with the Company, one-third of the Option Awards vested on July 27, 2017, with the remainder vesting monthly on a pro rata basis thereafter over the next two years until fully vested. Subject to continued vesting due to his consulting relationship with the Company through each vesting date, the restricted stock units will vest in three equal annual installments, with the first installment vested on July 27, 2017 and the remaining installments vesting annually thereafter. Both the Option Award and the Stock Award are subject to automatic vesting provisions in the event of a change in control as provided for under the terms of the employment agreement.
In addition, in connection with the EMC Acquisition, the Company granted certain other EMC employees, in the aggregate, nonqualified stock options to purchase 72,600 shares of the Company’s common stock and 73,750 restricted stock units as employment inducement awards. The exercise price per share of the nonqualified stock options was equal to the closing price of the Company’s stock on the EMC Acquisition Date. The options are subject to continuous employment and vested with respect to one-fourth of the underlying shares on July 27, 2017, with the remainder vesting monthly on a pro rata basis thereafter over the next three years until fully vested. Subject to continuous employment through each vesting date, the restricted stock units will vest in four equal installments, with the first installment vested on July 27, 2017 and the remaining installments vesting annually thereafter.
2013 Equity Plan
Under the Company’s 2013 Amended and Restated Equity Incentive Plan, (as amended, the “2013 Equity Plan”), the Administrator of the Plan, which is the compensation committee of the Company’s Board of Directors, may grant up to 11,000,000 shares (through stock options, restricted stock, restricted stock units (RSUs) (including both time-vesting and performance-based RSUs) and other incentive awards) to employees, officers, non-employee directors, and consultants, and such options or awards may be designated as incentive or non-qualified stock options at the discretion of the Administrator. As of December 31, 2016, there were 1,859,792 shares available for future grant under the Plan.
Stock Options
The exercise price of stock option awards granted is generally equal to the per share closing price of the common stock on the date the options were granted. Employee stock option grants generally have five- and seven- year terms (depending on when they were issued) and employee stock options generally vest 1/4th on the anniversary of the vesting commencement date and 1/36th monthly thereafter, over a four-year period. Stock options granted to the Company’s Board of Directors have five- and seven- year terms (depending on when they were issued) and vest 25% per quarter during the calendar year. In 2017, the Board’s Compensation Committee determined that it would only issue RSUs (vesting on the earlier of the next annual meeting of stockholders and 12 months) as part of its director compensation program. Certain stock option awards have accelerated vesting provisions in the event of a change in control or termination without cause.
Global Eagle Entertainment Inc.
Notes to Consolidated Financial Statements
The fair values of stock options issued were determined on the grant date using the Black-Scholes option pricing model and the following level 3 assumptions for the years ended December 31, 2016, 2015 and 2014, respectively:
|
| | | | | | | | | | | |
| 2016 | | 2015 | | 2014 |
Common stock price on grant date | $ | 8.34 |
| | $ | 12.91 |
| | $ | 11.53 |
|
Expected life (in years) | 3.91 |
| | 3.77 |
| | 4.00 |
|
Risk-free interest rate | 1.15 | % | | 1.28 | % | | 1.52 | % |
Expected stock volatility | 44 | % | | 43 | % | | 58 | % |
Expected dividend yield | 0 | % | | 0 | % | | 0 | % |
Fair value of stock options granted | $ | 2.93 |
| | $ | 4.41 |
| | $ | 5.14 |
|
The total intrinsic value of options exercised during the years ended December 31, 2015 and 2014 was $2.5 million and $1.7 million, respectively. There was no significant intrinsic value of options exercised during the year ended December 31, 2016.
Stock option activity for year ended December 31, 2016 is as follows:
|
| | | | | | | | | | | | |
| Shares (in thousands) | | Weighted Average Exercise Price | | Weighted Average Remaining Contractual Term (in years) | | Aggregate Intrinsic Value (in thousands) |
Balance unexercised at January 1, 2016 | 5,625 |
| | $ | 11.20 |
| | 3.18 | | $ | 204 |
|
Granted | 1,927 |
| | $ | 8.34 |
| |
| |
|
|
Exercised | (26 | ) | | $ | 9.87 |
| |
| |
|
Forfeited | (780 | ) | | $ | 11.42 |
| |
| |
|
Balance unexercised at December 31, 2016 | 6,746 |
| | $ | 10.36 |
| | 2.70 | | $ | 59 |
|
Exercisable at December 31, 2016 | 3,837 |
| | $ | 10.81 |
| | 1.82 | | $ | — |
|
Vested and expected to vest after December 31, 2016 | 6,121 |
| | $ | 10.45 |
| | 2.55 | | $ | 43 |
|
The following is a summary of the Company’s stock options outstanding at December 31, 2016:
|
| | | | | | | | | | | | | | | |
Range of Exercise Price | Number Outstanding (in thousands) | | Weighted Average Remaining Contractual Term (in years) | | Weighted Average Exercise Price | | Number Exercisable (in thousands) | | Weighted Average Exercise Price |
$12.90 - $16.70 | 1,215 |
| | 2.87 | | $ | 13.38 |
| | 745 |
| | $ | 13.44 |
|
$10.57 - $12.51 | 1,436 |
| | 2.56 | | $ | 11.24 |
| | 860 |
| | $ | 11.04 |
|
$10.00 - $10.00 | 1,380 |
| | 1.34 | | $ | 10.00 |
| | 1,342 |
| | $ | 10.00 |
|
$9.25 - $9.87 | 1,286 |
| | 2.28 | | $ | 9.54 |
| | 801 |
| | $ | 9.70 |
|
$6.18 - $9.21 | 1,429 |
| | 4.40 | | $ | 8.01 |
| | 89 |
| | $ | 8.72 |
|
| 6,746 |
| | 2.70 | | $ | 10.36 |
| | 3,837 |
| | $ | 10.81 |
|
Restricted Stock Units (“RSU”)
Under the 2013 Equity Plan and associated form of award agreement, our time vesting RSU awards to employees generally vest annually on each anniversary of the grant date and generally over a four-year term. The time-vesting RSUs granted to non-employee directors in 2016 and 2015 cliff-vest on the 13 month anniversary from the grant date. The grant date fair value of the time-vesting RSUs generally equals the closing price of the Company’s common stock on the grant date.
Global Eagle Entertainment Inc.
Notes to Consolidated Financial Statements
During the years ended December 31, 2016 and 2015, the Company granted 38,000 RSUs and 29,000 RSUs, respectively, to the Board of Directors that fully vest on the 13 month anniversary of the grant date. The Company also granted 1,580,000 RSUs and 401,000 RSUs to certain employees that vest 1/4th on the grant anniversary date over a four-year term during the years ended December 31, 2016 and 2015, respectively.
RSU activity during the year ended December 31, 2016 was as follows:
|
| | | | | | | | | | |
| Shares (in thousands) | | Weighted Average Grant Date Fair Value | | Aggregate Intrinsic Value (in thousands) |
Balance nonvested at January 1, 2016 | 408 |
| | $ | 12.71 |
| | |
Granted | 1,618 |
| | $ | 7.91 |
| | |
Vested | (264 | ) | | $ | 9.62 |
| | |
Forfeited | (124 | ) | | $ | 10.98 |
| | |
Balance nonvested at December 31, 2016 | 1,638 |
| | $ | 8.60 |
| | $ | 10,579 |
|
Vested and expected to vest at December 31, 2016 | 1,068 |
| | $ | 8.48 |
| | $ | 6,899 |
|
The total fair value of RSUs vested during the years ended December 31, 2016, 2015 and 2014 was $2.1 million, $0.6 million and $0.1 million, respectively.
Performance Based Restricted Units (“PSU”)
Under the 2013 Equity Plan, in October 2016, the Board of Directors issued new performance based PSU awards, which give the recipient the right to receive Company common stock based on the Company’s total stockholder return relative to the Russell 2000 index during the three-year period beginning from date of grant and ending on the third anniversary of the grant date.
The compensation expense recognized for the awards is based on the grant date fair value of a unit that is determined using Monte-Carlo simulation multiplied by the number of units granted. Depending on the outcome of these performance goals, a recipient may ultimately earn a number of units greater or less than the number of units granted. In general, participants vest in their PSU awards at the end of the performance period with continuous employment or service during the period.
During the year ended December 31, 2016, the Company granted 0.2 million PSUs with a weighted-average grant date fair value of $9.93 per unit and using a risk free rate of 1.02%. As of December 31, 2016, there were 0.2 million nonvested PSUs outstanding. There were no PSUs outstanding as of December 31, 2015.
During the year ended December 31, 2014, the Company granted certain employees performance-based RSUs. A performance unit gave the recipient the right to receive common stock that was contingent upon achievement of a specified predetermined performance target for fiscal 2014 and the continuation of employment for a period of one year from the grant date. The number of shares issued of the Company’s common stock upon completion of the performance period totaled 77,687.
Global Eagle Entertainment Inc.
Notes to Consolidated Financial Statements
Stock-Based Compensation Expense
Stock-based compensation expense related to all employee and, where applicable, non-employee stock-based awards was as follows for the years ended December 31, 2016, 2015 and 2014 (in thousands):
|
| | | | | | | | | | | |
| Year Ended December 31, |
| 2016 | | 2015 | | 2014 |
Consolidated Statement of Operations Classification: | | | | | |
Cost of sales | $ | 313 |
| | $ | 322 |
| | $ | 36 |
|
Sales and marketing | 629 |
| | 701 |
| | 46 |
|
Product development | 994 |
| | 1,020 |
| | 268 |
|
General and administrative | 8,811 |
| | 6,192 |
| | 7,717 |
|
Total | $ | 10,747 |
| | $ | 8,235 |
| | $ | 8,067 |
|
As of December 31, 2016, the Company had approximately $23.1 million of unrecognized employee related stock-based compensation, which it expects to recognize over a weighted-average period of approximately 2.70 years.
Warrants
Legacy Row 44 Warrants
In conjunction with the business combination with Row 44 and Advanced Inflight Alliance AG in January 31, 2013, the Company converted 21,062,500 Row 44 warrants to warrants to purchase up to 721,897 shares of Global Eagle common stock (“Legacy Row 44 Warrants”). The following is a summary of the Legacy Row 44 Warrants outstanding as of December 31, 2016:
|
| | | | | | | | |
| Weighted Average Exercise Price per Warrant | | Number of Warrants (in thousands) | | Weighted Average Remaining Life (in years) |
Legacy Row 44 Warrants (1) | $ | 8.79 |
| | 689 |
| | 0.21 |
Legacy Row 44 Warrants (2) | $ | 8.62 |
| | 477 |
| | 0.43 |
| |
(1) | Originally issuable for Row 44 common stock, and now issuable for Company common stock. The exercise period for these Legacy Row 44 Warrants expired on March 20, 2017. |
| |
(2) | Originally issuable for Row 44’s Series C preferred stock and now issuable for Company common stock. The exercise period for these Legacy Row 44 Warrants expired on June 7, 2017. |
Public SPAC Warrants
The following is a summary of Public SPAC Warrants for the year ended December 31, 2016:
|
| | | | | | | | |
| Number of Warrants (in thousands) | | Weighted Average Exercise price | | Weighted Average Remaining Contractual Term (in years) |
Outstanding at January 1, 2016 | 6,173 |
| | $ | 11.50 |
| | |
Granted | — |
| | — |
| | |
Exercised | — |
| | — |
| | |
Purchased | — |
| | — |
| | |
Exchanged for Global Eagle common stock | — |
| | — |
| | |
Forfeited | — |
| | — |
| | |
Outstanding and exercisable at December 31, 2016 | 6,173 |
| | $ | 11.50 |
| | 1.08 |
Global Eagle Entertainment Inc.
Notes to Consolidated Financial Statements
As of December 31, 2016 and 2015, the Company accounted for its 6,173,228 Public SPAC Warrants as derivative liabilities in the Consolidated Balance Sheets. During the years ended December 31, 2016, 2015 and 2014, the Company recorded approximately $23.6 million, $11.9 million and $(7.0) million in Change in fair value of derivatives in the Consolidated Statements of Operations as a result of the remeasurement of these warrants at the respective balance sheet dates. As of December 31, 2016, the fair value of warrants issued by the Company was estimated using the Black-Scholes option pricing model. The Public SPAC Warrants have a five-year term and will expire in January 31, 2018. In the event the Company’s closing stock price is at or above $17.50 for twenty of thirty consecutive trading days, the Company can redeem the 6,173,228 Public SPAC Warrants for $0.01 per warrant following a 30-day notice period, during which period holders may exercise their warrants at $11.50 per share, with estimated proceeds of approximately $71.0 million, unless management decides, at its option, to make them exercisable on a cashless basis.
Warrants Repurchase Program
During the year ended December 31, 2014, the Board authorized the Company to repurchase Public SPAC Warrants for an aggregate purchase price, payable in cash and/or shares of common stock, of up to $25.0 million (inclusive of certain prior warrant purchases). In August 2015, the Board increased this amount by an additional $20.0 million. As of December 31, 2016, $16.7 million was available for warrant repurchases under this authorization. The amount the Company spends and the number of Public SPAC Warrants repurchased varies based on a variety of factors including the warrant price. During 2015, the Company issued 1,337,760 shares of common stock in exchange for the surrender of Public SPAC Warrants exercisable for 3,957,280 shares of the Company’s common stock.
On September 11, 2014, the Company completed an offer to all holders of the Company’s outstanding warrants exercisable for shares of the Company’s common stock, that were originally issued by GEAC and which have an exercise price of $11.50 per share (the “Warrants”), to receive 0.3333 Shares in exchange for every Warrant tendered by the holders thereof (approximately one share for every three Warrants tendered), up to a maximum of 15,000,000 Warrants. On September 11, 2014, the Company issued 4,227,187 Shares in exchange for 12,682,755 Warrants and recognized a gain on the exchange of approximately $0.8 million included in change in fair value of financial instruction instruments in the Consolidated Statement of Operations for the year ended December 31, 2014.
During the year ended December 31, 2014, the Company also repurchased 403,054 Public SPAC Warrants for total cash consideration of $1.4 million. As of December 31, 2016, these repurchased warrants were not retired and were held by the Company.
Note 14. Employee Benefit Plans
The Company has two defined contribution plans under Section 401(k) of the Internal Revenue Code (“401(k)”) covering full-time domestic employees who meet certain eligibility requirements, the Global Eagle Entertainment Retirement Plan ("GEE 401(k) Plan”) and the Emerging Markets Communications Volume Submitter Defined Contribution Plan (the “EMC 401(k) Plan”).
Under the GEE 401(k) Plan, eligible GEE employees may defer up to 100% of either their pre-tax eligible compensation or after-tax eligible compensation through a Roth 401(k), or up to the annual maximum allowed by the Internal Revenue Service (“IRS”). GEE may, but is not obligated to, match a portion of the employee contributions up to a defined maximum. GEE began matching employee contributions in 2016.
Under the EMC 401(k) Plan, eligible EMC employees can make contributions up to 15% of their either pre-tax eligible compensation or after-tax eligible compensation through a Roth 401(k) or up to the annual IRS dollar limit for the applicable year. EMC makes a matching contribution in accordance with a prescribed matching formula.
For the year ended December 31, 2016, the Company recognized a total expense of $0.7 million for matching contribution for both 401(k) plans. The Company did not make any matching contributions to the GEE 401(k) Plan during the years ended December 31, 2015 and 2014.
Global Eagle Entertainment Inc.
Notes to Consolidated Financial Statements
Note 15. Income Taxes
United States and foreign income (loss) from operations before income taxes was as follows (in thousands):
|
| | | | | | | | | | | |
| Year Ended December 31, |
| 2016 | | 2015 | | 2014 |
United States | $ | (119,549 | ) | | $ | (9,949 | ) | | $ | (51,809 | ) |
Foreign | (38,294 | ) | | 9,444 |
| | 5,189 |
|
Loss before income taxes | $ | (157,843 | ) | | $ | (505 | ) | | $ | (46,620 | ) |
The income tax provision based on the income (loss) from operations was as follows (in thousands):
|
| | | | | | | | | | | |
| Year Ended December 31, |
| 2016 | | 2015 | | 2014 |
Current provision: | | | | | |
Federal | $ | 47 |
| | $ | 932 |
| | $ | 2,724 |
|
State | 227 |
| | 355 |
| | 114 |
|
Foreign | 15,184 |
| | 6,786 |
| | 12,804 |
|
Total current provision | 15,458 |
| | 8,073 |
| | 15,642 |
|
Deferred provision (benefit): | | | | | |
Federal | (53,395 | ) | | (2,691 | ) | | (451 | ) |
State | (2,070 | ) | | — |
| | 37 |
|
Foreign | (4,904 | ) | | (3,761 | ) | | (4,654 | ) |
Total deferred provision (benefit) | (60,369 | ) | | (6,452 | ) | | (5,068 | ) |
Total income tax provision (benefit) | $ | (44,911 | ) | | $ | 1,621 |
| | $ | 10,574 |
|
Income taxes differ from the amounts computed by applying the federal income tax rate of 35%. A reconciliation of this difference is as follows (in thousands):
|
| | | | | | | | | | | |
| Year Ended December 31, |
| 2016 | | 2015 | | 2014 |
Income tax benefit at federal statutory rate | $ | (55,245 | ) | | $ | (177 | ) | | $ | (16,317 | ) |
State income tax, net of federal benefit | (1,898 | ) | | 418 |
| | 4 |
|
Permanent items | 1,781 |
| | 9,123 |
| | (153 | ) |
Change in fair value of financial instruments | (8,836 | ) | | (3,847 | ) | | 3,374 |
|
Goodwill impairment | 12,321 |
| | — |
| | — |
|
Sound-recording settlements | 8,556 |
| | — |
| | — |
|
Stock-based compensation | 229 |
| | 375 |
| | 1,575 |
|
Tax credits | (590 | ) | | (586 | ) | | (626 | ) |
Other | 2,977 |
| | 746 |
| | (1,376 | ) |
Uncertain tax positions | 3,858 |
| | 708 |
| | 2,597 |
|
Withholding taxes | 4,732 |
| | 3,431 |
| | 3,386 |
|
Rate differential | (2,158 | ) | | (3,200 | ) | | (2,050 | ) |
Change in enacted tax rate | 173 |
| | (1,371 | ) | | — |
|
Change in valuation allowance | (10,811 | ) | | (3,999 | ) | | 20,160 |
|
Income tax provision (benefit) | $ | (44,911 | ) | | $ | 1,621 |
| | $ | 10,574 |
|
Global Eagle Entertainment Inc.
Notes to Consolidated Financial Statements
The differences in the effective tax rates for years ended December 31, 2016, 2015 and 2014 were primarily due to foreign income taxes resulting from the Company’s foreign subsidiaries’ contribution to pretax income, changes in the ratio of permanent differences to income before income taxes and withholding taxes. The 2016 rate includes a nonrecurring benefit for the release of valuation allowances previously provided against certain US deferred tax asset resulting from the EMC Acquisition on July 27, 2016.
Deferred income taxes reflect the net tax effects of temporary differences between the carrying amounts of assets and liabilities for financial reporting purposes and the amounts used for income tax purposes. Significant components of the deferred income taxes are as follows (in thousands):
|
| | | | | | | |
| December 31, |
| 2016 | | 2015 |
Deferred tax assets: | | | |
Intangible assets and goodwill | $ | 20,196 |
| | $ | 7,624 |
|
Allowances and reserves | 5,816 |
| | 2,925 |
|
Accrued liabilities | 8,793 |
| | 8,398 |
|
Inventories | 1,066 |
| | 567 |
|
Investments in affiliates | — |
| | 443 |
|
Stock-based compensation | 6,977 |
| | 4,527 |
|
Tax credits | 4,006 |
| | 4,714 |
|
Net operating losses | 68,489 |
| | 38,923 |
|
Other | 3,304 |
| | 2,589 |
|
Total deferred tax assets | 118,647 |
| | 70,710 |
|
Less: valuation allowance | (43,269 | ) | | (53,199 | ) |
Net deferred tax assets | $ | 75,378 |
| | $ | 17,511 |
|
| | | |
Deferred tax liabilities: | | | |
Property, plant and equipment | $ | (14,972 | ) | | $ | (2,756 | ) |
Intangible assets | (37,590 | ) | | (28,240 | ) |
Investments in affiliates | (50,831 | ) | | — |
|
Debt costs | (4,288 | ) | | (4,421 | ) |
Other | (854 | ) | | (3,715 | ) |
Total deferred tax liabilities | (108,535 | ) | | (39,132 | ) |
Net deferred tax liabilities | $ | (33,157 | ) | | $ | (21,621 | ) |
The Company has excluded excess windfall tax benefits resulting from stock option exercises as components of the Company’s gross deferred tax assets and corresponding valuation allowance disclosures, as tax attributes related to such windfall tax benefits should not be recognized until they result in a reduction of taxes payable. The tax effected amount of gross unrealized net operating loss (“NOL”) carryforwards, and their corresponding valuation allowances resulting from stock option exercises was $1.7 million at December 31, 2016; the corresponding gross amount is $4.8 million. When realized, excess windfall tax benefits are credited to additional paid-in capital.
In March 2016, the FASB issued ASU 2016-09 to update several aspects of the accounting for share-based payment transactions, including the income tax consequences and classification of awards. The Company expects to adopt the provisions of this ASU beginning in its first quarter of fiscal 2017. As required under the update, the Company will prospectively adopt the provisions of this guidance related to the recognition of the excess tax benefits or deficiencies in the Consolidated Statement of Operations. Management is currently evaluating the impact of this standard on its consolidated financial statements.
The Company is subject to taxation in the U.S. and various states and foreign jurisdictions. As of December 31, 2016, the Company’s tax years for 2012 through 2015 are subject to examination by the tax authorities. With certain exceptions, as of December 31, 2016, the Company’s tax returns for certain past years are still subject to examination by taxing authorities and the
Global Eagle Entertainment Inc.
Notes to Consolidated Financial Statements
use of NOL carryforwards in future periods could trigger a review of attributes and other tax matters in years that are not otherwise subject to examination.
The Company records valuation allowances to reduce deferred tax assets to the amount that is more likely than not to be realized. In making this assessment, management analyzes future taxable income, reversing temporary differences and ongoing tax planning strategies. Should a change in circumstances lead to a change in judgment about the realizability of deferred tax assets in future years, the Company will adjust related valuation allowances in the period that the change in circumstances occurs, along with a corresponding increase or charge to income.
As of December 31, 2016, the Company has recorded a valuation allowance of $33.1 million and $10.2 million against its domestic and certain foreign deferred tax assets, respectively, due to the uncertainties over its ability to realize future taxable income in those jurisdictions. As of December 31, 2015, the valuation allowance on domestic and foreign deferred tax assets were $49.5 million and $3.7 million, respectively.
As of December 31, 2016 and 2015, the Company had federal NOL carry-forwards of $152.7 million and $91.9 million, respectively, and in addition, the Company had State NOL carry-forwards of $84.9 million and $40.5 million, respectively. In addition, the Company had foreign NOL carry-forward from various jurisdictions of $56.4 million and $44.9 million as of December 31, 2016 and 2015, respectively. The Company’s federal, State and foreign NOLs will begin to expire during the fiscal years ending in December 31, 2026, 2017, and 2033 respectively. These NOLs may be used to offset future taxable income, to the extent the Company generates any taxable income, and thereby reduce or eliminate future federal income taxes otherwise payable.
The Internal Revenue Code of 1986, as amended, imposes substantial restrictions on the utilization of net operating losses in the event of an “ownership change” of a corporation. Accordingly, a company’s ability to use net operating losses may be limited as prescribed under Internal Revenue Code Section 382 (“IRC Section 382”). Events which may cause limitations in the amount of the net operating losses that the Company may use in any one year include, but are not limited to, a cumulative ownership change of more than 50% over a three-year period. Due to the effects of historical equity issuances, the Company has determined that the future utilization of a portion of its net operating losses is limited annually pursuant to IRC Section 382. The Company has determined that $2.7 million of its net operating losses will expire because of the annual limitation.
As of December 31, 2016, U.S. taxes were not provided for on $145.3 million of cumulative earnings of the Company’s foreign subsidiaries as the Company has invested or expects to invest the undistributed earnings indefinitely. If in the future these earnings are repatriated to the United States, or if the Company determines that the earnings will be remitted in the foreseeable future, additional tax provisions may be required. It is not practicable to calculate the deferred taxes associated with these earnings because of the variability of multiple factors that would need to be assessed at the time of any assumed repatriation; however, foreign tax credits may be available to reduce federal income taxes in the event of distribution.
As of December 31, 2016 and 2015, the liability for income taxes associated with uncertain tax positions was $11.0 million and $4.6 million, respectively.
The net increase in the liabilities during 2016 is primarily attributable to activity related to ongoing examinations by the Canada Revenue Agency regarding the taxability and presence of the subsidiary’s locations in Dubai and whether income derived from Dubai would have constituted taxable earnings subject to Canadian income tax. In addition, EMC had uncertain tax positions regarding taxable presence in non-US jurisdictions and may be subject to income tax to the extent it exceeded withholding tax, when applicable. The amount of $10.7 million and $4.5 million as of December 31, 2016 and 2015, respectively, if recognized, would favorably affect the Company’s effective tax rate.
Global Eagle Entertainment Inc.
Notes to Consolidated Financial Statements
The following table summarizes the changes to unrecognized tax benefits for the years ended December 31, 2016, 2015 and 2014 (in thousands):
|
| | | | | | | | | | | |
| 2016 | | 2015 | | 2014 |
Balance at beginning of year | $ | 4,637 |
| | $ | 4,237 |
| | $ | 2,831 |
|
Additions from business combinations | 3,492 |
| | — |
| | — |
|
Increase to prior year positions | (34 | ) | | — |
| | — |
|
Reversal of prior tax positions | (147 | ) | | — |
| | (1,795 | ) |
Additions based on tax positions related to current year | 3,100 |
| | 400 |
| | 3,201 |
|
Balance at end of year | $ | 11,048 |
| | $ | 4,637 |
| | $ | 4,237 |
|
The Company’s continuing practice is to recognize interest and penalties, if any, related to uncertain tax positions in income tax expense. As of December 31, 2016, 2015 and 2014, the Company had accrued $6.1 million, $1.4 million and $1.0 million, respectively, of interest and penalties related to uncertain tax positions.
It is reasonably possible that the amount of the unrecognized benefit with respect to certain of the Company’s unrecognized tax positions may significantly decrease within the next 12 months as a result of the ongoing audits.
The following table summarizes the changes in the valuation allowance balance for the years ended December 31, 2016, 2015 and 2014 (in thousands):
|
| | | |
| Amount |
Balance at December 31, 2013 | $ | 50,782 |
|
Increase in valuation allowance | 22,877 |
|
Balance at December 31, 2014 | 73,659 |
|
Acquired valuation allowance from business combination | (1,400 | ) |
Decrease in valuation allowance | (19,060 | ) |
Balance at December 31, 2015 | 53,199 |
|
Decrease in valuation allowance | (9,930 | ) |
Balance at December 31, 2016 | $ | 43,269 |
|
Note 16. Segment Information
The Company reports its operations through three reportable segments: Media & Content, Aviation Connectivity and Maritime & Land Connectivity. Prior to the EMC Acquisition in the third quarter of 2016, the Company operated through two operating segments: Media & Content and Connectivity. During the fourth quarter of 2016, as a result of the EMC Acquisition, the Company formed a Maritime & Land Connectivity segment. The Company added a significant number of customers in different markets and geographic areas of operations under a different management structure and made corresponding organizational changes. As a result, the Company re-evaluated its reportable segments and concluded that the changes to its reportable segments was appropriate and consistent with how its chief operating decision maker (“CODM”) would continue to manage the Company’s operations for purposes of evaluating financial performance and allocating resources.
The CODM evaluates financial performance and allocates resources by reviewing revenue, costs of sales and contribution profit separately for the Media & Content, Aviation Connectivity and Maritime & Land Connectivity segments. Total segment contribution profit provides the CODM a measure to analyze operating performance of each of the Company’s operating segments and its enterprise value against historical data and competitors’ data, although historical results may not be indicative of future results, as operating performance is highly contingent on many factors, including customer tastes and preferences. All other financial information is reviewed by the CODM on a consolidated basis. During the second quarter of 2017, due to the changes in management and organizational structures, the Company reorganized its operations into two operating segments: Media & Content and Connectivity.
Global Eagle Entertainment Inc.
Notes to Consolidated Financial Statements
Revenue and contribution profit by segment were as follows (in thousands):
|
| | | | | | | | | | | |
| Year Ended December 31, |
| 2016 | | 2015 | | 2014 |
Revenue: | | | | | |
Media & Content | | | | | |
Licensing | $ | 261,912 |
| | $ | 252,775 |
| | $ | 231,521 |
|
Services | 56,152 |
| | 55,292 |
| | 45,868 |
|
Total | 318,064 |
| | 308,067 |
| | 277,389 |
|
Aviation Connectivity | | | | | |
Services | 109,507 |
| | 96,912 |
| | 74,839 |
|
Equipment | 28,977 |
| | 21,051 |
| | 35,507 |
|
Total | 138,484 |
| | 117,963 |
| | 110,346 |
|
Maritime & Land Connectivity | | | | | |
Services | 68,964 |
| | — |
| | — |
|
Equipment | 4,243 |
| | — |
| | — |
|
Total | 73,207 |
| | — |
| | — |
|
Total revenue | $ | 529,755 |
| | $ | 426,030 |
| | $ | 387,735 |
|
Contribution profit (1): | | | | | |
Media & Content | $ | 104,036 |
| | $ | 104,374 |
| | $ | 82,393 |
|
Aviation Connectivity | 46,739 |
| | 42,500 |
| | 23,469 |
|
Maritime & Land Connectivity | 13,510 |
| | — |
| | — |
|
Total contribution profit | 164,285 |
| | 146,874 |
| | 105,862 |
|
Other operating expenses | 326,948 |
| | 155,685 |
| | 142,845 |
|
Loss from operations | $ | (162,663 | ) | | $ | (8,811 | ) | | $ | (36,983 | ) |
| |
(1) | Includes depreciation expense of $0.7 million (Media & Content), $4.5 million (Aviation Connectivity) and $5.6 million (Maritime & Land Connectivity), $0.7 million (Media & Content) and $2.2 million (Aviation Connectivity), and $1.2 million (Media & Content) and $1.7 million (Aviation Connectivity) for the years ended December 31, 2016, 2015, and 2014, respectively. Also includes amortization expense of $0.2 million (Media & Content) and $2.7 million (Media & Content) for the years ended December 31, 2015 and 2014, respectively. |
The Company’s total assets by segment were as follows (in thousands):
|
| | | | | | | |
| December 31, |
| 2016 | | 2015 |
Segment assets: | | | |
Media & Content | $ | 391,668 |
| | $ | 432,250 |
|
Aviation Connectivity | 151,136 |
| | 95,379 |
|
Maritime & Land Connectivity | 539,327 |
| | — |
|
Total segment assets | 1,082,131 |
| | 527,629 |
|
Corporate assets | 17,304 |
| | 110,232 |
|
Total assets | $ | 1,099,435 |
| | $ | 637,861 |
|
Global Eagle Entertainment Inc.
Notes to Consolidated Financial Statements
Geographical revenue by segment as presented below is based on the billing location of the customer. Revenue from external customers was as follows (in thousands):
|
| | | | | | | | | | | |
| Year Ended December 31, |
| 2016 | | 2015 | | 2014 |
Media & Content: | | | | | |
United States and Canada | $ | 80,765 |
| | $ | 78,662 |
| | $ | 59,317 |
|
Europe | 48,527 |
| | 39,738 |
| | 47,917 |
|
Asia and Middle East | 152,758 |
| | 155,818 |
| | 114,886 |
|
Other | 36,014 |
| | 33,849 |
| | 55,269 |
|
Total | $ | 318,064 |
| | $ | 308,067 |
| | $ | 277,389 |
|
Aviation Connectivity: | | | | | |
United States | $ | 119,198 |
| | $ | 102,598 |
| | $ | 92,914 |
|
Europe | 15,231 |
| | 14,833 |
| | 13,807 |
|
Other | 4,055 |
| | 532 |
| | 3,625 |
|
Total | $ | 138,484 |
| | $ | 117,963 |
| | $ | 110,346 |
|
Maritime & Land Connectivity: | | | | | |
United States | $ | 31,334 |
| | $ | — |
| | $ | — |
|
Europe | 22,088 |
| | — |
| | — |
|
Africa, Middle East and Asia | 13,759 |
| | — |
| | — |
|
Other | 6,026 |
| | — |
| | — |
|
Total | $ | 73,207 |
| | $ | — |
| | $ | — |
|
| $ | 529,755 |
| | $ | 426,030 |
| | $ | 387,735 |
|
Global Eagle Entertainment Inc.
Notes to Consolidated Financial Statements
The following table summarizes net property, plant and equipment by country (in thousands):
|
| | | | | | | |
| December 31, |
| 2016 | | 2015 |
Media & Content: | | | |
United States and Canada | $ | 2,803 |
| | $ | 5,081 |
|
United Kingdom | 3,023 |
| | 3,192 |
|
India | 2,013 |
| | 1,828 |
|
Other | 1,338 |
| | 552 |
|
Total | $ | 9,177 |
| | $ | 10,653 |
|
Aviation Connectivity: | | | |
United States | $ | 64,800 |
| | $ | 23,638 |
|
Total | $ | 64,800 |
| | $ | 23,638 |
|
Maritime & Land Connectivity: | | | |
United States | $ | 66,124 |
| | $ | — |
|
Germany | 16,321 |
| | — |
|
Other | 4,139 |
| | — |
|
Total | $ | 86,584 |
| | $ | — |
|
Corporate | | | |
United States | $ | 5,488 |
| | $ | 4,775 |
|
Total | $ | 5,488 |
| | $ | 4,775 |
|
| $ | 166,049 |
| | $ | 39,066 |
|
Global Eagle Entertainment Inc.
Notes to Consolidated Financial Statements
As described above, subsequent to December 31, 2016, the Company reorganized its operations into two reportable segments: Connectivity and Media & Content. The following provides the segment information based on the two reportable segments as of December 31, 2016 and 2015 and for the years ended December 31, 2016, 2015 and 2014.
Revenue and contribution profit by segment were as follows (in thousands):
|
| | | | | | | | | | | |
| Year Ended December 31, |
| 2016 | | 2015 | | 2014 |
Revenue: | | | | | |
Media & Content | | | | | |
Licensing | $ | 261,912 |
| | $ | 252,775 |
| | $ | 231,521 |
|
Services | 56,152 |
| | 55,292 |
| | 45,868 |
|
Total | 318,064 |
| | 308,067 |
| | 277,389 |
|
Connectivity | | | | | |
Services | 178,471 |
| | 96,912 |
| | 74,839 |
|
Equipment | 33,220 |
| | 21,051 |
| | 35,507 |
|
Total | 211,691 |
| | 117,963 |
| | 110,346 |
|
Total revenue | $ | 529,755 |
| | $ | 426,030 |
| | $ | 387,735 |
|
Contribution profit (1): | | | | | |
Media & Content | $ | 104,036 |
| | $ | 104,374 |
| | $ | 82,393 |
|
Connectivity | 60,249 |
| | 42,500 |
| | 23,469 |
|
Total contribution profit | 164,285 |
| | 146,874 |
| | 105,862 |
|
Other operating expenses | 326,948 |
| | 155,685 |
| | 142,845 |
|
Loss from operations | $ | (162,663 | ) | | $ | (8,811 | ) | | $ | (36,983 | ) |
| |
(1) | Includes depreciation expense of $0.7 million (Media & Content) and $10.2 million (Connectivity), $0.7 million (Media & Content) and $2.2 million (Connectivity), and $1.2 million (Media & Content) and $1.7 million (Connectivity) for the years ended December 31, 2016, 2015, and 2014, respectively. Also includes amortization expense of $0.2 million (Media & Content) and $2.7 million (Media & Content) for the years ended December 31, 2015 and 2014, respectively. |
The Company’s total assets by segment were as follows (in thousands):
|
| | | | | | | |
| December 31, |
| 2016 | | 2015 |
Segment assets: | | | |
Media & Content | $ | 391,668 |
| | $ | 432,250 |
|
Connectivity | 690,463 |
| | 95,379 |
|
Total segment assets | 1,082,131 |
| | 527,629 |
|
Corporate assets | 17,304 |
| | 110,232 |
|
Total assets | $ | 1,099,435 |
| | $ | 637,861 |
|
Global Eagle Entertainment Inc.
Notes to Consolidated Financial Statements
Geographical revenue by segment as presented below is based on the billing location of the customer. The revenue from external customers was as follows (in thousands):
|
| | | | | | | | | | | |
| Year Ended December 31, |
| 2016 | | 2015 | | 2014 |
Media & Content: | | | | | |
United States and Canada | $ | 80,765 |
| | $ | 78,662 |
| | $ | 59,317 |
|
Europe | 48,527 |
| | 39,738 |
| | 47,917 |
|
Asia and the Middle East | 152,758 |
| | 155,818 |
| | 114,886 |
|
Other | 36,014 |
| | 33,849 |
| | 55,269 |
|
Total | $ | 318,064 |
| | $ | 308,067 |
| | $ | 277,389 |
|
Connectivity: | | | | | |
United States | $ | 150,532 |
| | $ | 102,598 |
| | $ | 92,914 |
|
Europe | 37,319 |
| | 14,833 |
| | 13,807 |
|
Other | 23,840 |
| | 532 |
| | 3,625 |
|
Total | $ | 211,691 |
| | $ | 117,963 |
| | $ | 110,346 |
|
| $ | 529,755 |
| | $ | 426,030 |
| | $ | 387,735 |
|
The following table summarizes net property, plant and equipment by country (in thousands):
|
| | | | | | | |
| December 31, |
| 2016 | | 2015 |
Media & Content: | | | |
United States and Canada | $ | 2,803 |
| | $ | 5,081 |
|
United Kingdom | 3,023 |
| | 3,192 |
|
India | 2,013 |
| | 1,828 |
|
Other | 1,338 |
| | 552 |
|
Total | $ | 9,177 |
| | $ | 10,653 |
|
Connectivity: | | | |
United States | $ | 130,924 |
| | $ | 23,638 |
|
Germany | 16,321 |
| | — |
|
Other | 4,139 |
| | — |
|
Total | $ | 151,384 |
| | $ | 23,638 |
|
Corporate | | | |
United States | $ | 5,488 |
| | $ | 4,775 |
|
Total | $ | 5,488 |
| | $ | 4,775 |
|
| $ | 166,049 |
| | $ | 39,066 |
|
Note 17. Concentrations
Concentrations of Credit and Business Risk
Financial instruments that potentially subject the Company to a concentration of credit risk consist of cash and cash equivalents and accounts receivable.
At December 31, 2016 and 2015, the Company’s cash and cash equivalents were maintained primarily with major U.S. financial institutions and foreign banks. Deposits with these institutions at times exceed the federally insured limits, which potentially subjects the Company to concentration of credit risk. The Company has not experienced any losses related to these balances and believes that there is minimal risk.
Global Eagle Entertainment Inc.
Notes to Consolidated Financial Statements
A substantial portion of the Company’s revenue is generated through arrangements with Southwest Airlines. The Company may not be successful in renewing these agreements, or if they are renewed, they may not be on terms as favorable as current agreements. The percentage of revenue generated through the customer representing more than 10% of consolidated revenue is as follows:
|
| | | | | | | | |
| Year Ended December 31, |
| 2016 | | 2015 | | 2014 |
Southwest Airlines as percentage of total revenue | 22 | % | | 23 | % | | 24 | % |
Southwest Airlines as percentage of total Aviation Connectivity revenue | 83 | % | | 85 | % | | 83 | % |
No other customer accounted for revenue greater than 10% for the three years presented. Accounts receivable from Southwest Airlines represented 12% and 6% of total accounts receivable at December 31, 2016 and 2015, respectively.
Note 18. Net Loss Per Share
Basic loss per share (“EPS”) is computed using the weighted-average number of common shares outstanding during the period. Diluted loss per share is computed using the weighted-average number of common shares and the dilutive effect of contingent shares outstanding during the period. Potentially dilutive contingent shares, which consist of stock options, restricted stock units (including performance stock units), liability warrants, warrants issued to third parties and accounted for as equity instruments convertible senior notes and contingently issuable shares, have been excluded from the diluted loss per share calculation when the effect of including such shares is anti-dilutive. As illustrated in the table below, the change in the fair value of the Company’s warrants and contingently issuable shares, which are assumed to be converted into the Company’s common stock upon exercise, are adjusted to net income for purposes of computing dilutive loss per share for the year ended December 31, 2015. Common stock to be issued upon the exercise of warrant instruments classified as a liability is included in the calculation of diluted loss per share when dilutive.
The following table sets forth the computation of basic and diluted net loss per share of common stock (in thousands, except per share amounts):
|
| | | | | | | | | | | |
| Year Ended December 31, |
| 2016 | | 2015 | | 2014 |
Net income (loss) (Numerator): | | | | | |
Net loss | $ | (112,932 | ) | | $ | (2,126 | ) | | $ | (57,194 | ) |
Net income attributable to non-controlling interest | — |
| | — |
| | 194 |
|
Net loss attributable to Global Eagle Entertainment, Inc. common stockholders for basic and diluted EPS | $ | (112,932 | ) | | $ | (2,126 | ) | | $ | (57,388 | ) |
| | | | | |
Less: adjustment for change in fair value on warrants liability for diluted EPS after assumed exercise of warrants liability | — |
| | 11,938 |
| | — |
|
Net loss for dilutive EPS | $ | (112,932 | ) | | $ | (14,064 | ) | | $ | (57,388 | ) |
| | | | | |
Shares (Denominator): | | | | | |
Weighted average common shares outstanding - basic | 81,269 |
| | 77,558 |
| | 73,300 |
|
Dilutive effect of stock options and warrants | — |
| | 836 |
| | — |
|
Weighted average common shares outstanding - diluted | 81,269 |
| | 78,394 |
| | 73,300 |
|
| | | | | |
Net loss per share: | | | | | |
Basic | $ | (1.39 | ) | | $ | (0.03 | ) | | $ | (0.78 | ) |
Diluted | $ | (1.39 | ) | | $ | (0.18 | ) | | $ | (0.78 | ) |
Global Eagle Entertainment Inc.
Notes to Consolidated Financial Statements
The following weighted average common equivalent shares are excluded from the calculation of the Company’s net loss per share as their inclusion would have been anti-dilutive (in thousands):
|
| | | | | | | | |
| Year Ended December 31, |
| 2016 | | 2015 | | 2014 |
Employee stock options | 6,203 |
| | 3,200 |
| | 2,025 |
|
Restricted stock units (including performance stock units) | 306 |
| | 44 |
| | 3 |
|
Non-employees stock options | — |
| | 1 |
| | 5 |
|
Equity warrants (1) | 1,165 |
| | 430 |
| | 1,101 |
|
Public SPAC Warrants (2) | 6,173 |
| | — |
| | 1,356 |
|
Convertible notes | 4,447 |
| | 3,850 |
| | — |
|
EMC deferred consideration (3) | 1,428 |
| | — |
| | — |
|
Contingently issuable shares (4) | 354 |
| | — |
| | — |
|
| |
(1) | Legacy Row 44 Warrants originally issuable for Row 44 common stock and Row 44 Series C preferred stock, and later issuable for the Company’s Common Stock. The exercise period for these Legacy Row 44 Warrants has now expired. |
| |
(2) | Warrants issued in the Company’s initial public offering to non-sponsor stockholders. |
| |
(3) | The Company elected to pay $25.0 million in newly issued shares of Company’s common stock at the Company's option on July 27, 2017 (one year after the EMC Acquisition Date). |
| |
(4) | In connection with the Sound-Recording Settlement, the Company is obligated to issue to UMG 0.5 million shares of common stock when and if the closing price of the Company's common stock exceeds $10.00 per share and 0.4 million shares of common stock when and if the closing price of the Company’s common stock exceeds $12.00 per share. |
Note 19. Restructuring
The Company records the cost reduction plan activities in accordance with the applicable Accounting Standards Codification (“ASC”), including ASC 420, Exit or Disposal Cost Obligations, ASC 712, Compensation-Nonretirement Postemployment Benefits and ASC 360, Property, Plant, and Equipment (Impairment or Disposal of Long-Lived Assets).
During the third quarter ended September 30, 2014, the Company implemented a plan to improve operational efficiencies, which included the closure of its German-based operations and facilities, centralization of its international financial operations, and realignment of its international and U.S. tax structure (the “Restructuring Plan”). During 2014, in conjunction with the Restructuring Plan, the Company committed to a reduction in force. As of September 23, 2014, the Company communicated the reduction to affected employees. The Company completed the implementation of its Restructuring Plan before the end of 2015.
The Company incurred a total of $4.6 million of restructuring charges since inception in connection with the Restructuring Plan, including:
| |
(1) | $2.7 million relating to employee termination benefits, which primarily included severance and transitional-related expenses. |
| |
(2) | $0.4 million of facilities disposal charges in connection with the closure of its German operation. Pursuant to the Restructuring Plan, the Company exited approximately 11,000 square feet of leased facilities in Duisburg and Munich, Germany, representing approximately 6% of its global facilities square footage. |
| |
(3) | $1.5 million of legal and professional fees. |
Global Eagle Entertainment Inc.
Notes to Consolidated Financial Statements
The following table summarizes the charges recorded during the years ended December 31, 2015 and 2014 related to the restructuring plan by type of activity (in thousands), which are recorded in Restructuring Charges in the Consolidated Statements of Operations:
|
| | | | | | | |
| 2015 | | 2014 |
Termination benefits | $ | 238 |
| | $ | 2,489 |
|
Leases and other contractual obligations | 107 |
| | 322 |
|
Other | 66 |
| | 1,412 |
|
Total | $ | 411 |
| | $ | 4,223 |
|
The following table summarizes the charges and spending relating to the Restructuring Plan (in thousands):
|
| | | | | | | | | | | | | | | |
| Termination Costs | | Leases and Other Contractual Obligations | | Other | | Total |
Restructuring reserves as of January 1, 2014 | $ | — |
| | $ | — |
| | $ | — |
| | $ | — |
|
Expense | 2,489 |
| | 322 |
| | 1,412 |
| | 4,223 |
|
Payments | (1,680 | ) | | (283 | ) | | (336 | ) | | (2,299 | ) |
Restructuring reserves as of December 31, 2014 | 809 |
| | 39 |
| | 1,076 |
| | 1,924 |
|
Expense | 238 |
| | 107 |
| | 66 |
| | 411 |
|
Payments | (1,047 | ) | | (146 | ) | | (1,142 | ) | | (2,335 | ) |
Restructuring reserves as of December 31, 2015 | $ | — |
| | $ | — |
| | $ | — |
| | $ | — |
|
Global Eagle Entertainment Inc.
Notes to Consolidated Financial Statements
Note 20. Quarterly Financial Data (Unaudited)
The following quarterly Consolidated Statements of Operations for the years December 31, 2016 and 2015 are unaudited, and have been prepared on a basis consistent with our audited consolidated annual financial statements, and include, in the opinion of management, all normal recurring adjustments necessary for the fair statement of the financial information contained in those statements. The results of operations of any quarter are not necessarily indicative of the results that may be expected for any future period (in thousands, except per share amounts).
|
| | | | | | | | | | | | | | | | | | | | | | | | | | | | | | | |
| Quarter Ended |
| Mar. 31, 2015 | | June 30, 2015 | | Sept. 30, 2015 (1) | | Dec. 31, 2015 | | Mar. 31, 2016 | | June 30, 2016 | | Sept. 30, 2016(2) | | Dec. 31, 2016 |
Revenue | $ | 100,305 |
| | $ | 102,376 |
| | $ | 110,114 |
| | $ | 113,235 |
| | $ | 113,817 |
| | $ | 112,265 |
| | $ | 146,909 |
| | $ | 156,764 |
|
Operating expenses: | | | | | | | | | | | | | | | |
Cost of sales | 69,426 |
| | 66,083 |
| | 71,456 |
| | 72,191 |
| | 76,768 |
| | 75,086 |
| | 103,348 |
| | 110,268 |
|
Sales and marketing | 3,275 |
| | 4,964 |
| | 4,819 |
| | 4,647 |
| | 4,672 |
| | 6,491 |
| | 8,390 |
| | 11,388 |
|
Product development (7) | 7,230 |
| | 6,451 |
| | 7,766 |
| | 7,163 |
| | 8,746 |
| | 8,416 |
| | 7,916 |
| | 12,640 |
|
General and administrative (1) (2) (3) | 18,119 |
| | 17,576 |
| | 18,602 |
| | 23,418 |
| | 19,220 |
| | 18,447 |
| | 44,728 |
| | 32,800 |
|
Provision for legal settlements (3) | — |
| | 750 |
| | 3,500 |
| | — |
| | 2,001 |
| | 38,142 |
| | 1,545 |
| | 1,758 |
|
Amortization of intangible assets | 5,983 |
| | 6,005 |
| | 7,286 |
| | 7,720 |
| | 7,403 |
| | 7,486 |
| | 9,166 |
| | 11,593 |
|
Goodwill impairment | — |
| | — |
| | — |
| | — |
| | — |
| | — |
| | — |
| | 64,000 |
|
Restructuring charges | 302 |
| | — |
| | 66 |
| | 43 |
| | — |
| | — |
| | — |
| | — |
|
Total operating expenses | 104,335 |
| | 101,829 |
| | 113,495 |
| | 115,182 |
| | 118,810 |
| | 154,068 |
| | 175,093 |
| | 244,447 |
|
Income (loss) from operations | (4,030 | ) | | 547 |
| | (3,381 | ) | | (1,947 | ) | | (4,993 | ) | | (41,803 | ) | | (28,184 | ) | | (87,683 | ) |
Interest expense, net | (245 | ) | | (583 | ) | | (803 | ) | | (861 | ) | | (804 | ) | | (613 | ) | | (6,412 | ) | | (10,369 | ) |
Income from equity method investments (2) | — |
| | — |
| | — |
| | — |
| | — |
| | — |
| | 2,065 |
| | 1,764 |
|
Change in fair value of derivatives | 954 |
| | 14,789 |
| | (1,877 | ) | | (1,928 | ) | | 5,865 |
| | 10,926 |
| | 1,191 |
| | 7,533 |
|
Other income (expense), net (4) | (796 | ) | | (443 | ) | | (576 | ) | | 675 |
| | 680 |
| | (5,934 | ) | | 631 |
| | (1,703 | ) |
Income (loss) before income taxes | (4,117 | ) | | 14,310 |
| | (6,637 | ) | | (4,061 | ) | | 748 |
| | (37,424 | ) | | (30,709 | ) | | (90,458 | ) |
Income tax expense (benefit) (2) | (686 | ) | | 1,323 |
| | 235 |
| | 749 |
| | 3,160 |
| | 736 |
| | (50,063 | ) | | 1,256 |
|
Net income (loss) | $ | (3,431 | ) | | $ | 12,987 |
| | $ | (6,872 | ) | | $ | (4,810 | ) | | $ | (2,412 | ) | | $ | (38,160 | ) | | $ | 19,354 |
| | $ | (91,714 | ) |
Net income (loss) per share (5): | | | | | | | | | | | | | | | |
Basic | $ | (0.04 | ) | | $ | 0.17 |
| | $ | (0.09 | ) | | $ | (0.06 | ) | | $ | (0.03 | ) | | $ | (0.49 | ) | | $ | 0.23 |
| | $ | (1.07 | ) |
Diluted | $ | (0.06 | ) | | $ | (0.02 | ) | | $ | (0.09 | ) | | $ | (0.06 | ) | | $ | (0.03 | ) | | $ | (0.49 | ) | | $ | 0.23 |
| | $ | (1.07 | ) |
Weighted average shares outstanding (6): | | | | | | | | | | | | | | | |
Basic | 76,874 |
| | 77,111 |
| | 77,753 |
| | 78,476 |
| | 78,643 |
| | 78,127 |
| | 82,874 |
| | 85,369 |
|
Diluted | 78,725 |
| | 78,518 |
| | 77,753 |
| | 78,476 |
| | 78,643 |
| | 78,127 |
| | 85,081 |
| | 85,369 |
|
| |
(1) | The Company acquired WOI (Media & Content segment) and RMG (Media & Content segment) on July 1, 2015 and masFlight (Aviation Connectivity segment) and navAero (Aviation Connectivity segment) on August 6, 2015. The financial data from the quarter ended September 30, 2015 includes the operating results of these acquired businesses for the periods beginning on their respective acquisition dates through September 30, 2015. The Company reported transaction expenses related to these acquisitions totaling $1.3 million during the quarter ended September 30, 2015 in General and administrative in the above quarterly Consolidated Statement of Operations. |
| |
(2) | On July 27, 2016, the Company acquired EMC (Maritime & Land Connectivity segment). The financial data for the quarter ended September 30, 2016 includes the operating results of EMC from the acquisition date through September 30, 2016. In connection with this acquisition, the Company released the valuation allowance due to the deferred tax liabilities created of $53.9 million, offset by foreign income taxes of $4.8 million resulting from the foreign subsidiaries’ contribution to pretax income, withholding taxes of $2.7 million and effects of permanent differences. Also, in connection with this acquisition, the Company acquired interests in two equity method investments. The related transaction and integration expenses of $12.7 million, $1.9 million and $0.8 million were incurred during the quarters ended September 30, 2016, June 30, 2016 and March 31, 2016, respectively, and $1.8 million was incurred during the quarter ended December 31, 2015, in General and administrative in the quarterly Consolidated Statements of Operations. |
| |
(3) | During the quarter ended June 30, 2016, the Company recorded a one-time charge of $38.1 million to settle sound-recording liabilities under the Sound-Recording Settlements. The Company also engaged in settlement negotiations with airlines regarding related liabilities. The presentation of the Provision for legal settlements for applicable prior quarters have been reclassified from General and administrative to conform with this presentation. |
| |
(4) | Other income (expense), net, for the quarter ended June 30, 2016 includes a one-time $4.4 million write-off of a related party note receivable and accrued interest and a $0.9 million impairment of internally developed software. |
| |
(5) | Quarterly and year-to-date computations of net income (loss) per common share amounts are calculated independently. Therefore, the sum of the per share amounts for the quarters may not agree with the per share amounts for the year. |
Global Eagle Entertainment Inc.
Notes to Consolidated Financial Statements
| |
(6) | During the quarter ended June 30, 2016, the Company repurchased 0.6 million shares of its common stock for consideration of $5.2 million in the aggregate under the stock repurchase program authorized by the Board of Directors in March 2016. In connection with the EMC Acquisition on July 27, 2016, the Company issued approximately 5.5 million shares of its common stock at the closing as part of the purchase price. In addition, as a result of the Sound-Recording Settlements entered into with major record labels and publishers in 2016, including UMG, the Company issued 1.8 million shares of its common stock during the quarter ended September 30, 2016 as part of the settlement payments. |
| |
(7) | Product development for the quarter ended December 31, 2016 includes an impairment of internally developed software of $3.2 million. |
Note 21. Subsequent Events
2017 Credit Agreement
On January 6, 2017, the Company refinanced the Senior Secured Credit Facility with a six-year $500 million senior-secured term-loan facility (“2017 Term Loans”) and a five-year $85 million senior-secured revolving credit facility (“2017 Revolving Loans”) (collectively “2017 Credit Agreement”). The 2017 Term Loans initially bore interest on the outstanding principal amount thereof at a rate per annum equal to (i) the Eurocurrency Rate (as defined) plus 6.00% or (ii) the Base Rate (as defined) plus 5.00% for each Interest Period (as defined). The 2017 Credit Agreement initially required quarterly principal payments equal to 0.25% of the original aggregate principal amount of the 2017 Term Loans, with such payments reduced for prepayments in accordance with the terms of the 2017 Credit Agreement. The 2017 Revolving Loans initially bore interest at a rate per annum equal to (i) the Base Rate plus 5.00% or (ii) the Eurocurrency Rate or EURIBOR (as defined) plus 6.00% until the delivery of financial statements for the first full fiscal quarter ending after the date of the 2017 Credit Agreement (the “Closing Date”). After the delivery of those financial statements, 2017 Revolving Loans bear interest at a rate based on the Base Rate, Eurocurrency Rate or EURIBOR (each as defined) plus an interest-rate spread thereon that varies based on the Consolidated First Lien Net Leverage Ratio (as defined). The spread thereon initially ranged from 4.50% to 5.00% for the Base Rate and 5.50% to 6.00% for the Eurocurrency Rate and EURIBOR. In May 2017 and October 2017, the interest rates and required quarterly principal payments for the 2017 Term Loans and the interest rates and interest-rate spreads for the 2017 Revolving Loans were amended as described below. The 2017 Credit Agreement provides for the issuance of letters of credit in the amount equal to the lesser of $15.0 million and the aggregate amount of the revolving loan commitment.
The 2017 Credit Agreement is secured by substantially all of the Company’s and its subsidiaries’ tangible and intangible assets, including a pledge of all of the outstanding capital stock of substantially all of its domestic subsidiaries and 65% of the shares or equity interests of foreign subsidiaries, subject to certain exceptions.
The 2017 Credit Agreement contains various customary restrictive covenants that limit the Company’s ability to, among other things: create or incur liens on assets; make any investments, loans or advances; incur additional indebtedness, engage in mergers, dissolutions, liquidations or consolidations; engage in transactions with affiliates; make dispositions; and declare or make dividend payments. The 2017 Credit Agreement requires the Company to maintain compliance with a maximum consolidated first lien net leverage ratio, as set forth in the 2017 Credit Agreement. In addition, the 2017 Credit Agreement contains representations and warranties as to whether a material adverse effect on the Company has occurred since January 6, 2017, the closing date of the 2017 Credit Agreement. One of the conditions to drawing on the revolving credit facility is confirmation that the representations and warranties in the 2017 Credit Agreement are true on the date of borrowing, and if the Company is unable to make that confirmation, including that no material adverse effect has occurred, it will be unable to draw down further on the revolver. In connection with this refinancing, the Company recorded a loss on extinguishment of debt in the amount of $13.5 million during the first quarter of 2017.
First Amendment to Credit Agreement and Limited Waiver to Credit Agreement
On May 4, 2017, the Company signed a First Amendment and Limited Waiver to Credit Agreement (the “May 2017 Amendment”), whereby the lenders waived the following default events under the affirmative covenants. Failure to comply with the below requirements by the respective due dates will constitute an immediate event of default.
| |
• | failure to deliver the 2016 annual financial statements by March 31, 2017: the waiver was to remain effective so long as the Company issued an earnings release for the fiscal quarter ended December 31, 2016 (“Earnings Release”) on or prior to June 30, 2017 and delivered its 2016 audited consolidated financial statements by July 31, 2017. The June 2017 Amendment, September 2017 Extension, First October 2017 Amendment, October 2017 Extension and Second October 2017 Amendment further amended this waiver as described below. |
Global Eagle Entertainment Inc.
Notes to Consolidated Financial Statements
| |
• | failure to deliver the quarterly financial statements for the quarter ended March 31, 2017 by May 15, 2017: the waiver was to remain effective so long as the Company issued the Earnings Release on or prior to June 30, 2017 and delivered the unaudited consolidated financial statements for the quarter ended March 31, 2017 on or prior to July 31, 2017. The June 2017 Amendment, September 2017 Extension, First October 2017 Amendment and Second October 2017 Amendment further amended this waiver as described below. |
| |
• | failure to deliver the Company’s budget to the Administrative Agent by April 30, 2017: the waiver was to remain effective so long as the Company delivered certain 2017 financial projections by May 31, 2017. The Company delivered its budget to the Administrative Agent by the required deadline. |
The following affirmative covenant was added requiring the Company furnish the following information on a Current Report on Form 8-K by May 31, 2017, and the failure to comply with the requirement would constitute an immediate event of default:
| |
• | estimated consolidated adjusted EBITDA of the Company for the fiscal quarter ended December 31, 2016 with a range of no greater than $5,000,000 and, |
| |
• | the current consolidated cash balance, current cash balance of the Company’s foreign subsidiaries, and the current outstanding balance under the 2017 Revolving Loans |
The Company complied with this affirmative covenant by the due date.
Under the 2017 Credit Agreement (as amended by the May 2017 Amendment), the Initial Term Loans (as defined) bore interest on the outstanding amount at a rate per annum equal to either (i) the Base Rate plus 6.00% or (ii) the Eurocurrency Rate for each Interest Period plus 7.00%. In October 2017, these interest rates increased as described below.
The 2017 Revolving Loans bore interest at a rate equal to either (i) the Base Rate plus 6.00% or (ii) the Eurocurrency Rate or EURIBOR plus 7.00% until the Company delivers its unaudited financial statements for the quarter ending June 30, 2017, but those interest rates increased in October 2017 as described below. After the delivery of those unaudited financial statements, the 2017 Revolving Loans will bear interest at a rate based on the Base Rate, Eurocurrency Rate or EURIBOR plus an interest-rate spread thereon that varies on the Consolidated First Lien Net Leverage Ratio. The spread thereon ranged from 5.50% to 6.00% for the Base Rate and 6.50% to 7.00% for the Eurocurrency Rate and EURIBOR, but those spreads increased in October 2017 as described below.
The 2017 Credit Agreement (as amended by the May 2017 Amendment) requires quarterly principal payments equal to (i) 0.625% of the original aggregate principal amount of the Initial Term Loans for each of the first eight quarterly payment dates after May 4, 2017 and (ii) 1.25% of the original aggregate principal amount of the Initial Term Loans for each quarterly payment date occurring thereafter.
The May 2017 Amendment modified certain restrictive covenants and a maximum Consolidated First Lien Net Leverage Ratio. In connection with the May 2017 Amendment, the Company paid each lender that consented to the amendment a consent fee in the amount equal to 1.0% of the aggregate principal amount of the Revolving Credit Commitments and outstanding Term Loans held by such lenders as of May 4, 2017. The fee paid totaled $5.6 million.
Amendment to First Amendment and Limited Waiver to Credit Agreement and Second Amendment to Credit Agreement
On June 29, 2017, the Company entered into an Amendment to First Amendment and Limited Waiver to Credit Agreement and Second Amendment to Credit Agreement (the “June 2017 Amendment”). Pursuant to the June 2017 Amendment:
| |
• | The Company was no longer required to deliver an earnings release for the fiscal quarter ended December 31, 2016 by June 30, 2017. |
| |
• | The Company had until September 15, 2017 (rather than July 31, 2017 as required under the May 2017 Amendment) to deliver its audited annual financial statements for the year ended December 31, 2016 (together with the related audit report and opinion from the Company’s independent accountants and the other items required by the 2017 Credit Agreement (as amended) to be delivered therewith, the “Annual Financial Statement Deliverables”). The September |
Global Eagle Entertainment Inc.
Notes to Consolidated Financial Statements
2017 Extension, First October 2017 Amendment and Second October 2017 Amendment amended this requirement as described below.
| |
• | The Company had up to 30 days following the date on which it delivers the Annual Financial Statement Deliverables to deliver its unaudited financial statements for both (i) the quarter ended March 31, 2017 (versus a required delivery date of July 31, 2017 under the 2017 First Amended Credit Agreement) and (ii) the quarter ended June 30, 2017. The September 2017 Extension, First October 2017 Amendment and Second October 2017 Amendment amended this requirement as described below. |
Under the June 2017 Amendment, the Company agreed to pay to the lenders that consented to the June 2017 Amendment (“June 2017 Consenting Lenders”): (i) if the Company has not delivered the Annual Financial Statement Deliverables on or prior to June 30, 2017, a fee in an amount equal to 0.25% of the aggregate principal amount of the revolving credit commitments and term loans held by the June 2017 Consenting Lenders as of June 30, 2017, payable on or prior to July 6, 2017; (ii) if the Company has not delivered the Annual Financial Statement Deliverables on or prior to July 31, 2017, a fee in an amount equal to 0.25% of the aggregate principal amount of the revolving credit commitments and term loans held by the June 2017 Consenting Lenders as of July 31, 2017, payable on or prior to August 3, 2017; and (iii) if the Company has not delivered the Annual Financial Statement Deliverables on or prior to August 31, 2017, a fee in an amount equal to 0.25% of the aggregate principal amount of the revolving credit commitments and term loans held by the June 2017 Consenting Lenders as of August 31, 2017, payable on or prior to September 6, 2017. The fees paid pursuant to this paragraph totaled $3.9 million.
Second Amendment to Limited Waiver to Credit Agreement
On September 13, 2017, the Company entered into a Second Amendment to Limited Waiver to Credit Agreement (the “September 2017 Extension”) that amends the June 2017 Amendment as follows:
| |
• | The Company would have until September 30, 2017 (rather than September 15, 2017 as previously required under the June 2017 Amendment) to deliver the Annual Financial Statement Deliverables. |
| |
• | The Company would also continue to have up to 30 days (as provided for in the June 2017 Amendment) following the date on which it delivers the Annual Financial Statement Deliverables to deliver its unaudited financial statements for both the quarter ended March 31, 2017 and the quarter ended June 30, 2017. |
The First October 2017 Amendment and Second October 2017 Amendment amended these requirements as described below.
Under the September 2017 Extension, the Company agreed to pay to the lenders that consented to the September 2017 Extension (the “September 2017 Consenting Lenders”) a fee in an amount equal to 0.25% of the aggregate principal amount of the Revolving Credit Commitments and Term Loans held by the September 2017 Consenting Lenders as of September 13, 2017. The fee paid totaled $1.4 million.
Third Amendment to Limited Waiver and Third Amendment to Credit Agreement
On October 2, 2017, the Company entered into a Third Amendment to Limited Waiver to Credit Agreement and Third Amendment to Credit Agreement (the “First October 2017 Amendment”) that amended the Credit Agreement and May 2017 Amendment as follows:
| |
• | The Company would have until October 31, 2017 (rather than September 30, 2017 as previously required under the September 2017 Extension) to deliver the Annual Financial Statement Deliverables. The Company would also continue to have up to 30 days following the date on which it delivers the Annual Financial Statement Deliverables to deliver its unaudited financial statements for both the quarter ended March 31, 2017 and the quarter ended June 30, 2017. The Second October 2017 Amendment amended this requirement as described below. |
| |
• | The Company would have up to 30 days following the date on which it delivers its unaudited financial statements for both the quarter ended March 31, 2017 and the quarter ended June 30, 2017 to deliver its unaudited financial statements for the quarter ended September 30, 2017. The Second October 2017 Amendment amended this requirement as described below. |
Global Eagle Entertainment Inc.
Notes to Consolidated Financial Statements
| |
• | Under the 2017 Credit Agreement (as amended by the First October 2017 Amendment), the Initial Term Loans (as defined) bear interest on the outstanding amount at a rate per annum equal to either (i) the Base Rate plus 6.25% or (ii) the Eurocurrency Rate for each Interest Period plus 7.25%. The Second October 2017 Amendment further amended these interest rates as described below. |
| |
• | Under the 2017 Credit Agreement, the 2017 Revolving Loans bear interest at a rate equal to either (i) the Base Rate plus 6.25% or (ii) the Eurocurrency Rate or EURIBOR plus 7.25% until the Company delivers its unaudited financial statements for the quarter ending March 31, 2018. After the delivery of those unaudited financial statements, the 2017 Revolving Loans will bear interest at a rate based on the Base Rate, Eurocurrency Rate or EURIBOR plus an interest-rate spread thereon that varies on the Consolidated First Lien Net Leverage Ratio. The spread thereon ranged from 5.75% to 6.25% for the Base Rate and 6.75% to 7.25% for the Eurocurrency Rate and EURIBOR. The Second October 2017 Amendment further amended these interest rates as described below. |
| |
• | The “non-call period” will now extend until: (i) if the Company prepays any Term Loans prior to the date that it delivers the Annual Financial Statement Deliverables, October 31, 2019; and (ii) if the Company prepays any Term Loans on or after the date that it delivers the Annual Financial Statement Deliverables, the earlier of (x) the second anniversary of the date of that delivery and (y) October 31, 2019. (The “non-call period” (as so extended) is referred to as the “Extended Non-Call Period.”) This period previously expired in May 2019 under the terms of the May 2017 Amendment. The Company remains subject to 2.0% and 1.0% prepayment premiums through the first and second anniversaries, respectively, of the end of the Extended Non-Call Period, which periods previously expired in May 2020 and May 2021, respectively. |
| |
• | The Company would issue on or prior to October 6, 2017 an earnings release for the fiscal quarter and fiscal year ended December 31, 2016, including a related balance sheet, statement of income and statement of cash flows. This was a new affirmative covenant under the 2017 Credit Agreement. The October 2017 Extension amended this requirement as described below. |
| |
• | The Company would furnish on a Current Report on Form 8-K on or prior to October 12, 2017: (i) the range of its (A) total estimated revenue and (B) estimated adjusted EBITDA, in each case for the fiscal quarters ended March 31, 2017 and June 30, 2017, with the difference between the high end and low end of the ranges to be no greater than $5.0 million; and (ii) a forecast of its consolidated cash balance as of December 31, 2017. This is a new affirmative covenant for the Company under the 2017 Credit Agreement. The Company complied with this affirmative covenant by the due date. |
| |
• | The Company will continue (on a bi-weekly basis commencing October 11, 2017 until it has delivered the Annual Financial Statement Deliverables) to furnish or file on a Current Report on Form 8-K its current consolidated cash balance, the current cash balance of its foreign subsidiaries and the current outstanding balance under the Revolving Credit Facility. The Company will also participate in one conference call with the Administrative Agent and the Lenders with respect to the information contained in that Current Report on Form 8-K. |
Under the First October 2017 Amendment, the Company agreed to pay to the lenders that consented to the October 2017 Amendment (the “First October 2017 Amendment Consenting Lenders”) a fee in an amount equal to 0.25% of the aggregate principal amount of the Revolving Credit Commitments and Term Loans held by the First October 2017 Amendment Consenting Lenders as of October 2, 2017. The fee paid totaled $1.4 million.
October Extension Letter Agreement
Under the October 2017 Amendment, the Company was required to issue an earnings release for the fiscal quarter and fiscal year ended December 31, 2016 by October 6, 2017. On October 6, 2017, the Company entered into a letter agreement (the “October 2017 Extension”) permitting it to have until the date that it delivers the Annual Financial Statement Deliverables to issue the earnings release. The Company complied with this affirmative covenant on October 18, 2017.
Fourth Amendment to Limited Waiver and Fourth Amendment to Credit Agreement
On October 31, 2017, the Company entered into a Fourth Amendment to Limited Waiver to Credit Agreement and Fourth Amendment to Credit Agreement (the “Second October 2017 Amendment”) that amends the 2017 Credit Agreement and May 2017 Amendment as follows:
Global Eagle Entertainment Inc.
Notes to Consolidated Financial Statements
| |
• | The Company would have until November 15, 2017 (rather than October 31, 2017 as previously required under the First October 2017 Amendment) to deliver the Annual Financial Statement Deliverables. The November Extension Letter Agreement amended this requirement as described below. |
| |
• | The Company would have until January 2, 2018 to deliver its unaudited financial statements for the quarters ended March 31, 2017, June 30, 2017 and September 30, 2017. |
| |
• | Under the 2017 Credit Agreement (as amended by the Second October 2017 Amendment), the Initial Term Loans (as defined) bear interest on the outstanding amount at a rate per annum equal to either (i) the Base Rate plus 6.50% or (ii) the Eurocurrency Rate for each Interest Period plus 7.50%. |
| |
• | Under the 2017 Credit Agreement (as amended by the Second October 2017 Amendment), the 2017 Revolving Loans bear interest at a rate equal to either (i) the Base Rate plus 6.50% or (ii) the Eurocurrency Rate or EURIBOR plus 7.50% until the Company delivers its unaudited financial statements for the quarter ending March 31, 2018. After the delivery of those unaudited financial statements, the 2017 Revolving Loans will bear interest at a rate based on the Base Rate, Eurocurrency Rate or EURIBOR plus an interest-rate spread thereon that varies on the Consolidated First Lien Net Leverage Ratio. The spread thereon ranged from 6.00% to 6.50% for the Base Rate and 7.00% to 7.50% for the Eurocurrency Rate and EURIBOR. |
The Company will furnish on a Current Report on Form 8-K on or prior to December 5, 2017: (i) the range of its (A) total estimated revenue and (B) estimated adjusted EBITDA for the fiscal quarter ended September 30, 2017, with the difference between the high end and low end of the ranges to be no greater than $5.0 million. This is a new affirmative covenant for the Company under the 2017 Credit Agreement.
November Extension Letter Agreement
Under the Second October 2017 Amendment, the Company was required to deliver the Annual Financial Statement Deliverables by November 15, 2017. On November 15, 2017, the Company entered into a letter agreement permitting it to have until November 17, 2017 to deliver the Annual Financial Statement Deliverables.
Termination of Shareco Investment Agreement
On November 8, 2016, the Company entered into an investment agreement (the “Investment Agreement”) with Shareco Group of America, Inc. (“Shareco”), which is a subsidiary of HNA Group, and certain affiliates of Shareco, to sell approximately 9.9% of the Company’s common stock to Shareco (the “Initial Investment”) for $11.00 per share, subject to satisfaction of customary closing conditions (including regulatory approvals). The parties also negotiated a term sheet that contemplated negotiation of definitive documentation for additional purchases of the Company’s common stock by Shareco and the formation of a joint venture to provide in-flight connectivity and passenger monetization services to HNA Group-affiliated airlines. On July 25, 2017, the Company and Shareco terminated the Investment Agreement as a result of the parties’ inability to obtain the required approval of the Committee on Foreign Investment in the United States (“CFIUS”) prior to the outside date under the Investment Agreement. As a result of this termination, the other related agreements that the Company entered into in connection with the Investment Agreement were also terminated in accordance with their terms.
Payment of EMC Deferred Consideration
On July 27, 2017, the Company elected to settle the EMC deferred consideration in shares of common stock and issued 5,080,049 shares of its common stock to the former EMC equityholders in satisfaction thereof and in accordance with the EMC purchase agreement.