Exhibit 99.2 First Lien Presentation With Appendix Slides May 28, 2019Exhibit 99.2 First Lien Presentation With Appendix Slides May 28, 2019
Forward-Looking Statements We may make forward-looking statements in this presentation within the meaning of the Securities Litigation Reform Act of 1995. These forward-looking statements include, without limitation, statements with respect to our expected Adjusted EBITDA, revenue and margin growth in future periods, our aviation-connectivity installations in future periods, the impact of Boeing 737 MAX aircraft grounding on our financial performance, our business and financial-performance outlook and goals (including our assumptions therein relating to growth in fleet count, ARPA growth, new contract wins and the expected benefits therefrom, opex savings, stable capex spend and lower satellite- bandwidth spend in future periods), industry, business strategy, plans, business and M&A integration activities, capital expenditures, operating-expense and cost-structure improvements and reductions, future operations, margins, profitability, future efficiencies and other financial and operating information. These statements may be preceded by, followed by or include the words “may,” “might,” “will,” “will likely result,” “should,” “estimate,” “plan,” “project,” “forecast,” “intend,” “expect,” “anticipate,” “believe,” “seek,” “continue,” “target” or similar expressions. These forward-looking statements are based on information available to us as of the date they were made, and should not be relied upon as representing our views as of any subsequent date. These forward-looking statements are subject to a number of risks and uncertainties, including without limitation those risks and uncertainties described in our most recent annual report on Form 10-K and subsequently filed reports on Form 10-Q. A No representations or warranties are made by the Company or its affiliates as to the accuracy of any such statements, opinions, forecasts or projections. Such statements, opinions, forecasts, and projections are not to be viewed as facts. Whether or not any such forward-looking statements, opinions, forecasts or projections are in fact achieved will depend upon future events many of which are not within the control of the Company. Accordingly, actual results may vary materially from the projected results due to a variety of factors including, without limitation, economic and market conditions, political events and investor statements, liquidity of secondary markets, level and volatility of exchange rates, and competitive conditions and such variations may be material. We do not undertake any obligation to update forward-looking statements to reflect events or circumstances after the date they were made, whether as a result of new information, future events or otherwise, except as may be required under applicable securities laws.Forward-Looking Statements We may make forward-looking statements in this presentation within the meaning of the Securities Litigation Reform Act of 1995. These forward-looking statements include, without limitation, statements with respect to our expected Adjusted EBITDA, revenue and margin growth in future periods, our aviation-connectivity installations in future periods, the impact of Boeing 737 MAX aircraft grounding on our financial performance, our business and financial-performance outlook and goals (including our assumptions therein relating to growth in fleet count, ARPA growth, new contract wins and the expected benefits therefrom, opex savings, stable capex spend and lower satellite- bandwidth spend in future periods), industry, business strategy, plans, business and M&A integration activities, capital expenditures, operating-expense and cost-structure improvements and reductions, future operations, margins, profitability, future efficiencies and other financial and operating information. These statements may be preceded by, followed by or include the words “may,” “might,” “will,” “will likely result,” “should,” “estimate,” “plan,” “project,” “forecast,” “intend,” “expect,” “anticipate,” “believe,” “seek,” “continue,” “target” or similar expressions. These forward-looking statements are based on information available to us as of the date they were made, and should not be relied upon as representing our views as of any subsequent date. These forward-looking statements are subject to a number of risks and uncertainties, including without limitation those risks and uncertainties described in our most recent annual report on Form 10-K and subsequently filed reports on Form 10-Q. A No representations or warranties are made by the Company or its affiliates as to the accuracy of any such statements, opinions, forecasts or projections. Such statements, opinions, forecasts, and projections are not to be viewed as facts. Whether or not any such forward-looking statements, opinions, forecasts or projections are in fact achieved will depend upon future events many of which are not within the control of the Company. Accordingly, actual results may vary materially from the projected results due to a variety of factors including, without limitation, economic and market conditions, political events and investor statements, liquidity of secondary markets, level and volatility of exchange rates, and competitive conditions and such variations may be material. We do not undertake any obligation to update forward-looking statements to reflect events or circumstances after the date they were made, whether as a result of new information, future events or otherwise, except as may be required under applicable securities laws.
Confidentiality and Disclaimer of Accuracy and Completeness of Information in this Presentation This presentation is being furnished to you solely for informational purposes and convenient reference during our accompanying comments and may not be reproduced or redistributed, in whole or in part, directly or indirectly, to any other person. This presentation is incomplete without reference to, and should be viewed solely in conjunction with, such comments. Neither this presentation nor any of its contents may be used for any other purpose. You acknowledge that this presentation is confidential, sensitive and proprietary information of the Company. The information contained in this presentation is subject to the provisions of the confidentiality agreement entered into between the Company and your institution. Acceptance of this presentation constitutes an agreement for the benefit of the Company to preserve the confidentiality of the information set forth herein and be bound by the terms hereof and the terms of the confidentiality agreement. This presentation has been prepared to assist interested parties in making their own evaluation of the Company and does not and should not be considered as a recommendation by anyone to engage in a transaction. This presentation does not purport to be all- inclusive or to contain all of the information that a prospective participant may consider material or desirable in making its decision to become a lender. Each recipient of the information and data contained herein should take such steps as it deems necessary to assure that it has the information it considers material or desirable in making its investment decision and should perform its own independent investigation and analysis of the Company. The information in this presentation speaks as of the date hereof or as of the date the information is given. Statements contained herein describing documents and agreements are summaries only and such summaries are qualified in their entirety by reference to such documents and agreements. 3Confidentiality and Disclaimer of Accuracy and Completeness of Information in this Presentation This presentation is being furnished to you solely for informational purposes and convenient reference during our accompanying comments and may not be reproduced or redistributed, in whole or in part, directly or indirectly, to any other person. This presentation is incomplete without reference to, and should be viewed solely in conjunction with, such comments. Neither this presentation nor any of its contents may be used for any other purpose. You acknowledge that this presentation is confidential, sensitive and proprietary information of the Company. The information contained in this presentation is subject to the provisions of the confidentiality agreement entered into between the Company and your institution. Acceptance of this presentation constitutes an agreement for the benefit of the Company to preserve the confidentiality of the information set forth herein and be bound by the terms hereof and the terms of the confidentiality agreement. This presentation has been prepared to assist interested parties in making their own evaluation of the Company and does not and should not be considered as a recommendation by anyone to engage in a transaction. This presentation does not purport to be all- inclusive or to contain all of the information that a prospective participant may consider material or desirable in making its decision to become a lender. Each recipient of the information and data contained herein should take such steps as it deems necessary to assure that it has the information it considers material or desirable in making its investment decision and should perform its own independent investigation and analysis of the Company. The information in this presentation speaks as of the date hereof or as of the date the information is given. Statements contained herein describing documents and agreements are summaries only and such summaries are qualified in their entirety by reference to such documents and agreements. 3

Management Presentation Jeff Leddy Josh Marks Chief Executive Officer Executive Chairman Christian Mezger Peter Lopez Chief Financial Officer VP Finance & Investor Relations 4Management Presentation Jeff Leddy Josh Marks Chief Executive Officer Executive Chairman Christian Mezger Peter Lopez Chief Financial Officer VP Finance & Investor Relations 4
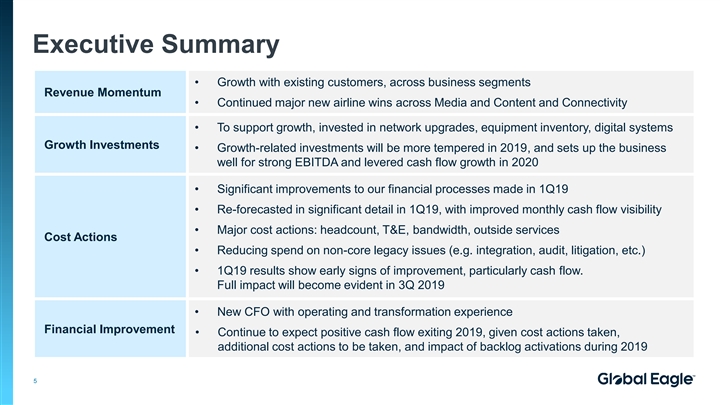
Executive Summary • Growth with existing customers, across business segments Revenue Momentum • Continued major new airline wins across Media and Content and Connectivity • To support growth, invested in network upgrades, equipment inventory, digital systems Growth Investments • Growth-related investments will be more tempered in 2019, and sets up the business well for strong EBITDA and levered cash flow growth in 2020 • Significant improvements to our financial processes made in 1Q19 • Re-forecasted in significant detail in 1Q19, with improved monthly cash flow visibility • Major cost actions: headcount, T&E, bandwidth, outside services Cost Actions • Reducing spend on non-core legacy issues (e.g. integration, audit, litigation, etc.) • 1Q19 results show early signs of improvement, particularly cash flow. Full impact will become evident in 3Q 2019 • New CFO with operating and transformation experience Financial Improvement • Continue to expect positive cash flow exiting 2019, given cost actions taken, additional cost actions to be taken, and impact of backlog activations during 2019 5Executive Summary • Growth with existing customers, across business segments Revenue Momentum • Continued major new airline wins across Media and Content and Connectivity • To support growth, invested in network upgrades, equipment inventory, digital systems Growth Investments • Growth-related investments will be more tempered in 2019, and sets up the business well for strong EBITDA and levered cash flow growth in 2020 • Significant improvements to our financial processes made in 1Q19 • Re-forecasted in significant detail in 1Q19, with improved monthly cash flow visibility • Major cost actions: headcount, T&E, bandwidth, outside services Cost Actions • Reducing spend on non-core legacy issues (e.g. integration, audit, litigation, etc.) • 1Q19 results show early signs of improvement, particularly cash flow. Full impact will become evident in 3Q 2019 • New CFO with operating and transformation experience Financial Improvement • Continue to expect positive cash flow exiting 2019, given cost actions taken, additional cost actions to be taken, and impact of backlog activations during 2019 5
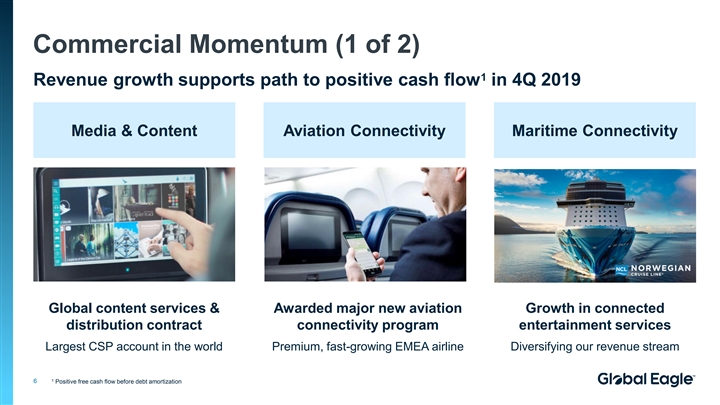
Commercial Momentum (1 of 2) 1 Revenue growth supports path to positive cash flow in 4Q 2019 Media & Content Aviation Connectivity Maritime Connectivity Global content services & Awarded major new aviation Growth in connected distribution contract connectivity program entertainment services Largest CSP account in the world Premium, fast-growing EMEA airline Diversifying our revenue stream 1 6 Positive free cash flow before debt amortizationCommercial Momentum (1 of 2) 1 Revenue growth supports path to positive cash flow in 4Q 2019 Media & Content Aviation Connectivity Maritime Connectivity Global content services & Awarded major new aviation Growth in connected distribution contract connectivity program entertainment services Largest CSP account in the world Premium, fast-growing EMEA airline Diversifying our revenue stream 1 6 Positive free cash flow before debt amortization
Commercial Momentum (2 of 2) Aviation Connectivity Media & Content Maritime Connectivity • $80.0m 1Q19 (+$5.1m YOY) • $45.3m 1Q19 (+$8.4m YOY) • $41.3m 1Q19 (-$1.5m YOY) • 37 installations in 1Q19, 100+ • New contract wins producing • Cruise growth (285 vessels add’l planned 2019, plus revenue (+$22m run-rate) 1Q19 vs. 210 at YE 2017) backlog 300+ from 2020 • Awarded large CSP contract, • Strong TV performance (2x • Air France – 67 shipsets starts July (+$20m run-rate) vs. 2016, mid-teen CAGR) delivered; 15 activated 1Q19 • Driving volume from key • Stabilized other maritime • Southwest – 750 active, accounts and focusing on vessel count & ARPU expect ~800 by YE 2019 margin through content mix • Continuing wind-down in • Major new IFC award has • Jet Airways not included in cellular backhaul (MNO), limited up-front investment 1Q19 revenue – will unprofitable enterprise sites and leverages EMEA network recognize if/when they • Solid government growth emerge from restructuring • Strong deal pipeline that leverages M&C cross-selling 7Commercial Momentum (2 of 2) Aviation Connectivity Media & Content Maritime Connectivity • $80.0m 1Q19 (+$5.1m YOY) • $45.3m 1Q19 (+$8.4m YOY) • $41.3m 1Q19 (-$1.5m YOY) • 37 installations in 1Q19, 100+ • New contract wins producing • Cruise growth (285 vessels add’l planned 2019, plus revenue (+$22m run-rate) 1Q19 vs. 210 at YE 2017) backlog 300+ from 2020 • Awarded large CSP contract, • Strong TV performance (2x • Air France – 67 shipsets starts July (+$20m run-rate) vs. 2016, mid-teen CAGR) delivered; 15 activated 1Q19 • Driving volume from key • Stabilized other maritime • Southwest – 750 active, accounts and focusing on vessel count & ARPU expect ~800 by YE 2019 margin through content mix • Continuing wind-down in • Major new IFC award has • Jet Airways not included in cellular backhaul (MNO), limited up-front investment 1Q19 revenue – will unprofitable enterprise sites and leverages EMEA network recognize if/when they • Solid government growth emerge from restructuring • Strong deal pipeline that leverages M&C cross-selling 7
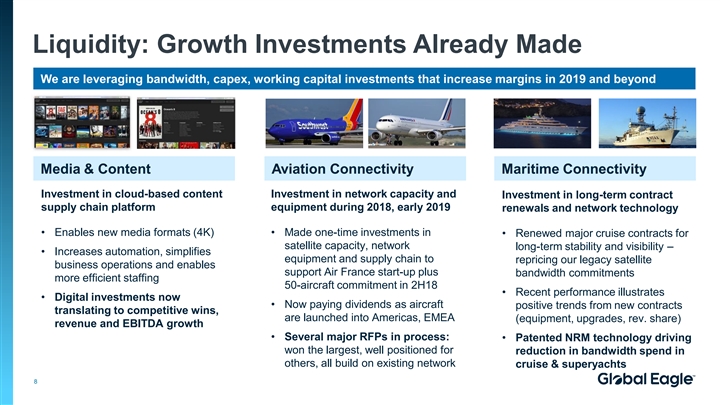
Liquidity: Growth Investments Already Made We are leveraging bandwidth, capex, working capital investments that increase margins in 2019 and beyond Media & Content Aviation Connectivity Maritime Connectivity Investment in cloud-based content Investment in network capacity and Investment in long-term contract supply chain platform equipment during 2018, early 2019 renewals and network technology • Enables new media formats (4K) • Made one-time investments in • Renewed major cruise contracts for satellite capacity, network long-term stability and visibility – • Increases automation, simplifies equipment and supply chain to repricing our legacy satellite business operations and enables support Air France start-up plus bandwidth commitments more efficient staffing 50-aircraft commitment in 2H18 • Recent performance illustrates • Digital investments now • Now paying dividends as aircraft positive trends from new contracts translating to competitive wins, are launched into Americas, EMEA (equipment, upgrades, rev. share) revenue and EBITDA growth • Several major RFPs in process: • Patented NRM technology driving won the largest, well positioned for reduction in bandwidth spend in others, all build on existing network cruise & superyachts 8Liquidity: Growth Investments Already Made We are leveraging bandwidth, capex, working capital investments that increase margins in 2019 and beyond Media & Content Aviation Connectivity Maritime Connectivity Investment in cloud-based content Investment in network capacity and Investment in long-term contract supply chain platform equipment during 2018, early 2019 renewals and network technology • Enables new media formats (4K) • Made one-time investments in • Renewed major cruise contracts for satellite capacity, network long-term stability and visibility – • Increases automation, simplifies equipment and supply chain to repricing our legacy satellite business operations and enables support Air France start-up plus bandwidth commitments more efficient staffing 50-aircraft commitment in 2H18 • Recent performance illustrates • Digital investments now • Now paying dividends as aircraft positive trends from new contracts translating to competitive wins, are launched into Americas, EMEA (equipment, upgrades, rev. share) revenue and EBITDA growth • Several major RFPs in process: • Patented NRM technology driving won the largest, well positioned for reduction in bandwidth spend in others, all build on existing network cruise & superyachts 8
Liquidity: Addressing Legacy Issues Below-the-line spending has been headwind to cash generation • We have been impacted by below-the-line spend related to legacy acquisition issues • Audit spend, material weakness remediation, litigation and business integration during 2017-2018 • Integrating 20+ discrete companies with previously independent processes • Costs related to IT systems, severance, facilities consolidation, etc. • Spending on these legacy issues significantly impacted cash generation; key focus to minimize this spend going forward. New CFO has transformation experience to help drive results • Milestones achieved: ERP integration, 2 material weaknesses remediated (several to follow in 2019), office consolidation (exiting 18 offices by YE 2019), and headcount rationalization • First-quarter results highlight significant progress in reducing non-core spend: • Reduced below-the-line spending 41% YOY (or 56% excluding severance) • Expect continued progress on below-the-line expenses throughout 2019 and 2020 9Liquidity: Addressing Legacy Issues Below-the-line spending has been headwind to cash generation • We have been impacted by below-the-line spend related to legacy acquisition issues • Audit spend, material weakness remediation, litigation and business integration during 2017-2018 • Integrating 20+ discrete companies with previously independent processes • Costs related to IT systems, severance, facilities consolidation, etc. • Spending on these legacy issues significantly impacted cash generation; key focus to minimize this spend going forward. New CFO has transformation experience to help drive results • Milestones achieved: ERP integration, 2 material weaknesses remediated (several to follow in 2019), office consolidation (exiting 18 offices by YE 2019), and headcount rationalization • First-quarter results highlight significant progress in reducing non-core spend: • Reduced below-the-line spending 41% YOY (or 56% excluding severance) • Expect continued progress on below-the-line expenses throughout 2019 and 2020 9
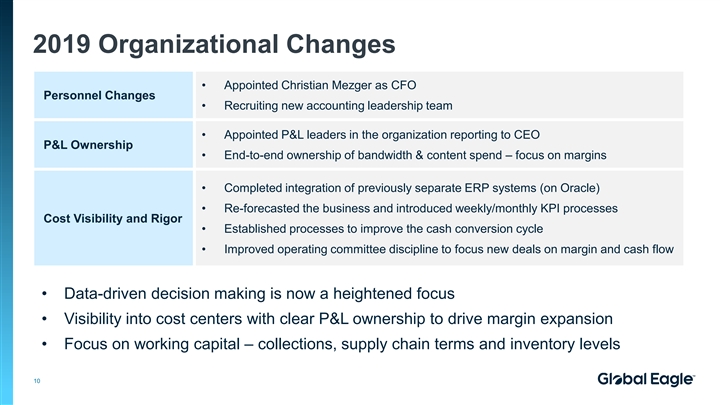
2019 Organizational Changes • Appointed Christian Mezger as CFO Personnel Changes • Recruiting new accounting leadership team • Appointed P&L leaders in the organization reporting to CEO P&L Ownership • End-to-end ownership of bandwidth & content spend – focus on margins • Completed integration of previously separate ERP systems (on Oracle) • Re-forecasted the business and introduced weekly/monthly KPI processes Cost Visibility and Rigor • Established processes to improve the cash conversion cycle • Improved operating committee discipline to focus new deals on margin and cash flow • Data-driven decision making is now a heightened focus • Visibility into cost centers with clear P&L ownership to drive margin expansion • Focus on working capital – collections, supply chain terms and inventory levels 102019 Organizational Changes • Appointed Christian Mezger as CFO Personnel Changes • Recruiting new accounting leadership team • Appointed P&L leaders in the organization reporting to CEO P&L Ownership • End-to-end ownership of bandwidth & content spend – focus on margins • Completed integration of previously separate ERP systems (on Oracle) • Re-forecasted the business and introduced weekly/monthly KPI processes Cost Visibility and Rigor • Established processes to improve the cash conversion cycle • Improved operating committee discipline to focus new deals on margin and cash flow • Data-driven decision making is now a heightened focus • Visibility into cost centers with clear P&L ownership to drive margin expansion • Focus on working capital – collections, supply chain terms and inventory levels 10
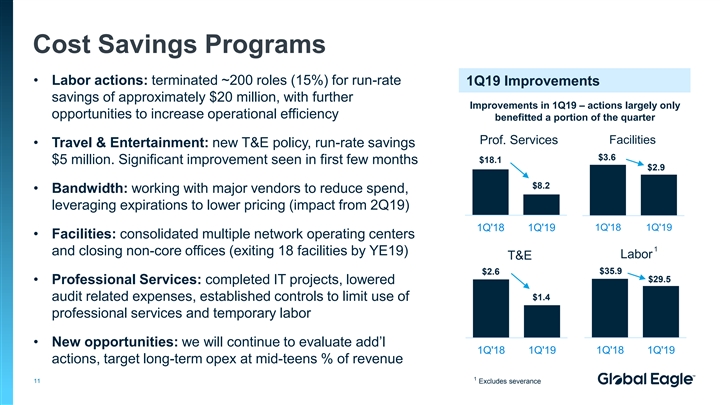
Cost Savings Programs • Labor actions: terminated ~200 roles (15%) for run-rate 1Q19 Improvements savings of approximately $20 million, with further Improvements in 1Q19 – actions largely only opportunities to increase operational efficiency benefitted a portion of the quarter Prof. Services Facilities • Travel & Entertainment: new T&E policy, run-rate savings $3.6 $18.1 $5 million. Significant improvement seen in first few months $2.9 $8.2 • Bandwidth: working with major vendors to reduce spend, leveraging expirations to lower pricing (impact from 2Q19) 1Q'18 1Q'19 1Q'18 1Q'19 • Facilities: consolidated multiple network operating centers 1 and closing non-core offices (exiting 18 facilities by YE19) Labor T&E $35.9 $2.6 $29.5 • Professional Services: completed IT projects, lowered $1.4 audit related expenses, established controls to limit use of professional services and temporary labor • New opportunities: we will continue to evaluate add’l 1Q'18 1Q'19 1Q'18 1Q'19 actions, target long-term opex at mid-teens % of revenue 1 11 Excludes severanceCost Savings Programs • Labor actions: terminated ~200 roles (15%) for run-rate 1Q19 Improvements savings of approximately $20 million, with further Improvements in 1Q19 – actions largely only opportunities to increase operational efficiency benefitted a portion of the quarter Prof. Services Facilities • Travel & Entertainment: new T&E policy, run-rate savings $3.6 $18.1 $5 million. Significant improvement seen in first few months $2.9 $8.2 • Bandwidth: working with major vendors to reduce spend, leveraging expirations to lower pricing (impact from 2Q19) 1Q'18 1Q'19 1Q'18 1Q'19 • Facilities: consolidated multiple network operating centers 1 and closing non-core offices (exiting 18 facilities by YE19) Labor T&E $35.9 $2.6 $29.5 • Professional Services: completed IT projects, lowered $1.4 audit related expenses, established controls to limit use of professional services and temporary labor • New opportunities: we will continue to evaluate add’l 1Q'18 1Q'19 1Q'18 1Q'19 actions, target long-term opex at mid-teens % of revenue 1 11 Excludes severance
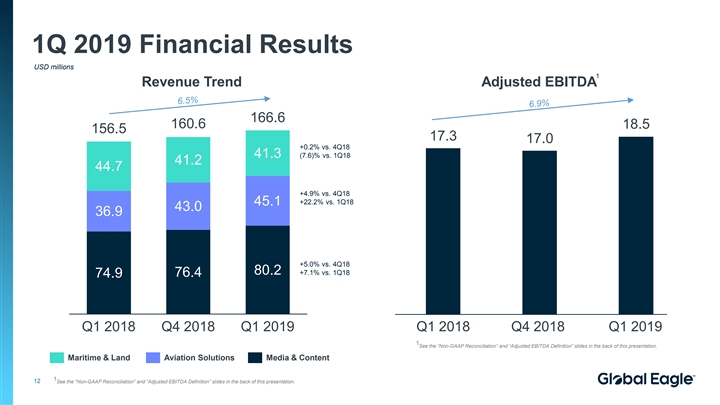
1Q 2019 Financial Results USD millions 1 Revenue Trend Adjusted EBITDA 166.6 160.6 18.5 156.5 17.3 17.0 +0.2% vs. 4Q18 41.3 (7.6)% vs. 1Q18 41.2 44.7 +4.9% vs. 4Q18 +22.2% vs. 1Q18 45.1 43.0 36.9 $619 $260 $388 $426 $530 +5.0% vs. 4Q18 80.2 +7.1% vs. 1Q18 76.4 74.9 Q1 2018 Q4 2018 Q1 2019 Q1 2018 Q4 2018 Q1 2019 1 See the “Non-GAAP Reconciliation” and “Adjusted EBITDA Definition” slides in the back of this presentation. Maritime & Land Aviation Solutions Media & Content 1 12 See the “Non-GAAP Reconciliation” and “Adjusted EBITDA Definition” slides in the back of this presentation.1Q 2019 Financial Results USD millions 1 Revenue Trend Adjusted EBITDA 166.6 160.6 18.5 156.5 17.3 17.0 +0.2% vs. 4Q18 41.3 (7.6)% vs. 1Q18 41.2 44.7 +4.9% vs. 4Q18 +22.2% vs. 1Q18 45.1 43.0 36.9 $619 $260 $388 $426 $530 +5.0% vs. 4Q18 80.2 +7.1% vs. 1Q18 76.4 74.9 Q1 2018 Q4 2018 Q1 2019 Q1 2018 Q4 2018 Q1 2019 1 See the “Non-GAAP Reconciliation” and “Adjusted EBITDA Definition” slides in the back of this presentation. Maritime & Land Aviation Solutions Media & Content 1 12 See the “Non-GAAP Reconciliation” and “Adjusted EBITDA Definition” slides in the back of this presentation.
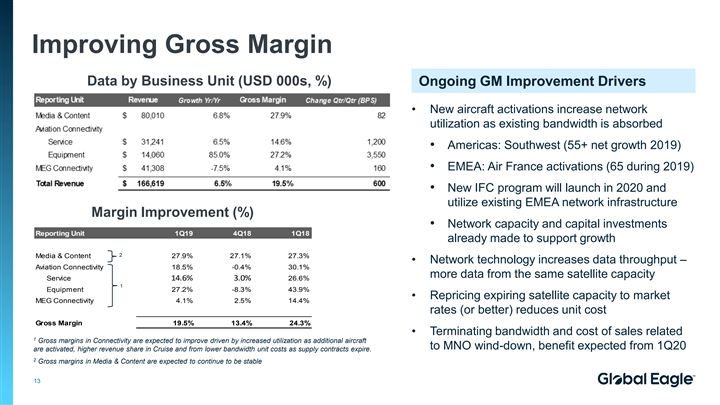
Improving Gross Margin Data by Business Unit (USD 000s, %) Ongoing GM Improvement Drivers • New aircraft activations increase network utilization as existing bandwidth is absorbed • Americas: Southwest (55+ net growth 2019) • EMEA: Air France activations (65 during 2019) • New IFC program will launch in 2020 and utilize existing EMEA network infrastructure Margin Improvement (%) • Network capacity and capital investments Reporting Unit 1Q19 4Q18 1Q18 already made to support growth 2 Media & Content 27.9% 27.1% 27.3% • Network technology increases data throughput – Aviation Connectivity 18.5% -0.4% 30.1% more data from the same satellite capacity Service 14.6% 3.0% 26.6% 1 Equipment 27.2% -8.3% 43.9% • Repricing expiring satellite capacity to market MEG Connectivity 4.1% 2.5% 14.4% rates (or better) reduces unit cost Gross Margin 19.5% 13.4% 24.3% • Terminating bandwidth and cost of sales related 1 Gross margins in Connectivity are expected to improve driven by increased utilization as additional aircraft to MNO wind-down, benefit expected from 1Q20 are activated, higher revenue share in Cruise and from lower bandwidth unit costs as supply contracts expire. 2 Gross margins in Media & Content are expected to continue to be stable 13Improving Gross Margin Data by Business Unit (USD 000s, %) Ongoing GM Improvement Drivers • New aircraft activations increase network utilization as existing bandwidth is absorbed • Americas: Southwest (55+ net growth 2019) • EMEA: Air France activations (65 during 2019) • New IFC program will launch in 2020 and utilize existing EMEA network infrastructure Margin Improvement (%) • Network capacity and capital investments Reporting Unit 1Q19 4Q18 1Q18 already made to support growth 2 Media & Content 27.9% 27.1% 27.3% • Network technology increases data throughput – Aviation Connectivity 18.5% -0.4% 30.1% more data from the same satellite capacity Service 14.6% 3.0% 26.6% 1 Equipment 27.2% -8.3% 43.9% • Repricing expiring satellite capacity to market MEG Connectivity 4.1% 2.5% 14.4% rates (or better) reduces unit cost Gross Margin 19.5% 13.4% 24.3% • Terminating bandwidth and cost of sales related 1 Gross margins in Connectivity are expected to improve driven by increased utilization as additional aircraft to MNO wind-down, benefit expected from 1Q20 are activated, higher revenue share in Cruise and from lower bandwidth unit costs as supply contracts expire. 2 Gross margins in Media & Content are expected to continue to be stable 13
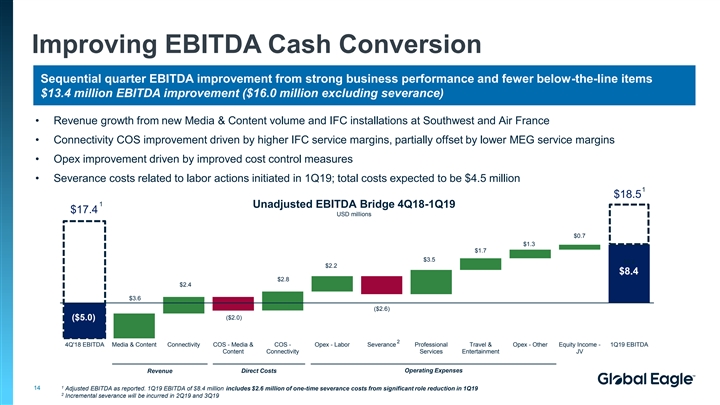
Improving EBITDA Cash Conversion Sequential quarter EBITDA improvement from strong business performance and fewer below-the-line items $13.4 million EBITDA improvement ($16.0 million excluding severance) • Revenue growth from new Media & Content volume and IFC installations at Southwest and Air France • Connectivity COS improvement driven by higher IFC service margins, partially offset by lower MEG service margins • Opex improvement driven by improved cost control measures • Severance costs related to labor actions initiated in 1Q19; total costs expected to be $4.5 million 1 $18.5 1 Unadjusted EBITDA Bridge 4Q18-1Q19 $17.4 USD millions $0.7 $1.3 $1.7 $3.5 $8.4 $2.2 $8.4 $2.8 $2.4 $3.6 ($2.6) ($5.0) ($2.0) 2 4Q'18 EBITDA Media & Content Connectivity COS - Media & COS - Opex - Labor Severance Professional Travel & Opex - Other Equity Income - 1Q19 EBITDA Content Connectivity Services Entertainment JV Revenue Direct Costs Operating Expenses 1 14 Adjusted EBITDA as reported. 1Q19 EBITDA of $8.4 million includes $2.6 million of one-time severance costs from significant role reduction in 1Q19 2 Incremental severance will be incurred in 2Q19 and 3Q19Improving EBITDA Cash Conversion Sequential quarter EBITDA improvement from strong business performance and fewer below-the-line items $13.4 million EBITDA improvement ($16.0 million excluding severance) • Revenue growth from new Media & Content volume and IFC installations at Southwest and Air France • Connectivity COS improvement driven by higher IFC service margins, partially offset by lower MEG service margins • Opex improvement driven by improved cost control measures • Severance costs related to labor actions initiated in 1Q19; total costs expected to be $4.5 million 1 $18.5 1 Unadjusted EBITDA Bridge 4Q18-1Q19 $17.4 USD millions $0.7 $1.3 $1.7 $3.5 $8.4 $2.2 $8.4 $2.8 $2.4 $3.6 ($2.6) ($5.0) ($2.0) 2 4Q'18 EBITDA Media & Content Connectivity COS - Media & COS - Opex - Labor Severance Professional Travel & Opex - Other Equity Income - 1Q19 EBITDA Content Connectivity Services Entertainment JV Revenue Direct Costs Operating Expenses 1 14 Adjusted EBITDA as reported. 1Q19 EBITDA of $8.4 million includes $2.6 million of one-time severance costs from significant role reduction in 1Q19 2 Incremental severance will be incurred in 2Q19 and 3Q19
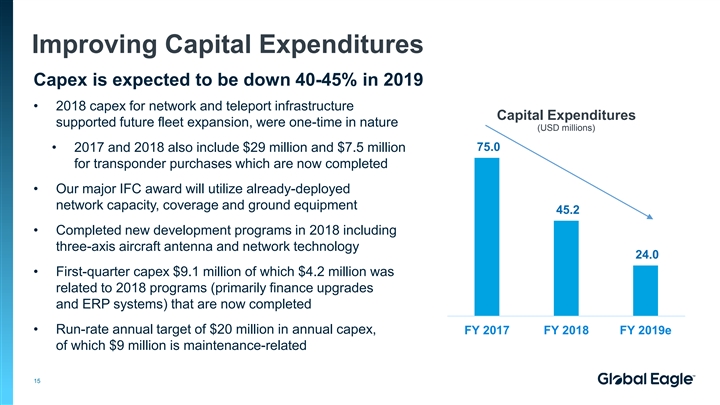
Improving Capital Expenditures Capex is expected to be down 40-45% in 2019 • 2018 capex for network and teleport infrastructure Capital Expenditures supported future fleet expansion, were one-time in nature (USD millions) 75.0 • 2017 and 2018 also include $29 million and $7.5 million for transponder purchases which are now completed • Our major IFC award will utilize already-deployed network capacity, coverage and ground equipment 45.2 • Completed new development programs in 2018 including three-axis aircraft antenna and network technology 24.0 • First-quarter capex $9.1 million of which $4.2 million was related to 2018 programs (primarily finance upgrades and ERP systems) that are now completed • Run-rate annual target of $20 million in annual capex, FY 2017 FY 2018 FY 2019e of which $9 million is maintenance-related 15Improving Capital Expenditures Capex is expected to be down 40-45% in 2019 • 2018 capex for network and teleport infrastructure Capital Expenditures supported future fleet expansion, were one-time in nature (USD millions) 75.0 • 2017 and 2018 also include $29 million and $7.5 million for transponder purchases which are now completed • Our major IFC award will utilize already-deployed network capacity, coverage and ground equipment 45.2 • Completed new development programs in 2018 including three-axis aircraft antenna and network technology 24.0 • First-quarter capex $9.1 million of which $4.2 million was related to 2018 programs (primarily finance upgrades and ERP systems) that are now completed • Run-rate annual target of $20 million in annual capex, FY 2017 FY 2018 FY 2019e of which $9 million is maintenance-related 15
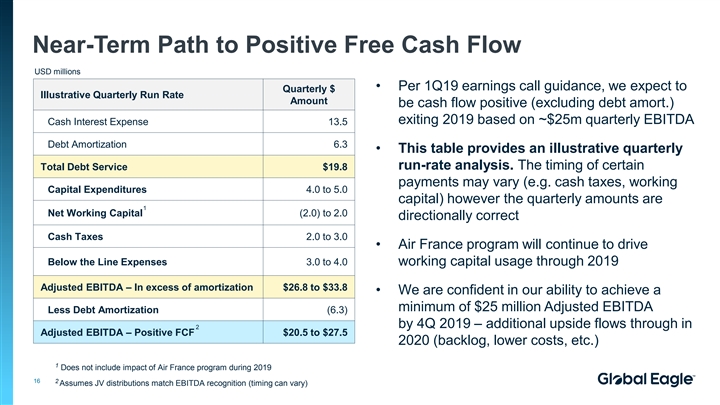
Near-Term Path to Positive Free Cash Flow USD millions • Per 1Q19 earnings call guidance, we expect to Quarterly $ Illustrative Quarterly Run Rate Amount be cash flow positive (excluding debt amort.) exiting 2019 based on ~$25m quarterly EBITDA Cash Interest Expense 13.5 Debt Amortization 6.3 • This table provides an illustrative quarterly Total Debt Service $19.8 run-rate analysis. The timing of certain payments may vary (e.g. cash taxes, working Capital Expenditures 4.0 to 5.0 capital) however the quarterly amounts are 1 Net Working Capital (2.0) to 2.0 directionally correct Cash Taxes 2.0 to 3.0 • Air France program will continue to drive Below the Line Expenses 3.0 to 4.0 working capital usage through 2019 Adjusted EBITDA – In excess of amortization $26.8 to $33.8 • We are confident in our ability to achieve a minimum of $25 million Adjusted EBITDA Less Debt Amortization (6.3) by 4Q 2019 – additional upside flows through in 2 Adjusted EBITDA – Positive FCF $20.5 to $27.5 2020 (backlog, lower costs, etc.) 1 Does not include impact of Air France program during 2019 16 2 Assumes JV distributions match EBITDA recognition (timing can vary)Near-Term Path to Positive Free Cash Flow USD millions • Per 1Q19 earnings call guidance, we expect to Quarterly $ Illustrative Quarterly Run Rate Amount be cash flow positive (excluding debt amort.) exiting 2019 based on ~$25m quarterly EBITDA Cash Interest Expense 13.5 Debt Amortization 6.3 • This table provides an illustrative quarterly Total Debt Service $19.8 run-rate analysis. The timing of certain payments may vary (e.g. cash taxes, working Capital Expenditures 4.0 to 5.0 capital) however the quarterly amounts are 1 Net Working Capital (2.0) to 2.0 directionally correct Cash Taxes 2.0 to 3.0 • Air France program will continue to drive Below the Line Expenses 3.0 to 4.0 working capital usage through 2019 Adjusted EBITDA – In excess of amortization $26.8 to $33.8 • We are confident in our ability to achieve a minimum of $25 million Adjusted EBITDA Less Debt Amortization (6.3) by 4Q 2019 – additional upside flows through in 2 Adjusted EBITDA – Positive FCF $20.5 to $27.5 2020 (backlog, lower costs, etc.) 1 Does not include impact of Air France program during 2019 16 2 Assumes JV distributions match EBITDA recognition (timing can vary)
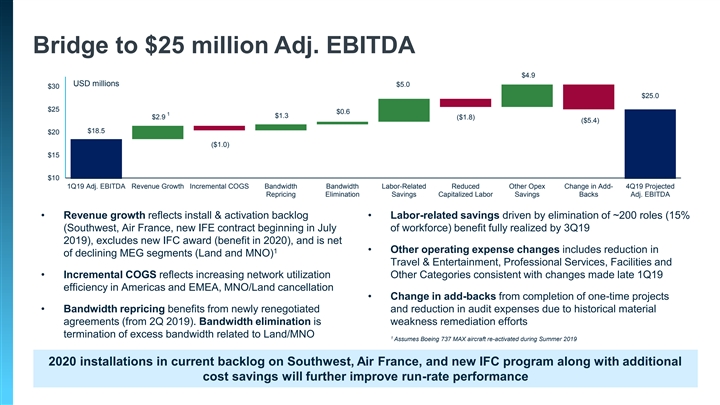
Bridge to $25 million Adj. EBITDA $35 $4.9 USD millions $5.0 $30 $25.0 $25 $0.6 1 $1.3 $2.9 ($1.8) ($5.4) $18.5 $20 ($1.0) $15 $10 1Q19 Adj. EBITDA Revenue Growth Incremental COGS Bandwidth Bandwidth Labor-Related Reduced Other Opex Change in Add- 4Q19 Projected Repricing Elimination Savings Capitalized Labor Savings Backs Adj. EBITDA • Revenue growth reflects install & activation backlog • Labor-related savings driven by elimination of ~200 roles (15% (Southwest, Air France, new IFE contract beginning in July of workforce) benefit fully realized by 3Q19 2019), excludes new IFC award (benefit in 2020), and is net • Other operating expense changes includes reduction in 1 of declining MEG segments (Land and MNO) Travel & Entertainment, Professional Services, Facilities and • Incremental COGS reflects increasing network utilization Other Categories consistent with changes made late 1Q19 efficiency in Americas and EMEA, MNO/Land cancellation • Change in add-backs from completion of one-time projects • Bandwidth repricing benefits from newly renegotiated and reduction in audit expenses due to historical material agreements (from 2Q 2019). Bandwidth elimination is weakness remediation efforts termination of excess bandwidth related to Land/MNO 1 Assumes Boeing 737 MAX aircraft re-activated during Summer 2019 2020 installations in current backlog on Southwest, Air France, and new IFC program along with additional cost savings will further improve run-rate performance 17Bridge to $25 million Adj. EBITDA $35 $4.9 USD millions $5.0 $30 $25.0 $25 $0.6 1 $1.3 $2.9 ($1.8) ($5.4) $18.5 $20 ($1.0) $15 $10 1Q19 Adj. EBITDA Revenue Growth Incremental COGS Bandwidth Bandwidth Labor-Related Reduced Other Opex Change in Add- 4Q19 Projected Repricing Elimination Savings Capitalized Labor Savings Backs Adj. EBITDA • Revenue growth reflects install & activation backlog • Labor-related savings driven by elimination of ~200 roles (15% (Southwest, Air France, new IFE contract beginning in July of workforce) benefit fully realized by 3Q19 2019), excludes new IFC award (benefit in 2020), and is net • Other operating expense changes includes reduction in 1 of declining MEG segments (Land and MNO) Travel & Entertainment, Professional Services, Facilities and • Incremental COGS reflects increasing network utilization Other Categories consistent with changes made late 1Q19 efficiency in Americas and EMEA, MNO/Land cancellation • Change in add-backs from completion of one-time projects • Bandwidth repricing benefits from newly renegotiated and reduction in audit expenses due to historical material agreements (from 2Q 2019). Bandwidth elimination is weakness remediation efforts termination of excess bandwidth related to Land/MNO 1 Assumes Boeing 737 MAX aircraft re-activated during Summer 2019 2020 installations in current backlog on Southwest, Air France, and new IFC program along with additional cost savings will further improve run-rate performance 17
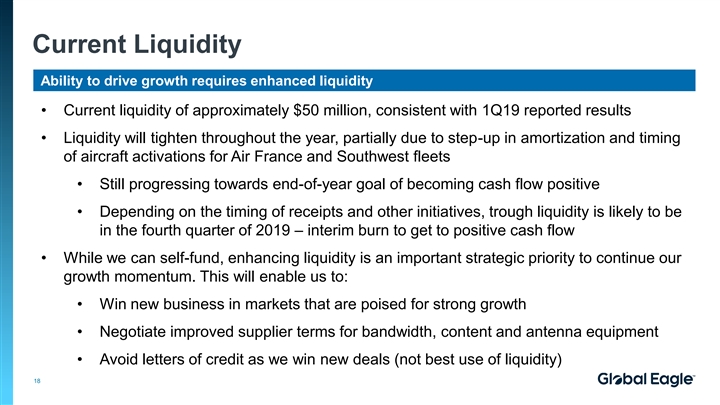
Current Liquidity Ability to drive growth requires enhanced liquidity • Current liquidity of approximately $50 million, consistent with 1Q19 reported results • Liquidity will tighten throughout the year, partially due to step-up in amortization and timing of aircraft activations for Air France and Southwest fleets • Still progressing towards end-of-year goal of becoming cash flow positive • Depending on the timing of receipts and other initiatives, trough liquidity is likely to be in the fourth quarter of 2019 – interim burn to get to positive cash flow • While we can self-fund, enhancing liquidity is an important strategic priority to continue our growth momentum. This will enable us to: • Win new business in markets that are poised for strong growth • Negotiate improved supplier terms for bandwidth, content and antenna equipment • Avoid letters of credit as we win new deals (not best use of liquidity) 18Current Liquidity Ability to drive growth requires enhanced liquidity • Current liquidity of approximately $50 million, consistent with 1Q19 reported results • Liquidity will tighten throughout the year, partially due to step-up in amortization and timing of aircraft activations for Air France and Southwest fleets • Still progressing towards end-of-year goal of becoming cash flow positive • Depending on the timing of receipts and other initiatives, trough liquidity is likely to be in the fourth quarter of 2019 – interim burn to get to positive cash flow • While we can self-fund, enhancing liquidity is an important strategic priority to continue our growth momentum. This will enable us to: • Win new business in markets that are poised for strong growth • Negotiate improved supplier terms for bandwidth, content and antenna equipment • Avoid letters of credit as we win new deals (not best use of liquidity) 18
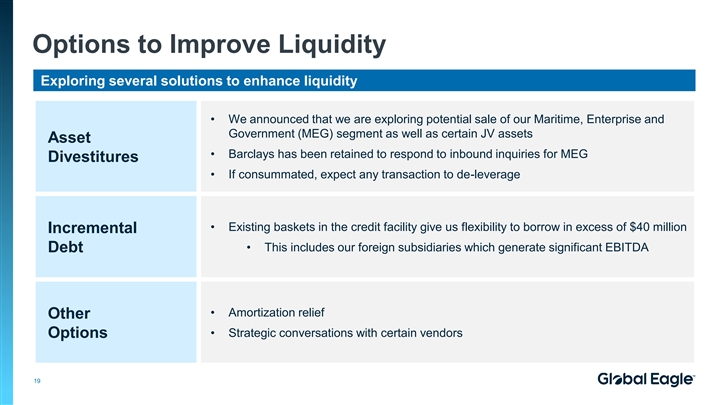
Options to Improve Liquidity Exploring several solutions to enhance liquidity • We announced that we are exploring potential sale of our Maritime, Enterprise and Government (MEG) segment as well as certain JV assets Asset • Barclays has been retained to respond to inbound inquiries for MEG Divestitures • If consummated, expect any transaction to de-leverage • Existing baskets in the credit facility give us flexibility to borrow in excess of $40 million Incremental • This includes our foreign subsidiaries which generate significant EBITDA Debt • Amortization relief Other • Strategic conversations with certain vendors Options 19Options to Improve Liquidity Exploring several solutions to enhance liquidity • We announced that we are exploring potential sale of our Maritime, Enterprise and Government (MEG) segment as well as certain JV assets Asset • Barclays has been retained to respond to inbound inquiries for MEG Divestitures • If consummated, expect any transaction to de-leverage • Existing baskets in the credit facility give us flexibility to borrow in excess of $40 million Incremental • This includes our foreign subsidiaries which generate significant EBITDA Debt • Amortization relief Other • Strategic conversations with certain vendors Options 19
Appendix 1 – 1Q19 Webcast Slides First Lien Presentation (MNPI)Appendix 1 – 1Q19 Webcast Slides First Lien Presentation (MNPI)
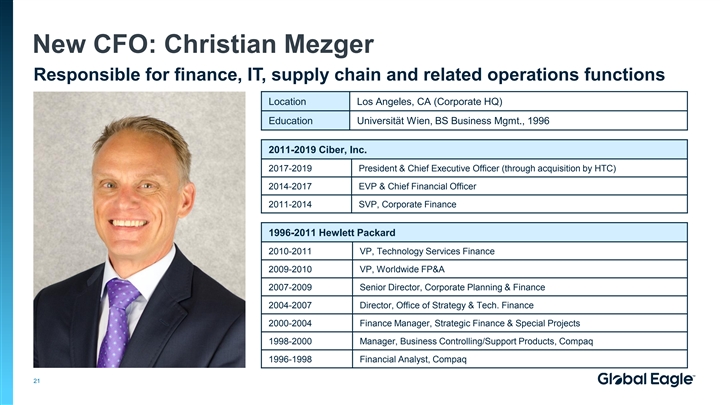
New CFO: Christian Mezger Responsible for finance, IT, supply chain and related operations functions Location Los Angeles, CA (Corporate HQ) Education Universität Wien, BS Business Mgmt., 1996 2011-2019 Ciber, Inc. 2017-2019 President & Chief Executive Officer (through acquisition by HTC) 2014-2017 EVP & Chief Financial Officer 2011-2014 SVP, Corporate Finance 1996-2011 Hewlett Packard 2010-2011 VP, Technology Services Finance 2009-2010 VP, Worldwide FP&A 2007-2009 Senior Director, Corporate Planning & Finance 2004-2007 Director, Office of Strategy & Tech. Finance 2000-2004 Finance Manager, Strategic Finance & Special Projects 1998-2000 Manager, Business Controlling/Support Products, Compaq 1996-1998 Financial Analyst, Compaq 21New CFO: Christian Mezger Responsible for finance, IT, supply chain and related operations functions Location Los Angeles, CA (Corporate HQ) Education Universität Wien, BS Business Mgmt., 1996 2011-2019 Ciber, Inc. 2017-2019 President & Chief Executive Officer (through acquisition by HTC) 2014-2017 EVP & Chief Financial Officer 2011-2014 SVP, Corporate Finance 1996-2011 Hewlett Packard 2010-2011 VP, Technology Services Finance 2009-2010 VP, Worldwide FP&A 2007-2009 Senior Director, Corporate Planning & Finance 2004-2007 Director, Office of Strategy & Tech. Finance 2000-2004 Finance Manager, Strategic Finance & Special Projects 1998-2000 Manager, Business Controlling/Support Products, Compaq 1996-1998 Financial Analyst, Compaq 21
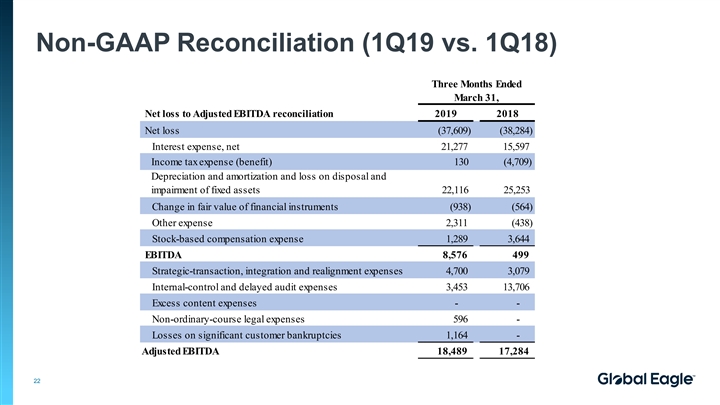
Non-GAAP Reconciliation (1Q19 vs. 1Q18) Three Months Ended March 31, Net loss to Adjusted EBITDA reconciliation 2019 2018 Net loss ( 37,609) (38,284) Interest expense, net 21,277 15,597 Income tax expense (benefit) 130 (4,709) Depreciation and amortization and loss on disposal and impairment of fixed assets 22,116 25,253 Change in fair value of financial instruments ( 938) (564) Other expense 2,311 ( 438) Stock-based compensation expense 1,289 3,644 EBITDA 8,576 499 Strategic-transaction, integration and realignment expenses 4,700 3,079 Internal-control and delayed audit expenses 3,453 13,706 Excess content expenses - - Non-ordinary-course legal expenses 596 - Losses on significant customer bankruptcies 1,164 - Adjusted EBITDA 18,489 17,284 22Non-GAAP Reconciliation (1Q19 vs. 1Q18) Three Months Ended March 31, Net loss to Adjusted EBITDA reconciliation 2019 2018 Net loss ( 37,609) (38,284) Interest expense, net 21,277 15,597 Income tax expense (benefit) 130 (4,709) Depreciation and amortization and loss on disposal and impairment of fixed assets 22,116 25,253 Change in fair value of financial instruments ( 938) (564) Other expense 2,311 ( 438) Stock-based compensation expense 1,289 3,644 EBITDA 8,576 499 Strategic-transaction, integration and realignment expenses 4,700 3,079 Internal-control and delayed audit expenses 3,453 13,706 Excess content expenses - - Non-ordinary-course legal expenses 596 - Losses on significant customer bankruptcies 1,164 - Adjusted EBITDA 18,489 17,284 22
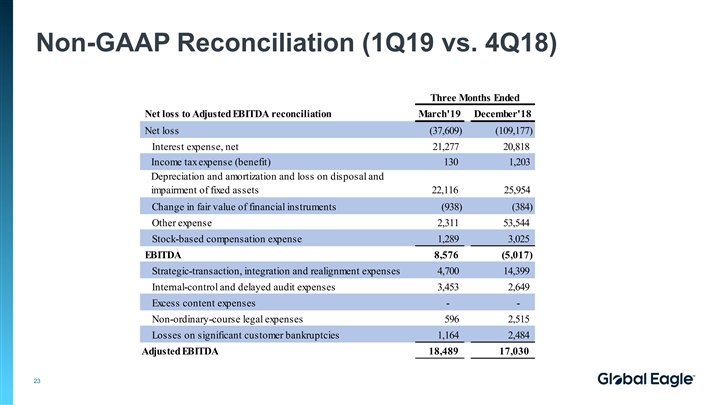
Non-GAAP Reconciliation (1Q19 vs. 4Q18) Three Months Ended Net loss to Adjusted EBITDA reconciliation March'19 December'18 Net loss (37,609) ( 109,177) Interest expense, net 21,277 20,818 Income tax expense (benefit) 130 1,203 Depreciation and amortization and loss on disposal and impairment of fixed assets 22,116 25,954 Change in fair value of financial instruments (938) (384) Other expense 2 ,311 53,544 Stock-based compensation expense 1 ,289 3,025 EBITDA 8,576 (5,017) Strategic-transaction, integration and realignment expenses 4,700 14,399 Internal-control and delayed audit expenses 3 ,453 2,649 Excess content expenses - - Non-ordinary-course legal expenses 596 2,515 Losses on significant customer bankruptcies 1 ,164 2,484 Adjusted EBITDA 18,489 17,030 23Non-GAAP Reconciliation (1Q19 vs. 4Q18) Three Months Ended Net loss to Adjusted EBITDA reconciliation March'19 December'18 Net loss (37,609) ( 109,177) Interest expense, net 21,277 20,818 Income tax expense (benefit) 130 1,203 Depreciation and amortization and loss on disposal and impairment of fixed assets 22,116 25,954 Change in fair value of financial instruments (938) (384) Other expense 2 ,311 53,544 Stock-based compensation expense 1 ,289 3,025 EBITDA 8,576 (5,017) Strategic-transaction, integration and realignment expenses 4,700 14,399 Internal-control and delayed audit expenses 3 ,453 2,649 Excess content expenses - - Non-ordinary-course legal expenses 596 2,515 Losses on significant customer bankruptcies 1 ,164 2,484 Adjusted EBITDA 18,489 17,030 23
Appendix 2 – Specific Q&A First Lien Presentation (MNPI)Appendix 2 – Specific Q&A First Lien Presentation (MNPI)
Special Notice of Material Non-Public Information This appendix may contain material non-public information concerning Global Eagle Entertainment Inc. (the “Company”). By reviewing this appendix, the recipient agrees to use any such information in accordance with its compliance policies, contractual obligations, applicable law, including federal and state securities laws, and the confidentiality provisions set forth below. The recipient agrees, with respect to any material non-public information, that it will not trade or effect other transactions to which such information may be relevant until such time as the information is made generally available or is no longer relevant. The recipient agrees that this restriction will apply to its entire firm other than any personnel who are permitted to trade by such recipient’s legal or compliance department due to the existence of information barriers that ensure the recipient’s firm is restricted from trading on the basis of material non-public information. 25Special Notice of Material Non-Public Information This appendix may contain material non-public information concerning Global Eagle Entertainment Inc. (the “Company”). By reviewing this appendix, the recipient agrees to use any such information in accordance with its compliance policies, contractual obligations, applicable law, including federal and state securities laws, and the confidentiality provisions set forth below. The recipient agrees, with respect to any material non-public information, that it will not trade or effect other transactions to which such information may be relevant until such time as the information is made generally available or is no longer relevant. The recipient agrees that this restriction will apply to its entire firm other than any personnel who are permitted to trade by such recipient’s legal or compliance department due to the existence of information barriers that ensure the recipient’s firm is restricted from trading on the basis of material non-public information. 25
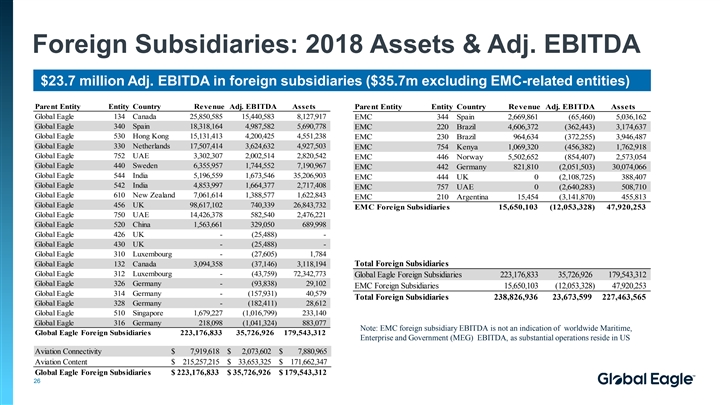
Foreign Subsidiaries: 2018 Assets & Adj. EBITDA $23.7 million Adj. EBITDA in foreign subsidiaries ($35.7m excluding EMC-related entities) Parent Entity Entity Country Revenue Adj. EBITDA Assets Parent Entity Entity Country Revenue Adj. EBITDA Assets Global Eagle 134 Canada 25,850,585 15,440,583 8,127,917 EMC 344 Spain 2,669,861 (65,460) 5,036,162 Global Eagle 340 Spain 18,318,164 4,987,582 5,690,778 EMC 220 Brazil 4,606,372 (362,443) 3,174,637 Global Eagle 530 Hong Kong 15,131,413 4,200,425 4,551,238 EMC 230 Brazil 964,634 (372,255) 3,946,487 Global Eagle 330 Netherlands 17,507,414 3,624,632 4,927,503 EMC 754 Kenya 1,069,320 (456,382) 1,762,918 Global Eagle 752 UAE 3,302,307 2,002,514 2,820,542 EMC 446 Norway 5,502,652 (854,407) 2,573,054 Global Eagle 440 Sweden 6,355,957 1,744,552 7,190,967 EMC 442 Germany 821,810 (2,051,503) 30,074,066 Global Eagle 544 India 5,196,559 1,673,546 35,206,903 EMC 444 UK 0 (2,108,725) 388,407 Global Eagle 542 India 4,853,997 1,664,377 2,717,408 EMC 757 UAE 0 (2,640,283) 508,710 Global Eagle 610 New Zealand 7,061,614 1,388,577 1,622,843 EMC 210 Argentina 15,454 (3,141,870) 455,813 Global Eagle 456 UK 98,617,102 740,339 26,843,732 EMC Foreign Subsidiaries 15,650,103 (12,053,328) 47,920,253 Global Eagle 750 UAE 14,426,378 582,540 2,476,221 Global Eagle 520 China 1,563,661 329,050 689,998 Global Eagle 426 UK - (25,488) - Global Eagle 430 UK - (25,488) - Global Eagle 310 Luxembourg - (27,605) 1,784 Global Eagle 132 Canada 3,094,358 (37,146) 3,118,194 Total Foreign Subsidiaries Global Eagle 312 Luxembourg - (43,759) 72,342,773 Global Eagle Foreign Subsidiaries 223,176,833 35,726,926 179,543,312 Global Eagle 326 Germany - (93,838) 29,102 EMC Foreign Subsidiaries 15,650,103 (12,053,328) 47,920,253 Global Eagle 314 Germany - (157,931) 40,579 Total Foreign Subsidiaries 238,826,936 23,673,599 227,463,565 Global Eagle 328 Germany - (182,411) 28,612 Global Eagle 510 Singapore 1,679,227 (1,016,799) 233,140 Global Eagle 316 Germany 218,098 (1,041,324) 883,077 Note: EMC foreign subsidiary EBITDA is not an indication of worldwide Maritime, Global Eagle Foreign Subsidiaries 223,176,833 35,726,926 179,543,312 Enterprise and Government (MEG) EBITDA, as substantial operations reside in US Aviation Connectivity $ 7,919,618 $ 2,073,602 $ 7,880,965 Aviation Content $ 215,257,215 $ 33,653,325 $ 171,662,347 Global Eagle Foreign Subsidiaries $ 223,176,833 $ 35,726,926 $ 179,543,312 26Foreign Subsidiaries: 2018 Assets & Adj. EBITDA $23.7 million Adj. EBITDA in foreign subsidiaries ($35.7m excluding EMC-related entities) Parent Entity Entity Country Revenue Adj. EBITDA Assets Parent Entity Entity Country Revenue Adj. EBITDA Assets Global Eagle 134 Canada 25,850,585 15,440,583 8,127,917 EMC 344 Spain 2,669,861 (65,460) 5,036,162 Global Eagle 340 Spain 18,318,164 4,987,582 5,690,778 EMC 220 Brazil 4,606,372 (362,443) 3,174,637 Global Eagle 530 Hong Kong 15,131,413 4,200,425 4,551,238 EMC 230 Brazil 964,634 (372,255) 3,946,487 Global Eagle 330 Netherlands 17,507,414 3,624,632 4,927,503 EMC 754 Kenya 1,069,320 (456,382) 1,762,918 Global Eagle 752 UAE 3,302,307 2,002,514 2,820,542 EMC 446 Norway 5,502,652 (854,407) 2,573,054 Global Eagle 440 Sweden 6,355,957 1,744,552 7,190,967 EMC 442 Germany 821,810 (2,051,503) 30,074,066 Global Eagle 544 India 5,196,559 1,673,546 35,206,903 EMC 444 UK 0 (2,108,725) 388,407 Global Eagle 542 India 4,853,997 1,664,377 2,717,408 EMC 757 UAE 0 (2,640,283) 508,710 Global Eagle 610 New Zealand 7,061,614 1,388,577 1,622,843 EMC 210 Argentina 15,454 (3,141,870) 455,813 Global Eagle 456 UK 98,617,102 740,339 26,843,732 EMC Foreign Subsidiaries 15,650,103 (12,053,328) 47,920,253 Global Eagle 750 UAE 14,426,378 582,540 2,476,221 Global Eagle 520 China 1,563,661 329,050 689,998 Global Eagle 426 UK - (25,488) - Global Eagle 430 UK - (25,488) - Global Eagle 310 Luxembourg - (27,605) 1,784 Global Eagle 132 Canada 3,094,358 (37,146) 3,118,194 Total Foreign Subsidiaries Global Eagle 312 Luxembourg - (43,759) 72,342,773 Global Eagle Foreign Subsidiaries 223,176,833 35,726,926 179,543,312 Global Eagle 326 Germany - (93,838) 29,102 EMC Foreign Subsidiaries 15,650,103 (12,053,328) 47,920,253 Global Eagle 314 Germany - (157,931) 40,579 Total Foreign Subsidiaries 238,826,936 23,673,599 227,463,565 Global Eagle 328 Germany - (182,411) 28,612 Global Eagle 510 Singapore 1,679,227 (1,016,799) 233,140 Global Eagle 316 Germany 218,098 (1,041,324) 883,077 Note: EMC foreign subsidiary EBITDA is not an indication of worldwide Maritime, Global Eagle Foreign Subsidiaries 223,176,833 35,726,926 179,543,312 Enterprise and Government (MEG) EBITDA, as substantial operations reside in US Aviation Connectivity $ 7,919,618 $ 2,073,602 $ 7,880,965 Aviation Content $ 215,257,215 $ 33,653,325 $ 171,662,347 Global Eagle Foreign Subsidiaries $ 223,176,833 $ 35,726,926 $ 179,543,312 26
Currency Limited impact from currency • More than 95% of the Global Eagle’s revenues is invoiced in USD • Similarly, more than 95% of the Company’s cost – cost of sales (largely satellite and content vendors) and operating expenses – is USD denominated • People cost in foreign subsidiaries is denominated in local currency 27Currency Limited impact from currency • More than 95% of the Global Eagle’s revenues is invoiced in USD • Similarly, more than 95% of the Company’s cost – cost of sales (largely satellite and content vendors) and operating expenses – is USD denominated • People cost in foreign subsidiaries is denominated in local currency 27
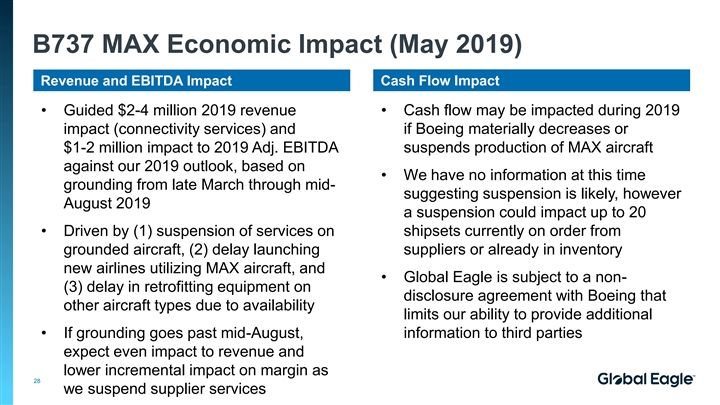
B737 MAX Economic Impact (May 2019) Revenue and EBITDA Impact Cash Flow Impact • Guided $2-4 million 2019 revenue • Cash flow may be impacted during 2019 impact (connectivity services) and if Boeing materially decreases or $1-2 million impact to 2019 Adj. EBITDA suspends production of MAX aircraft against our 2019 outlook, based on • We have no information at this time grounding from late March through mid- suggesting suspension is likely, however August 2019 a suspension could impact up to 20 • Driven by (1) suspension of services on shipsets currently on order from grounded aircraft, (2) delay launching suppliers or already in inventory new airlines utilizing MAX aircraft, and • Global Eagle is subject to a non- (3) delay in retrofitting equipment on disclosure agreement with Boeing that other aircraft types due to availability limits our ability to provide additional • If grounding goes past mid-August, information to third parties expect even impact to revenue and lower incremental impact on margin as 28 we suspend supplier servicesB737 MAX Economic Impact (May 2019) Revenue and EBITDA Impact Cash Flow Impact • Guided $2-4 million 2019 revenue • Cash flow may be impacted during 2019 impact (connectivity services) and if Boeing materially decreases or $1-2 million impact to 2019 Adj. EBITDA suspends production of MAX aircraft against our 2019 outlook, based on • We have no information at this time grounding from late March through mid- suggesting suspension is likely, however August 2019 a suspension could impact up to 20 • Driven by (1) suspension of services on shipsets currently on order from grounded aircraft, (2) delay launching suppliers or already in inventory new airlines utilizing MAX aircraft, and • Global Eagle is subject to a non- (3) delay in retrofitting equipment on disclosure agreement with Boeing that other aircraft types due to availability limits our ability to provide additional • If grounding goes past mid-August, information to third parties expect even impact to revenue and lower incremental impact on margin as 28 we suspend supplier services
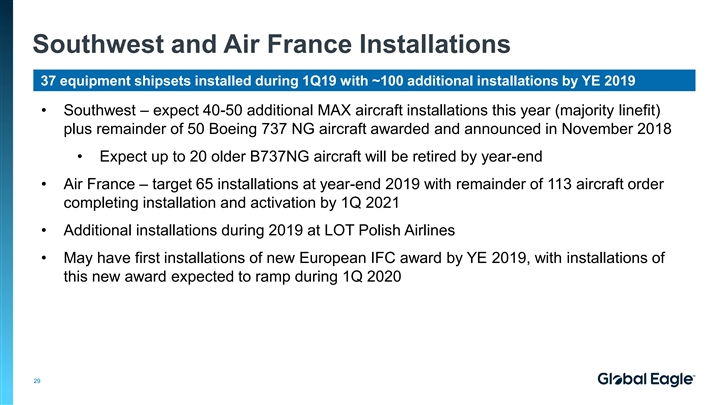
Southwest and Air France Installations 37 equipment shipsets installed during 1Q19 with ~100 additional installations by YE 2019 • Southwest – expect 40-50 additional MAX aircraft installations this year (majority linefit) plus remainder of 50 Boeing 737 NG aircraft awarded and announced in November 2018 • Expect up to 20 older B737NG aircraft will be retired by year-end • Air France – target 65 installations at year-end 2019 with remainder of 113 aircraft order completing installation and activation by 1Q 2021 • Additional installations during 2019 at LOT Polish Airlines • May have first installations of new European IFC award by YE 2019, with installations of this new award expected to ramp during 1Q 2020 29Southwest and Air France Installations 37 equipment shipsets installed during 1Q19 with ~100 additional installations by YE 2019 • Southwest – expect 40-50 additional MAX aircraft installations this year (majority linefit) plus remainder of 50 Boeing 737 NG aircraft awarded and announced in November 2018 • Expect up to 20 older B737NG aircraft will be retired by year-end • Air France – target 65 installations at year-end 2019 with remainder of 113 aircraft order completing installation and activation by 1Q 2021 • Additional installations during 2019 at LOT Polish Airlines • May have first installations of new European IFC award by YE 2019, with installations of this new award expected to ramp during 1Q 2020 29
Aircraft Installation versus Activation • In general, the timing gap between installation and activation is very short (within a month) • Delays may occur on the airlines’ side for example due to fleet planning, staff availability, testing, etc. • In general, the Company starts recognizing equipment revenue upon installation and once a plane is activated recurring connectivity revenue can be recognized 30Aircraft Installation versus Activation • In general, the timing gap between installation and activation is very short (within a month) • Delays may occur on the airlines’ side for example due to fleet planning, staff availability, testing, etc. • In general, the Company starts recognizing equipment revenue upon installation and once a plane is activated recurring connectivity revenue can be recognized 30
Capital Expenditures Capex expected to decline 40-45% during 2019 • Guidance for 2019 capital expenditures of $24 million, of which $8 million is related to 1 MEG, $8 million to Aviation Connectivity and Content , and $8 million to Corporate • Aviation Connectivity capex is related to (1) upgrades to Jupiter HT technology now active in our European network; (2) build-out of incremental coverage areas to extend our Jupiter HT network, particularly in EMEA • Our base capex forecast does not contemplate upgrading our North American network at this time to HT. If we proceed with this program, we will seek financial participation from our major customers • There is significant overlap in coverage area requirements between our current European customers and our new European IFC award. Should this new IFC award operate to a region where we do not currently have coverage, then we will need to invest in network hub equipment to extend coverage. We can then utilize these hubs for all aircraft operating on that modem platform (e.g. Jupiter HT) 31 1) Majority of capital expenditures represent investment in transponder capacity and internally developed software Capital Expenditures Capex expected to decline 40-45% during 2019 • Guidance for 2019 capital expenditures of $24 million, of which $8 million is related to 1 MEG, $8 million to Aviation Connectivity and Content , and $8 million to Corporate • Aviation Connectivity capex is related to (1) upgrades to Jupiter HT technology now active in our European network; (2) build-out of incremental coverage areas to extend our Jupiter HT network, particularly in EMEA • Our base capex forecast does not contemplate upgrading our North American network at this time to HT. If we proceed with this program, we will seek financial participation from our major customers • There is significant overlap in coverage area requirements between our current European customers and our new European IFC award. Should this new IFC award operate to a region where we do not currently have coverage, then we will need to invest in network hub equipment to extend coverage. We can then utilize these hubs for all aircraft operating on that modem platform (e.g. Jupiter HT) 31 1) Majority of capital expenditures represent investment in transponder capacity and internally developed software
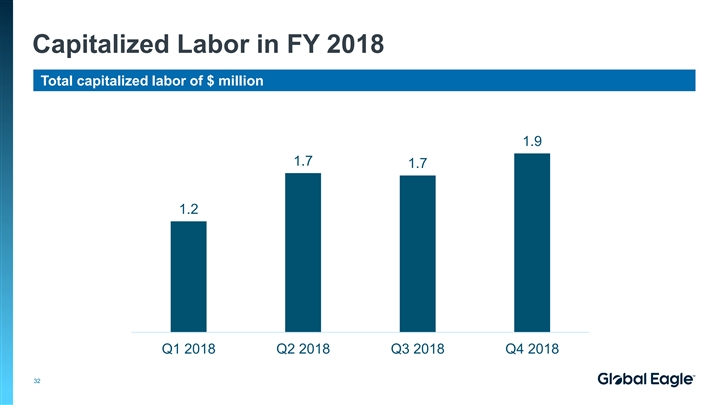
Capitalized Labor in FY 2018 Total capitalized labor of $ million 1.9 1.7 1.7 1.2 Q1 2018 Q2 2018 Q3 2018 Q4 2018 32Capitalized Labor in FY 2018 Total capitalized labor of $ million 1.9 1.7 1.7 1.2 Q1 2018 Q2 2018 Q3 2018 Q4 2018 32
Bandwidth Spending Significant opportunities to reduce bandwidth unit cost as current contracts expire • Current bandwidth spend for MEG and Aviation supports current improved gross profit levels • 83% of bandwidth dollar spend related to MEG Connectivity will expire by YE 2020 • 58% of bandwidth dollar spend related to Aviation Connectivity will expire by YE 2020 • As bandwidth contracts expire, Global Eagle seeks to renew at market pricing • Global Eagle also benefits from proprietary network technologies that increase the efficiency of bandwidth utilization • Since 2016, our cost per megabit has declined more than 60% due to market pricing improvement and new technologies • Technologies are effective in both aviation and maritime connectivity, providing a competitive advantage against other service integrators 33Bandwidth Spending Significant opportunities to reduce bandwidth unit cost as current contracts expire • Current bandwidth spend for MEG and Aviation supports current improved gross profit levels • 83% of bandwidth dollar spend related to MEG Connectivity will expire by YE 2020 • 58% of bandwidth dollar spend related to Aviation Connectivity will expire by YE 2020 • As bandwidth contracts expire, Global Eagle seeks to renew at market pricing • Global Eagle also benefits from proprietary network technologies that increase the efficiency of bandwidth utilization • Since 2016, our cost per megabit has declined more than 60% due to market pricing improvement and new technologies • Technologies are effective in both aviation and maritime connectivity, providing a competitive advantage against other service integrators 33
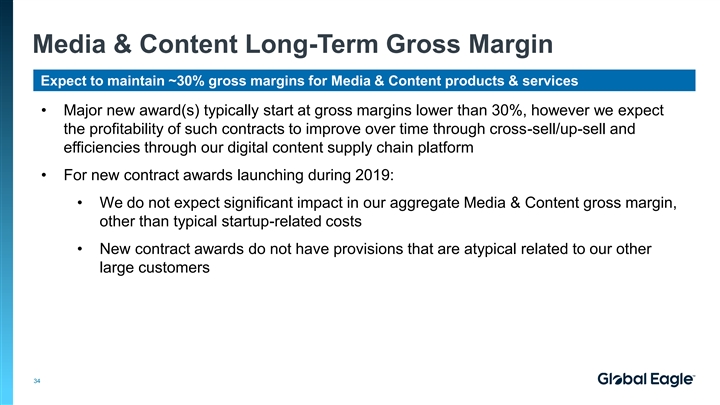
Media & Content Long-Term Gross Margin Expect to maintain ~30% gross margins for Media & Content products & services • Major new award(s) typically start at gross margins lower than 30%, however we expect the profitability of such contracts to improve over time through cross-sell/up-sell and efficiencies through our digital content supply chain platform • For new contract awards launching during 2019: • We do not expect significant impact in our aggregate Media & Content gross margin, other than typical startup-related costs • New contract awards do not have provisions that are atypical related to our other large customers 34Media & Content Long-Term Gross Margin Expect to maintain ~30% gross margins for Media & Content products & services • Major new award(s) typically start at gross margins lower than 30%, however we expect the profitability of such contracts to improve over time through cross-sell/up-sell and efficiencies through our digital content supply chain platform • For new contract awards launching during 2019: • We do not expect significant impact in our aggregate Media & Content gross margin, other than typical startup-related costs • New contract awards do not have provisions that are atypical related to our other large customers 34
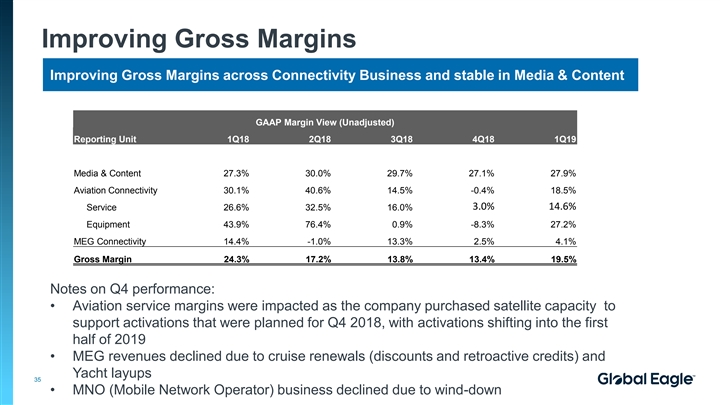
Improving Gross Margins Improving Gross Margins across Connectivity Business and stable in Media & Content GAAP Margin View (Unadjusted) Reporting Unit 1Q18 2Q18 3Q18 4Q18 1Q19 Media & Content 27.3% 30.0% 29.7% 27.1% 27.9% Aviation Connectivity 30.1% 40.6% 14.5% -0.4% 18.5% 3.0% 14.6% Service 26.6% 32.5% 16.0% Equipment 43.9% 76.4% 0.9% -8.3% 27.2% MEG Connectivity 14.4% -1.0% 13.3% 2.5% 4.1% Gross Margin 24.3% 17.2% 13.8% 13.4% 19.5% Notes on Q4 performance: • Aviation service margins were impacted as the company purchased satellite capacity to support activations that were planned for Q4 2018, with activations shifting into the first half of 2019 • MEG revenues declined due to cruise renewals (discounts and retroactive credits) and Yacht layups 35 • MNO (Mobile Network Operator) business declined due to wind-downImproving Gross Margins Improving Gross Margins across Connectivity Business and stable in Media & Content GAAP Margin View (Unadjusted) Reporting Unit 1Q18 2Q18 3Q18 4Q18 1Q19 Media & Content 27.3% 30.0% 29.7% 27.1% 27.9% Aviation Connectivity 30.1% 40.6% 14.5% -0.4% 18.5% 3.0% 14.6% Service 26.6% 32.5% 16.0% Equipment 43.9% 76.4% 0.9% -8.3% 27.2% MEG Connectivity 14.4% -1.0% 13.3% 2.5% 4.1% Gross Margin 24.3% 17.2% 13.8% 13.4% 19.5% Notes on Q4 performance: • Aviation service margins were impacted as the company purchased satellite capacity to support activations that were planned for Q4 2018, with activations shifting into the first half of 2019 • MEG revenues declined due to cruise renewals (discounts and retroactive credits) and Yacht layups 35 • MNO (Mobile Network Operator) business declined due to wind-down
Considerations when assessing Strategic Divestitures • As we analyze potential divestitures we assess the strategic focus of the remaining assets of the Company and financial implications post-sale • A divestiture should lead to decreased complexity as the Company reduces the number of legal entities and should achieve lower operating expenses Areas of potential reduction of complexity are: entity structure, tax structure, IT infrastructure and applications, simplification of back-office functions • Finally, we would expect any divestitures to provide de-leveraging and liquidity benefits to the Company 36Considerations when assessing Strategic Divestitures • As we analyze potential divestitures we assess the strategic focus of the remaining assets of the Company and financial implications post-sale • A divestiture should lead to decreased complexity as the Company reduces the number of legal entities and should achieve lower operating expenses Areas of potential reduction of complexity are: entity structure, tax structure, IT infrastructure and applications, simplification of back-office functions • Finally, we would expect any divestitures to provide de-leveraging and liquidity benefits to the Company 36
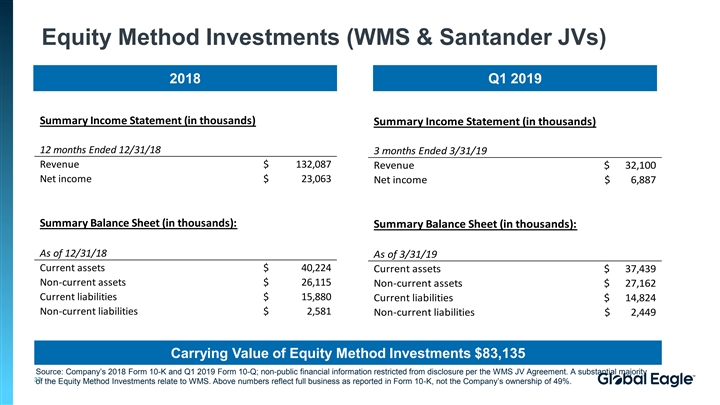
Equity Method Investments (WMS & Santander JVs) 2018 Q1 2019 Summary Income Statement (in thousands) Summary Income Statement (in thousands) 12 months Ended 12/31/18 3 months Ended 3/31/19 Revenue $ 132,087 Revenue $ 3 2,100 Net income $ 23,063 Net income $ 6 ,887 Summary Balance Sheet (in thousands): Summary Balance Sheet (in thousands): As of 12/31/18 As of 3/31/19 Current assets $ 40,224 Current assets $ 37,439 Non-current assets $ 26,115 Non-current assets $ 2 7,162 Current liabilities $ 15,880 Current liabilities $ 1 4,824 Non-current liabilities $ 2,581 Non-current liabilities $ 2,449 Carrying Value of Equity Method Investments $83,135 Source: Company’s 2018 Form 10-K and Q1 2019 Form 10-Q; non-public financial information restricted from disclosure per the WMS JV Agreement. A substantial majority 37 of the Equity Method Investments relate to WMS. Above numbers reflect full business as reported in Form 10-K, not the Company’s ownership of 49%.Equity Method Investments (WMS & Santander JVs) 2018 Q1 2019 Summary Income Statement (in thousands) Summary Income Statement (in thousands) 12 months Ended 12/31/18 3 months Ended 3/31/19 Revenue $ 132,087 Revenue $ 3 2,100 Net income $ 23,063 Net income $ 6 ,887 Summary Balance Sheet (in thousands): Summary Balance Sheet (in thousands): As of 12/31/18 As of 3/31/19 Current assets $ 40,224 Current assets $ 37,439 Non-current assets $ 26,115 Non-current assets $ 2 7,162 Current liabilities $ 15,880 Current liabilities $ 1 4,824 Non-current liabilities $ 2,581 Non-current liabilities $ 2,449 Carrying Value of Equity Method Investments $83,135 Source: Company’s 2018 Form 10-K and Q1 2019 Form 10-Q; non-public financial information restricted from disclosure per the WMS JV Agreement. A substantial majority 37 of the Equity Method Investments relate to WMS. Above numbers reflect full business as reported in Form 10-K, not the Company’s ownership of 49%.
Appendix 3 – Adjusted EBITDA Definition First Lien Presentation (MNPI)Appendix 3 – Adjusted EBITDA Definition First Lien Presentation (MNPI)
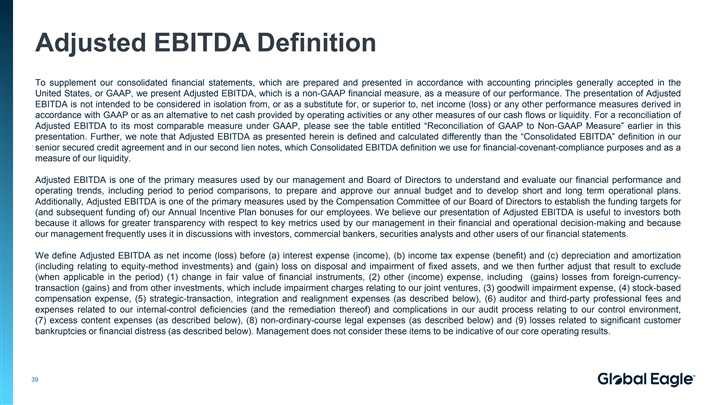
Adjusted EBITDA Definition To supplement our consolidated financial statements, which are prepared and presented in accordance with accounting principles generally accepted in the United States, or GAAP, we present Adjusted EBITDA, which is a non-GAAP financial measure, as a measure of our performance. The presentation of Adjusted EBITDA is not intended to be considered in isolation from, or as a substitute for, or superior to, net income (loss) or any other performance measures derived in accordance with GAAP or as an alternative to net cash provided by operating activities or any other measures of our cash flows or liquidity. For a reconciliation of Adjusted EBITDA to its most comparable measure under GAAP, please see the table entitled “Reconciliation of GAAP to Non-GAAP Measure” earlier in this presentation. Further, we note that Adjusted EBITDA as presented herein is defined and calculated differently than the “Consolidated EBITDA” definition in our senior secured credit agreement and in our second lien notes, which Consolidated EBITDA definition we use for financial-covenant-compliance purposes and as a measure of our liquidity. Adjusted EBITDA is one of the primary measures used by our management and Board of Directors to understand and evaluate our financial performance and operating trends, including period to period comparisons, to prepare and approve our annual budget and to develop short and long term operational plans. Additionally, Adjusted EBITDA is one of the primary measures used by the Compensation Committee of our Board of Directors to establish the funding targets for (and subsequent funding of) our Annual Incentive Plan bonuses for our employees. We believe our presentation of Adjusted EBITDA is useful to investors both because it allows for greater transparency with respect to key metrics used by our management in their financial and operational decision-making and because our management frequently uses it in discussions with investors, commercial bankers, securities analysts and other users of our financial statements. We define Adjusted EBITDA as net income (loss) before (a) interest expense (income), (b) income tax expense (benefit) and (c) depreciation and amortization (including relating to equity-method investments) and (gain) loss on disposal and impairment of fixed assets, and we then further adjust that result to exclude (when applicable in the period) (1) change in fair value of financial instruments, (2) other (income) expense, including (gains) losses from foreign-currency- transaction (gains) and from other investments, which include impairment charges relating to our joint ventures, (3) goodwill impairment expense, (4) stock-based compensation expense, (5) strategic-transaction, integration and realignment expenses (as described below), (6) auditor and third-party professional fees and expenses related to our internal-control deficiencies (and the remediation thereof) and complications in our audit process relating to our control environment, (7) excess content expenses (as described below), (8) non-ordinary-course legal expenses (as described below) and (9) losses related to significant customer bankruptcies or financial distress (as described below). Management does not consider these items to be indicative of our core operating results. 39Adjusted EBITDA Definition To supplement our consolidated financial statements, which are prepared and presented in accordance with accounting principles generally accepted in the United States, or GAAP, we present Adjusted EBITDA, which is a non-GAAP financial measure, as a measure of our performance. The presentation of Adjusted EBITDA is not intended to be considered in isolation from, or as a substitute for, or superior to, net income (loss) or any other performance measures derived in accordance with GAAP or as an alternative to net cash provided by operating activities or any other measures of our cash flows or liquidity. For a reconciliation of Adjusted EBITDA to its most comparable measure under GAAP, please see the table entitled “Reconciliation of GAAP to Non-GAAP Measure” earlier in this presentation. Further, we note that Adjusted EBITDA as presented herein is defined and calculated differently than the “Consolidated EBITDA” definition in our senior secured credit agreement and in our second lien notes, which Consolidated EBITDA definition we use for financial-covenant-compliance purposes and as a measure of our liquidity. Adjusted EBITDA is one of the primary measures used by our management and Board of Directors to understand and evaluate our financial performance and operating trends, including period to period comparisons, to prepare and approve our annual budget and to develop short and long term operational plans. Additionally, Adjusted EBITDA is one of the primary measures used by the Compensation Committee of our Board of Directors to establish the funding targets for (and subsequent funding of) our Annual Incentive Plan bonuses for our employees. We believe our presentation of Adjusted EBITDA is useful to investors both because it allows for greater transparency with respect to key metrics used by our management in their financial and operational decision-making and because our management frequently uses it in discussions with investors, commercial bankers, securities analysts and other users of our financial statements. We define Adjusted EBITDA as net income (loss) before (a) interest expense (income), (b) income tax expense (benefit) and (c) depreciation and amortization (including relating to equity-method investments) and (gain) loss on disposal and impairment of fixed assets, and we then further adjust that result to exclude (when applicable in the period) (1) change in fair value of financial instruments, (2) other (income) expense, including (gains) losses from foreign-currency- transaction (gains) and from other investments, which include impairment charges relating to our joint ventures, (3) goodwill impairment expense, (4) stock-based compensation expense, (5) strategic-transaction, integration and realignment expenses (as described below), (6) auditor and third-party professional fees and expenses related to our internal-control deficiencies (and the remediation thereof) and complications in our audit process relating to our control environment, (7) excess content expenses (as described below), (8) non-ordinary-course legal expenses (as described below) and (9) losses related to significant customer bankruptcies or financial distress (as described below). Management does not consider these items to be indicative of our core operating results. 39
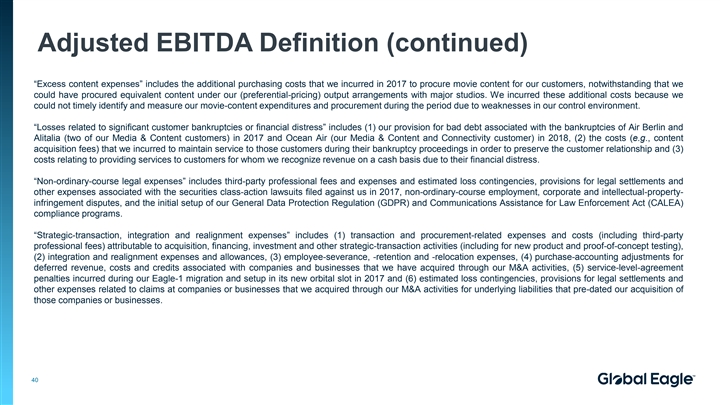
Adjusted EBITDA Definition (continued) “Excess content expenses” includes the additional purchasing costs that we incurred in 2017 to procure movie content for our customers, notwithstanding that we could have procured equivalent content under our (preferential-pricing) output arrangements with major studios. We incurred these additional costs because we could not timely identify and measure our movie-content expenditures and procurement during the period due to weaknesses in our control environment. “Losses related to significant customer bankruptcies or financial distress” includes (1) our provision for bad debt associated with the bankruptcies of Air Berlin and Alitalia (two of our Media & Content customers) in 2017 and Ocean Air (our Media & Content and Connectivity customer) in 2018, (2) the costs (e.g., content acquisition fees) that we incurred to maintain service to those customers during their bankruptcy proceedings in order to preserve the customer relationship and (3) costs relating to providing services to customers for whom we recognize revenue on a cash basis due to their financial distress. “Non-ordinary-course legal expenses” includes third-party professional fees and expenses and estimated loss contingencies, provisions for legal settlements and other expenses associated with the securities class-action lawsuits filed against us in 2017, non-ordinary-course employment, corporate and intellectual-property- infringement disputes, and the initial setup of our General Data Protection Regulation (GDPR) and Communications Assistance for Law Enforcement Act (CALEA) compliance programs. “Strategic-transaction, integration and realignment expenses” includes (1) transaction and procurement-related expenses and costs (including third-party professional fees) attributable to acquisition, financing, investment and other strategic-transaction activities (including for new product and proof-of-concept testing), (2) integration and realignment expenses and allowances, (3) employee-severance, -retention and -relocation expenses, (4) purchase-accounting adjustments for deferred revenue, costs and credits associated with companies and businesses that we have acquired through our M&A activities, (5) service-level-agreement penalties incurred during our Eagle-1 migration and setup in its new orbital slot in 2017 and (6) estimated loss contingencies, provisions for legal settlements and other expenses related to claims at companies or businesses that we acquired through our M&A activities for underlying liabilities that pre-dated our acquisition of those companies or businesses. 40Adjusted EBITDA Definition (continued) “Excess content expenses” includes the additional purchasing costs that we incurred in 2017 to procure movie content for our customers, notwithstanding that we could have procured equivalent content under our (preferential-pricing) output arrangements with major studios. We incurred these additional costs because we could not timely identify and measure our movie-content expenditures and procurement during the period due to weaknesses in our control environment. “Losses related to significant customer bankruptcies or financial distress” includes (1) our provision for bad debt associated with the bankruptcies of Air Berlin and Alitalia (two of our Media & Content customers) in 2017 and Ocean Air (our Media & Content and Connectivity customer) in 2018, (2) the costs (e.g., content acquisition fees) that we incurred to maintain service to those customers during their bankruptcy proceedings in order to preserve the customer relationship and (3) costs relating to providing services to customers for whom we recognize revenue on a cash basis due to their financial distress. “Non-ordinary-course legal expenses” includes third-party professional fees and expenses and estimated loss contingencies, provisions for legal settlements and other expenses associated with the securities class-action lawsuits filed against us in 2017, non-ordinary-course employment, corporate and intellectual-property- infringement disputes, and the initial setup of our General Data Protection Regulation (GDPR) and Communications Assistance for Law Enforcement Act (CALEA) compliance programs. “Strategic-transaction, integration and realignment expenses” includes (1) transaction and procurement-related expenses and costs (including third-party professional fees) attributable to acquisition, financing, investment and other strategic-transaction activities (including for new product and proof-of-concept testing), (2) integration and realignment expenses and allowances, (3) employee-severance, -retention and -relocation expenses, (4) purchase-accounting adjustments for deferred revenue, costs and credits associated with companies and businesses that we have acquired through our M&A activities, (5) service-level-agreement penalties incurred during our Eagle-1 migration and setup in its new orbital slot in 2017 and (6) estimated loss contingencies, provisions for legal settlements and other expenses related to claims at companies or businesses that we acquired through our M&A activities for underlying liabilities that pre-dated our acquisition of those companies or businesses. 40
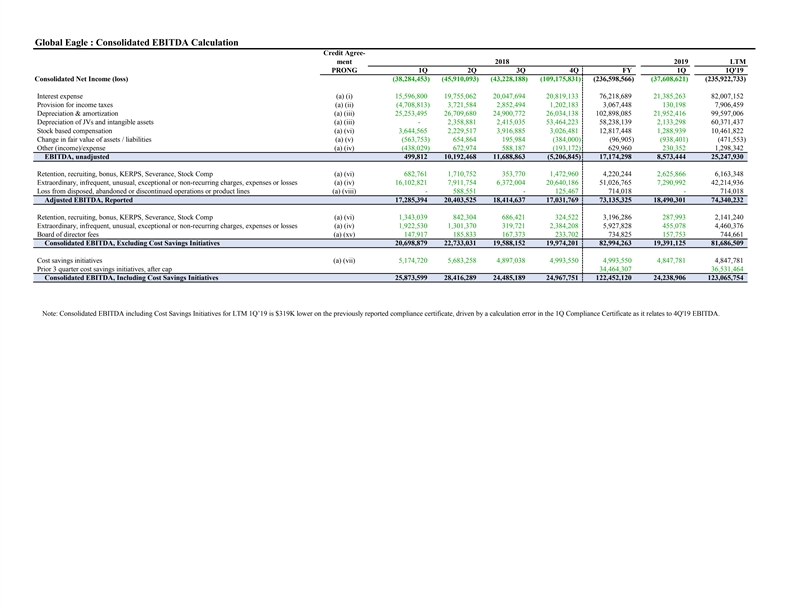
Global Eagle : Consolidated EBITDA Calculation Credit Agree- ment 2018 2019 LTM PRONG 1Q 2Q 3Q 4Q FY 1Q 1Q'19 Consolidated Net Income (loss) net income (38,284,453) (45,910,093) (43,228,188) ( 109,175,831) ( 236,598,566) (37,608,621) ( 235,922,733) Interest expense (a) (i) 1 5,596,800 1 9,755,062 2 0,047,694 20,819,133 76,218,689 2 1,385,263 82,007,152 Provision for income taxes (a) (ii) (4,708,813) 3 ,721,584 2 ,852,494 1,202,183 3,067,448 1 30,198 7,906,459 Depreciation & amortization (a) (iii) 2 5,253,495 2 6,709,680 2 4,900,772 26,034,138 102,898,085 2 1,952,416 99,597,006 Depreciation of JVs and intangible assets (a) (iii) - 2 ,358,881 2 ,415,035 53,464,223 58,238,139 2 ,133,298 60,371,437 Stock based compensation (a) (vi) 3 ,644,565 2 ,229,517 3 ,916,885 3,026,481 12,817,448 1 ,288,939 10,461,822 Change in fair value of assets / liabilities (a) (v) (563,753) 6 54,864 1 95,984 ( 384,000) ( 96,905) (938,401) ( 471,553) Other (income)/expense (a) (iv) (438,029) 6 72,974 5 88,187 ( 193,172) 629,960 2 30,352 1,298,342 EBITDA, unadjusted 4 99,812 1 0,192,468 1 1,688,863 ( 5,206,845) 17,174,298 8 ,573,444 25,247,930 Retention, recruiting, bonus, KERPS, Severance, Stock Comp (a) (vi) 682,761 1,710,752 353,770 1,472,960 4,220,244 2,625,866 6,163,348 Extraordinary, infrequent, unusual, exceptional or non-recurring charges, expenses or losses (a) (iv) 16,102,821 7,911,754 6,372,004 20,640,186 51,026,765 7,290,992 42,214,936 Loss from disposed, abandoned or discontinued operations or product lines (a) (viii) - 588,551 - 125,467 714,018 - 714,018 Adjusted EBITDA, Reported 17,285,394 2 0,403,525 1 8,414,637 17,031,769 73,135,325 1 8,490,301 74,340,232 Retention, recruiting, bonus, KERPS, Severance, Stock Comp (a) (vi) 1,343,039 842,304 686,421 324,522 3,196,286 287,993 2,141,240 Extraordinary, infrequent, unusual, exceptional or non-recurring charges, expenses or losses (a) (iv) 1,922,530 1,301,370 319,721 2,384,208 5,927,828 455,078 4,460,376 Board of director fees (a) (xv) 147,917 185,833 167,373 233,702 734,825 157,753 744,661 Consolidated EBITDA, Excluding Cost Savings Initiatives 2 0,698,879 2 2,733,031 1 9,588,152 19,974,201 82,994,263 1 9,391,125 81,686,509 Cost savings initiatives (a) (vii) 5,174,720 5 ,683,258 4 ,897,038 4,993,550 4,993,550 4 ,847,781 4,847,781 Prior 3 quarter cost savings initiatives, after cap 34,464,307 36,531,464 Consolidated EBITDA, Including Cost Savings Initiatives 25,873,599 2 8,416,289 2 4,485,189 24,967,751 122,452,120 2 4,238,906 123,065,754 Note: Consolidated EBITDA including Cost Savings Initiatives for LTM 1Q’19 is $319K lower on the previously reported compliance certificate, driven by a calculation error in the 1Q Compliance Certificate as it relates to 4Q'19 EBITDA. Global Eagle : Consolidated EBITDA Calculation Credit Agree- ment 2018 2019 LTM PRONG 1Q 2Q 3Q 4Q FY 1Q 1Q'19 Consolidated Net Income (loss) net income (38,284,453) (45,910,093) (43,228,188) ( 109,175,831) ( 236,598,566) (37,608,621) ( 235,922,733) Interest expense (a) (i) 1 5,596,800 1 9,755,062 2 0,047,694 20,819,133 76,218,689 2 1,385,263 82,007,152 Provision for income taxes (a) (ii) (4,708,813) 3 ,721,584 2 ,852,494 1,202,183 3,067,448 1 30,198 7,906,459 Depreciation & amortization (a) (iii) 2 5,253,495 2 6,709,680 2 4,900,772 26,034,138 102,898,085 2 1,952,416 99,597,006 Depreciation of JVs and intangible assets (a) (iii) - 2 ,358,881 2 ,415,035 53,464,223 58,238,139 2 ,133,298 60,371,437 Stock based compensation (a) (vi) 3 ,644,565 2 ,229,517 3 ,916,885 3,026,481 12,817,448 1 ,288,939 10,461,822 Change in fair value of assets / liabilities (a) (v) (563,753) 6 54,864 1 95,984 ( 384,000) ( 96,905) (938,401) ( 471,553) Other (income)/expense (a) (iv) (438,029) 6 72,974 5 88,187 ( 193,172) 629,960 2 30,352 1,298,342 EBITDA, unadjusted 4 99,812 1 0,192,468 1 1,688,863 ( 5,206,845) 17,174,298 8 ,573,444 25,247,930 Retention, recruiting, bonus, KERPS, Severance, Stock Comp (a) (vi) 682,761 1,710,752 353,770 1,472,960 4,220,244 2,625,866 6,163,348 Extraordinary, infrequent, unusual, exceptional or non-recurring charges, expenses or losses (a) (iv) 16,102,821 7,911,754 6,372,004 20,640,186 51,026,765 7,290,992 42,214,936 Loss from disposed, abandoned or discontinued operations or product lines (a) (viii) - 588,551 - 125,467 714,018 - 714,018 Adjusted EBITDA, Reported 17,285,394 2 0,403,525 1 8,414,637 17,031,769 73,135,325 1 8,490,301 74,340,232 Retention, recruiting, bonus, KERPS, Severance, Stock Comp (a) (vi) 1,343,039 842,304 686,421 324,522 3,196,286 287,993 2,141,240 Extraordinary, infrequent, unusual, exceptional or non-recurring charges, expenses or losses (a) (iv) 1,922,530 1,301,370 319,721 2,384,208 5,927,828 455,078 4,460,376 Board of director fees (a) (xv) 147,917 185,833 167,373 233,702 734,825 157,753 744,661 Consolidated EBITDA, Excluding Cost Savings Initiatives 2 0,698,879 2 2,733,031 1 9,588,152 19,974,201 82,994,263 1 9,391,125 81,686,509 Cost savings initiatives (a) (vii) 5,174,720 5 ,683,258 4 ,897,038 4,993,550 4,993,550 4 ,847,781 4,847,781 Prior 3 quarter cost savings initiatives, after cap 34,464,307 36,531,464 Consolidated EBITDA, Including Cost Savings Initiatives 25,873,599 2 8,416,289 2 4,485,189 24,967,751 122,452,120 2 4,238,906 123,065,754 Note: Consolidated EBITDA including Cost Savings Initiatives for LTM 1Q’19 is $319K lower on the previously reported compliance certificate, driven by a calculation error in the 1Q Compliance Certificate as it relates to 4Q'19 EBITDA.