
Exhibit 99.3
Q1 2016 Earnings & Transformative Acquisition of EMC May 9, 2016
Page 2 We make forward - looking statements in this presentation within the meaning of the Private Securities Litigation Reform Act of 1995 . These forward - looking statements relate to expectations or forecasts for future events, including, without limitation, the pending acquisition of Emerging Markets Communications (“EMC”) and the timing of the closing thereof, our ability to successfully integrate EMC and achieve synergies therefrom, the expected performance of the combined GEE - EMC business, EMC’s projected revenue and Adjusted EBITDA, our earnings, Adjusted EBITDA, revenues, expenses, capital expenditures, aircraft connectivity installations or other future financial or business performance or strategies, or the impact of legal or regulatory matters on our business, results of operations or financial condition . These statements may be preceded by, followed by or include the words “may,” “might,” “will,” “will likely result,” “should,” “estimate,” “plan,” “project,” “forecast,” “intend,” “expect,” “anticipate,” “believe,” “seek,” “continue,” “target” or similar expressions . These forward - looking statements are based on information available to us as of the date they were made, and involve a number of risks and uncertainties which may cause them to turn out to be wrong . Accordingly, forward - looking statements should not be relied upon as representing our views as of any subsequent date, and we do not undertake any obligation to update forward - looking statements to reflect events or circumstances after the date they were made, whether as a result of new information, future events or otherwise, except as may be required under applicable securities laws . As a result of a number of known and unknown risks and uncertainties, our actual results or performance may be materially different from those expressed or implied by these forward - looking statements . Some factors that could cause actual results to differ include : our ability to integrate our acquired businesses, the ability of the combined business to grow, including through acquisitions which we are able to successfully integrate, and the ability of our executive officers to manage growth profitably ; the ability of our customer Southwest Airlines to maintain a sponsor for its “TV Flies Free” offering and our ability to replicate this model through other sponsorship alliances ; the outcome of any legal proceedings pending or that may be instituted against us, our subsidiaries, or third parties to whom we owe indemnification obligations ; changes in laws or regulations that apply to us or our industry ; our ability to recognize and timely implement future technologies in the satellite connectivity space, including GSM and Ka - band system development and deployment ; our ability to capitalize on investments in developing our service offerings, including our long - term project with QEST to develop global antenna technologies ; significant product development expenses associated with our long - term line - fit initiatives ; our ability to deliver end - to - end network performance sufficient to meet increasing airline customer and passenger demand ; our ability to obtain regulatory approval on a timely basis for the use of our equipment on aircraft ; our ability to obtain and maintain international authorizations to operate our service over the airspace of foreign jurisdictions our customers utilize ; our ability to expand our service offerings and deliver on our service roadmap ; our ability to timely and cost - effectively identify and license television and media content that passengers will purchase ; a decrease in the media content onboard IFE systems and/or the discontinuance of the use of IFE systems indefinitely due to the emergence and increase in the use of hand - held personal devices by airline passengers ; general economic and technological circumstances in the satellite transponder market, including access to transponder space in capacity limited regions and successful launch of replacement transponder capacity where applicable ; our ability to obtain and maintain licenses for content used on legacy installed IFE systems ; the loss of, or failure to realize benefits from, agreements with our airline partners ; the loss of relationships with original equipment manufacturers or dealers ; unfavorable economic conditions in the airline industry and economy as a whole ; our ability to expand our domestic or international operations, including our ability to grow our business with current and potential future airline partners or successfully partner with satellite service providers, including Hughes Network Systems and SES ; our reliance on third - party satellite service providers and equipment and other suppliers, including single source providers and suppliers ; the effects of service interruptions or delays, technology failures, material defects or errors in our software, damage to our equipment or geopolitical restrictions ; the result of ongoing tax audit that could result in reduction of tax carryforwards ; the limited operating history of our connectivity and in - flight television and media products ; costs associated with defending pending or future intellectual property infringement actions and other litigation or claims ; increases in our projected capital expenditures due to, among other things, unexpected costs incurred in connection with the roll out of our technology roadmap or our international plan of expansion ; fluctuation in our operating results ; the demand for in - flight broadband Internet access services and market acceptance for our products and services ; our ability to generate sufficient cash flow to make payments on our indebtedness ; our incurrence of additional indebtedness in the future ; our ability to repay the convertible notes at maturing or to repurchase the convertible nets upon a fundamental chance or at specific repurchase dates ; the effect of the conditional conversion feature of the convertible notes ; our compliance with the covenants in our Credit Agreement ; our ability to obtain necessary regulatory approvals or to satisfy any of the other conditions to the EMC transaction on a timely basis or at all ; a delay in the expected closing date of the EMC transaction ; a failure to close the EMC transaction on the terms negotiated ; any delay or inability of the combined company to realize the expected benefits and synergies of the transaction ; our assumption of EMC’s outstanding indebtedness and the costs relating thereto ; our issuance of stock to consummate the EMC transaction and the dilution to our existing stockholders relating thereto ; the loss of management and other key employees ; substantial non - recurring transaction, regulatory and integration costs and/or unknown liabilities ; sales of our stock in the future by shareholders of EMC, which will hold a substantial portion of our outstanding securities, and the resulting effect on the price of our common stock ; the risk that disruptions from the proposed transaction will harm our or EMC’s business, including customer retention risk ; competitive responses to the proposed EMC transaction ; our ability to effectively protect EMC’s intellectual property rights ; the execution and compliance costs relating to new regulatory and compliance frameworks, new market risks and operations in new geographies ; and general economic and business conditions that affect the combined company following the transaction . A detailed discussion of risks related to GEE’s business is included in the section entitled “Risk Factors” and other risks and uncertainties set forth in our most recent Annual Report on Form 10 - K and subsequently filed reports on Form 10 - Q . SAFE HARBOR STATEMENT
Page 3 Call Participants Agenda Dave Davis Chief Executive Officer, GEE Mike Zemetra Chief Financial Officer, GEE Walé Adepoju Chief Commercial Officer, GEE Kevin Trosian SVP Corporate Development & IR, GEE Abel Avellan Founder & Chief Executive Officer, EMC 1. Q1 2016 earnings 2. Transaction snapshot 3. About GEE & EMC 4. Strategic rationale 5. Transaction details AGENDA AND PARTICIPANTS More information at: www.gee - emc.mobi
Page 4 FINANCIAL OVERVIEW • Solid financial results and business execution for Q1 2016 • Record 1Q16 revenue of $113.8 m illion ▪ Year - over - Year growth of 13.5% • 1Q16 Adjusted EBITDA * of $10.3 million ▪ Year - over - Year growth of 26.2% * See Appendix A and Appendix B for the definition of Adjusted EBITDA and a reconciliation to Net Income
Page 5 FINANCIAL OVERVIEW • Secured over 95% of Content revenue up for renewal in 2016 ▪ Won a major contract with one of the world’s best - known airlines ▪ Entered new 5 - year agreement with one of our top 5 customers • Commenced service on flydubai ▪ Fully integrated portfolio of products • Operations solutions growing well ▪ Won 9 new customers
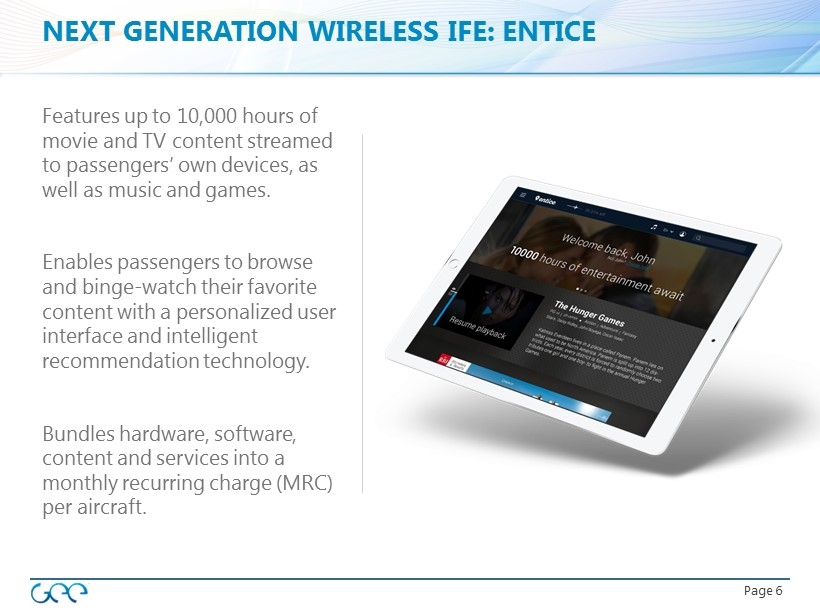
Page 6 NEXT GENERATION WIRELESS IFE : ENTICE Features up to 10,000 hours of movie and TV content streamed to passengers’ own devices, as well as music and games. Enables passengers to browse and binge - watch their favorite content with a personalized user interface and intelligent recommendation technology. Bundles hardware, software, content and services into a monthly recurring charge (MRC) per aircraft.
Page 7 GEE TO PROVIDE KA - BAND CONNECTIVITY SERVICES Airconnect Global Ku, Ku HTS, Ka maximizes flexibility Improved Customer Experience Open Architecture Provides Bandwidth Agnostic Solution Rapid Time to Market & Scalability
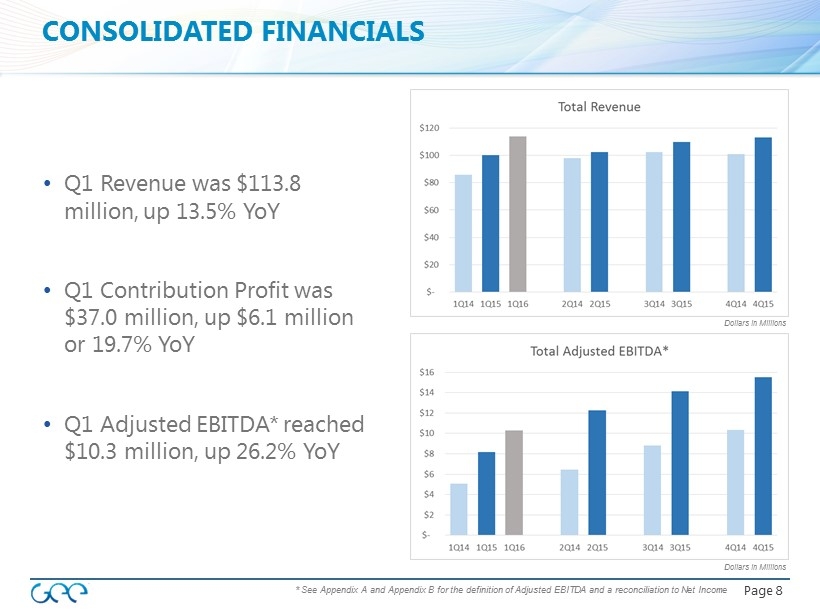
Page 8 CONSOLIDATED FINANCIALS • Q1 Revenue was $113.8 million, up 13.5% YoY • Q1 Contribution Profit was $37.0 million, up $6.1 million or 19.7% YoY • Q1 Adjusted EBITDA* reached $10.3 million, up 26.2% YoY * See Appendix A and Appendix B for the definition of Adjusted EBITDA and a reconciliation to Net Income Dollars in Millions Dollars in Millions
Page 9 FINANCIAL GUIDANCE** Guidance remains unchanged from original forecast • 2016 Full Year Revenue of $470 - $490 million • 2016 Full Year Adjusted EBITDA* of $57 - $65 million • 2016 Full Year CapEx range from $25 to $30 million • Installation backlog of approximately 200 aircraft to be installed over the next two years * See Appendix A and Appendix B for the definition of Adjusted EBITDA and a reconciliation to Net Income ** Financial guidance is as of May 3, 2015. The financial guidance by management was based on the economic environment as of such date. Actual results may differ materially. No reference (oral or written) to such guidance should be construed as an update, revision, confirmation or clarification of same.
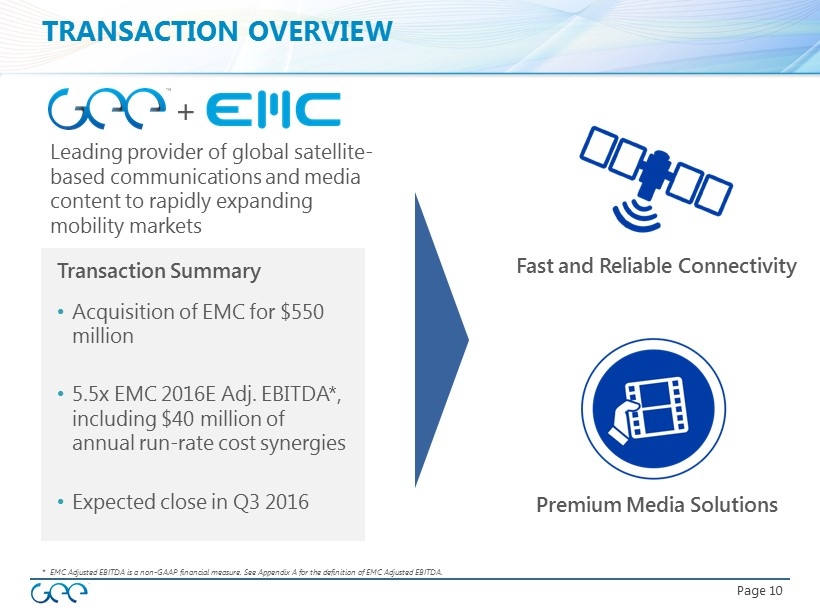
Page 10 Fast and Reliable Connectivity Premium Media Solutions TRANSACTION OVERVIEW Leading provider of global satellite - based communications and media content to rapidly expanding mobility markets Transaction Summary • Acquisition of EMC for $550 million • 5.5x EMC 2016E Adj . EBITDA*, including $40 million of annual run - rate cost synergies • Expected close in Q3 2016 + * EMC Adjusted EBITDA is a non - GAAP financial measure. See Appendix A for the definition of EMC Adjusted EBITDA.
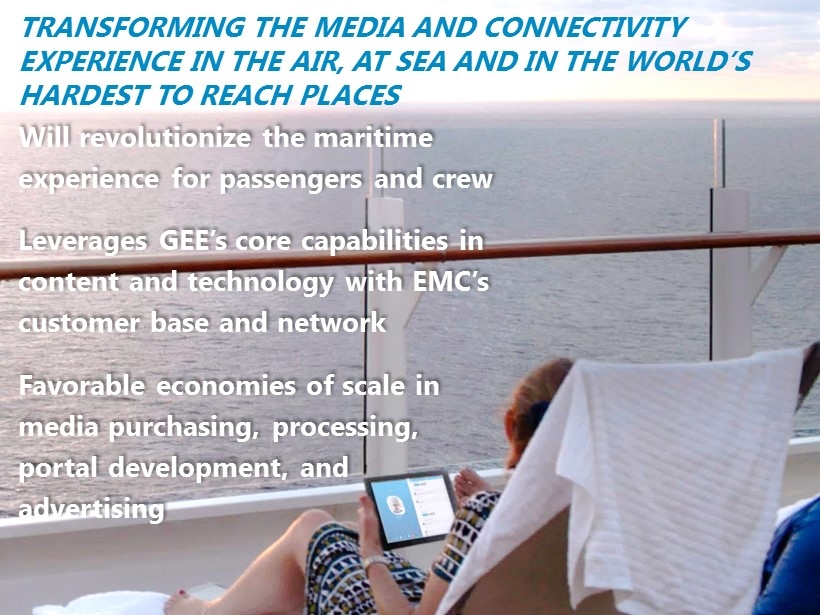
Page 11 TRANSFORMING THE MEDIA AND CONNECTIVITY EXPERIENCE IN THE AIR, AT SEA AND IN THE WORLD’S HARDEST TO REACH PLACES Will revolutionize the maritime experience for passengers and crew Leverages GEE’s core capabilities in content and technology with EMC’s customer base and network Favorable economies of scale in media purchasing, processing, portal development, and advertising
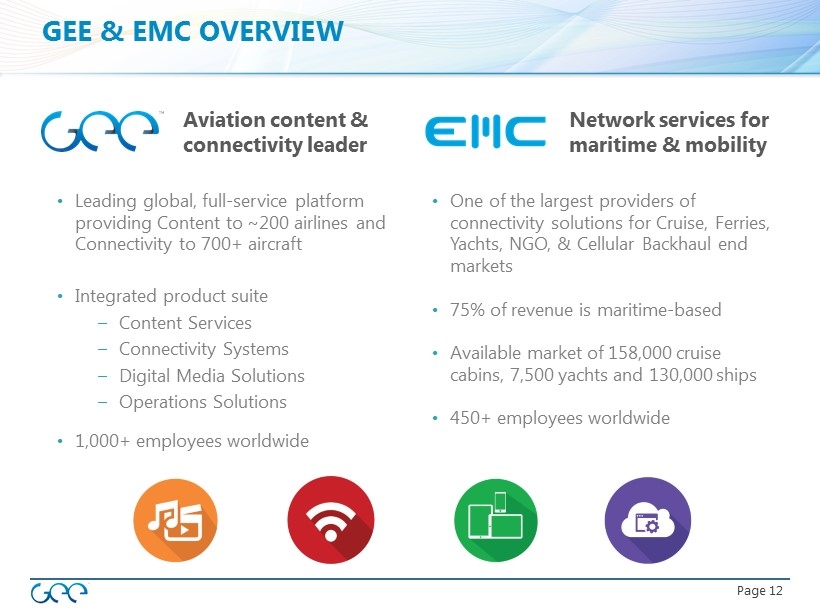
Page 12 • One of the largest providers of connectivity solutions for Cruise, Ferries, Yachts, NGO, & Cellular Backhaul end markets • 75% of revenue is maritime - based • Available market of 158,000 cruise cabins, 7,500 yachts and 130,000 ships • 450+ employees worldwide Aviation content & connectivity leader Network services for maritime & mobility • Leading global, full - service platform providing Content to ~200 airlines and Connectivity to 700+ aircraft • Integrated product suite – Content Services – Connectivity Systems – Digital Media Solutions – Operations Solutions • 1,000+ employees worldwide GEE & EMC OVERVIEW
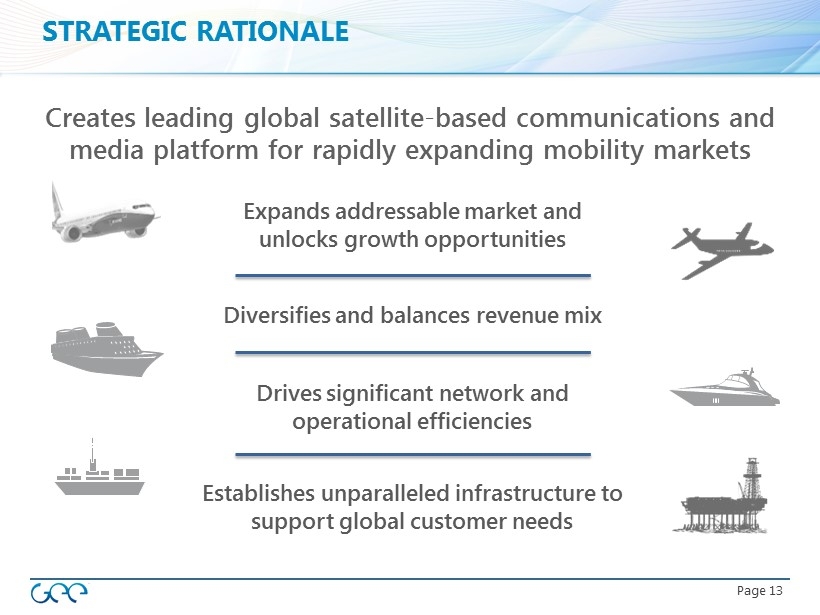
Page 13 Expands addressable market and unlocks growth opportunities Drives significant network and operational efficiencies Establishes unparalleled infrastructure to support global customer needs Creates leading global satellite - based communications and media platform for rapidly expanding mobility markets Diversifies and balances revenue mix STRATEGIC RATIONALE
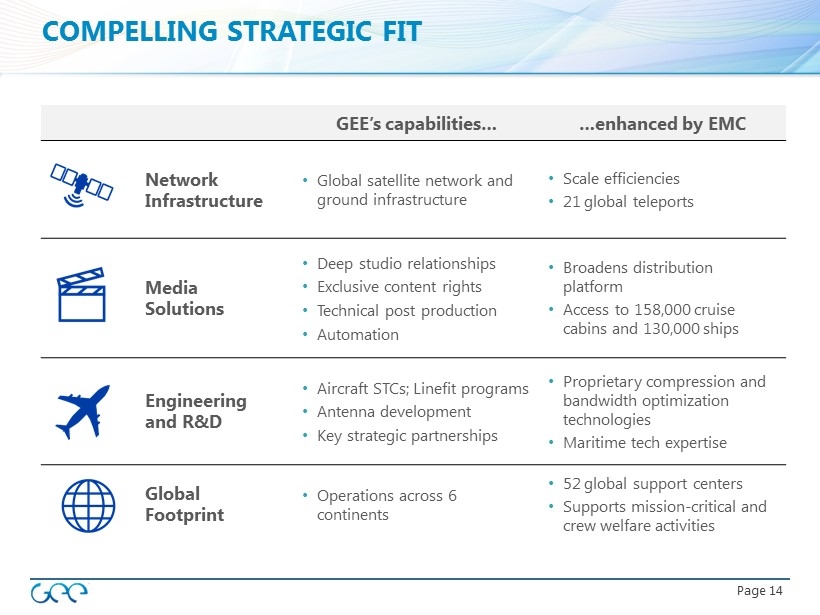
Page 14 GEE’s capabilities… …enhanced by EMC Network Infrastructure • Global satellite network and ground infrastructure • Scale efficiencies • 21 global teleports Media Solutions • Deep studio relationships • Exclusive content rights • Technical post production • Automation • Broadens distribution platform • Access to 158,000 cruise cabins and 130,000 ships Engineering and R&D • Aircraft STCs; Linefit programs • Antenna development • Key strategic partnerships • Proprietary compression and bandwidth optimization technologies • Maritime tech expertise Global Footprint • Operations across 6 continents • 52 global support centers • Supports mission - critical and crew welfare activities COMPELLING STRATEGIC FIT
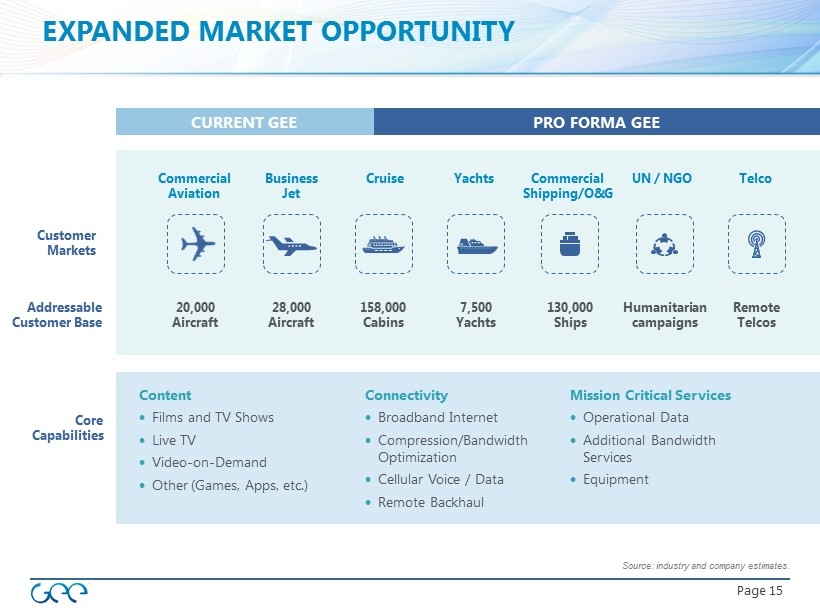
Page 15 EXPANDED MARKET OPPORTUNITY Source: industry and company estimates. Addressable Customer Base Core Capabilities Customer Markets Commercial Aviation Cruise Yachts UN / NGO Telco Business Jet 20,000 Aircraft 158,000 Cabins 130,000 Ships 7,500 Yachts Remote Telcos Humanitarian campaigns Content Films and TV Shows Live TV Video - on - Demand Other (Games, Apps, etc.) Connectivity Broadband Internet Compression/Bandwidth Optimization Cellular Voice / Data Remote Backhaul Mission Critical Services Operational Data Additional Bandwidth Services Equipment CURRENT GEE PRO FORMA GEE 28,000 Aircraft Commercial Shipping/O&G
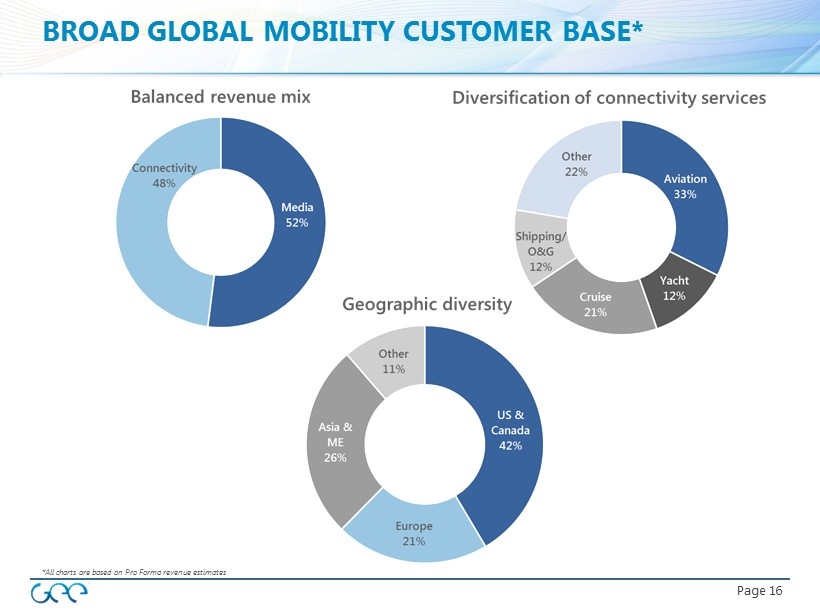
Page 16 *All charts are based on Pro Forma revenue estimates BROAD GLOBAL MOBILITY CUSTOMER BASE*
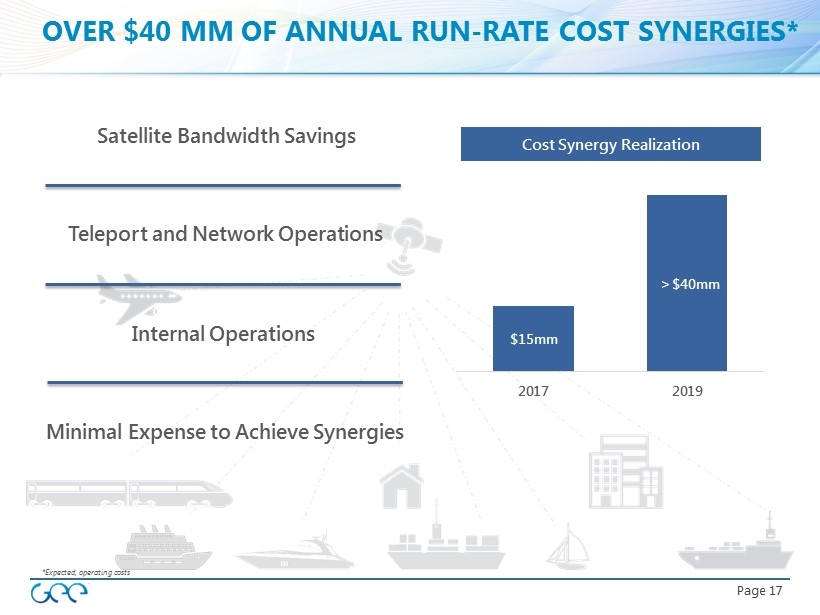
Page 17 Satellite Bandwidth Savings Teleport and Network Operations Internal Operations $15mm $40mm 2017 2019 Minimal Expense to Achieve Synergies Cost Synergy Realization OVER $40 MM OF ANNUAL RUN - RATE COST SYNERGIES* > *Expected, operating costs
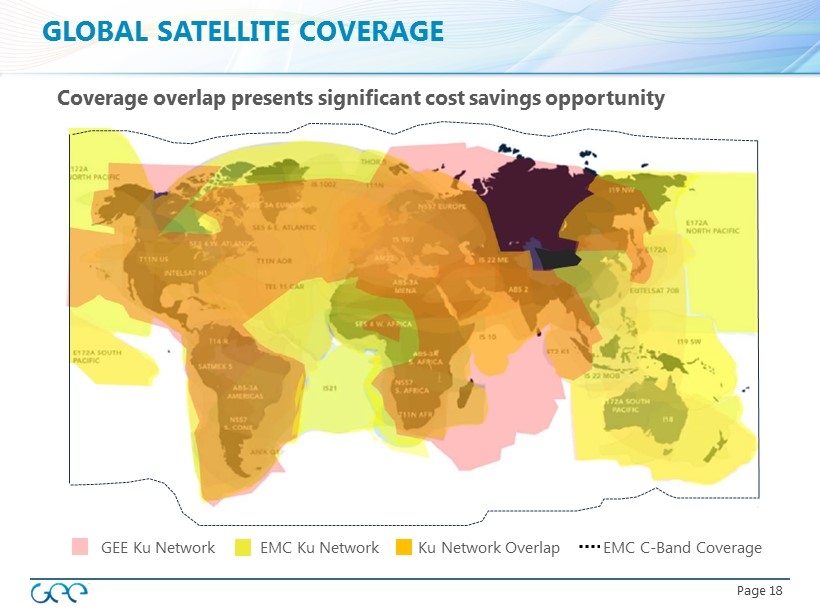
Page 18 GEE Ku Network EMC Ku Network Ku Network Overlap EMC C - Band Coverage GLOBAL SATELLITE COVERAGE Coverage overlap presents significant cost savings opportunity
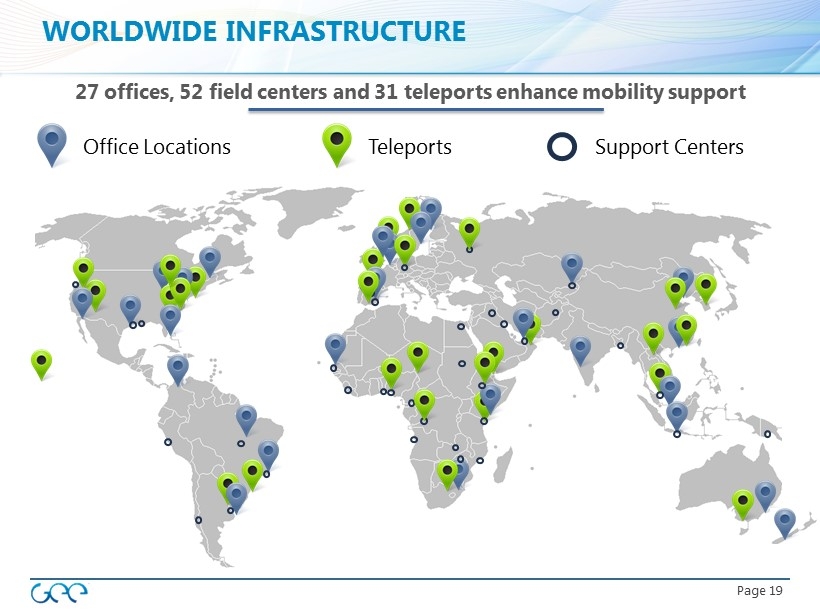
Page 19 Office Locations Support Centers Teleports 27 offices, 52 field centers and 31 teleports enhance mobility support WORLDWIDE INFRASTRUCTURE
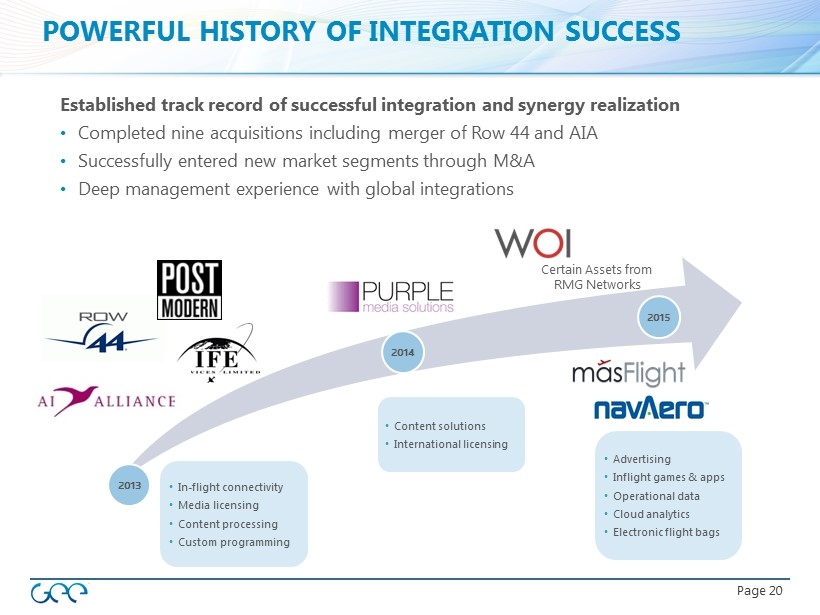
Page 20 • In - flight connectivity • Media licensing • Content processing • Custom programming 2013 2014 2015 Established track record of successful integration and synergy realization • Completed nine acquisitions including merger of Row 44 and AIA • Successfully entered new market segments through M&A • Deep management experience with global integrations • Content solutions • International licensing • Advertising • Inflight games & apps • Operational data • Cloud analytics • Electronic flight bags POWERFUL HISTORY OF INTEGRATION SUCCESS Certain Assets from RMG Networks

Page 21 COMBINED FINANCIAL STRENGTH ($ in millions, unless otherwise noted) 2016E Revenue Revenue Mix 2016E PF Adj. EBITDA Customers GEE EMC NEW GEE = + $470 - 490MM $190 - $200MM $660 - 690MM 72% Content 28% Connectivity $57 - 65MM $55 - 65MM $112 - 130MM 200+ 200+ 400+ 5% Content 9 5% Connectivity 52 % Content 4 8 % Connectivity Addressable Market 50k Aircraft 1mm Vessels 1mm+ mobility platforms Excludes $40 million of run - rate synergies (1) See Appendix A for the definition of EMC Adjusted EBITDA , GEE Adjusted EBITDA and Pro Forma Adjusted EBITDA GEE’s revenue base is expected to increase by ~40% and Adj. EBITDA (1) is expected to approximately double (excluding synergies) • EMC 2016E forecast: Revenue $190 - 200 million / Adj. EBITDA (1) $55 - 65 million • Strong balance sheet with low projected net leverage ratios
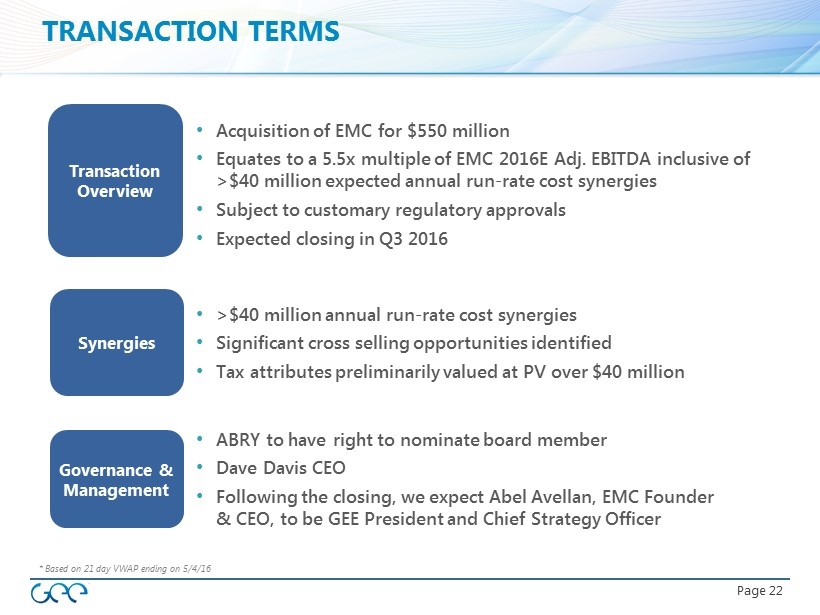
Page 22 Synergies Governance & Management * Based on 21 day VWAP ending on 5/4/16 Transaction Overview • Acquisition of EMC for $550 million • Equates to a 5.5x multiple of EMC 2016E Adj. EBITDA inclusive of >$40 million expected annual run - rate cost synergies • Subject to customary regulatory approvals • Expected closing in Q3 2016 • >$40 million annual run - rate cost synergies • Significant cross selling opportunities identified • Tax attributes preliminarily valued at PV over $ 40 million • ABRY to have right to nominate board member • Dave Davis CEO • Following the closing, we expect Abel Avellan, EMC Founder & CEO, to be GEE President and Chief Strategy Officer TRANSACTION TERMS
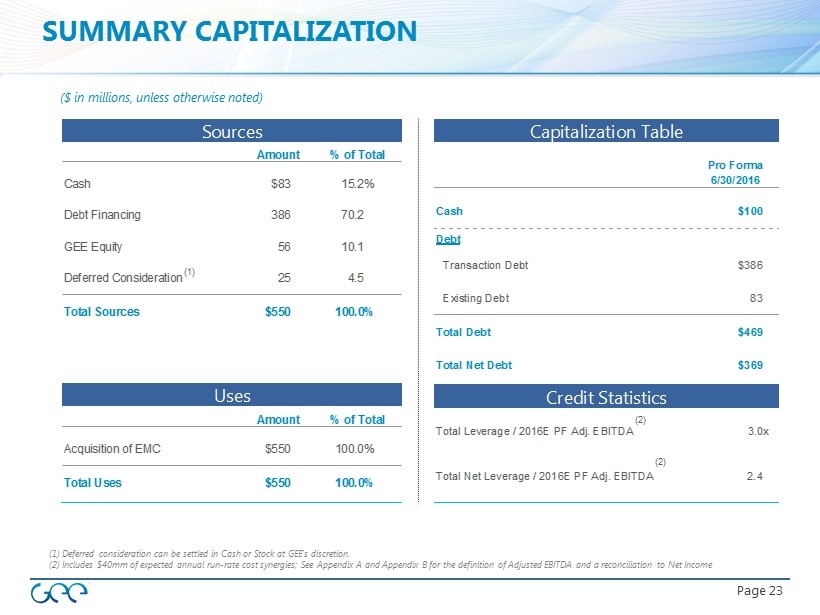
Page 23 SUMMARY CAPITALIZATION (1) Deferred consideration can be settled in Cash or Stock at GEE's discretion. (2) Includes $40mm of expected annual run - rate cost synergies ; See Appendix A and Appendix B for the definition of Adjusted EBITDA and a reconciliation to Net Income ($ in millions, unless otherwise noted) Sources Amount % of Total Cash $83 15.2% Debt Financing 386 70.2 GEE Equity 56 10.1 Deferred Consideration 25 4.5 Total Sources $550 100.0% Uses Amount % of Total Acquisition of EMC $550 100.0% Total Uses $550 100.0% (1) (2) (2) Capitalization Table Pro Forma 6/30/2016 Cash $100 Debt Transaction Debt $386 Existing Debt 83 Total Debt $469 Total Net Debt $369 Credit Statistics Total Leverage / 2016E PF Adj. EBITDA 3.0x Total Net Leverage / 2016E PF Adj. EBITDA 2.4
Page 24 Diversifies existing revenue base into adjacent mobility verticals and balances revenue mix Combined scale creates enhanced purchasing power and reduces satellite capacity costs that improves product Attractive valuation and strong deleveraging profile Combination forms a leading provider of global satellite - based communications and media content to the mobility market Expands content/media addressable market in high growth mobility verticals KEY TAKEAWAYS

Page 25 Investor Contacts: Kevin Trosian SVP, Corporate Development and Investor Relations Benjamin Goodman Director, Corporate Development and Investor Relations + 1 310 - 740 - 8624 investor.relations@geemedia.com FURTHER QUESTIONS

Appendix
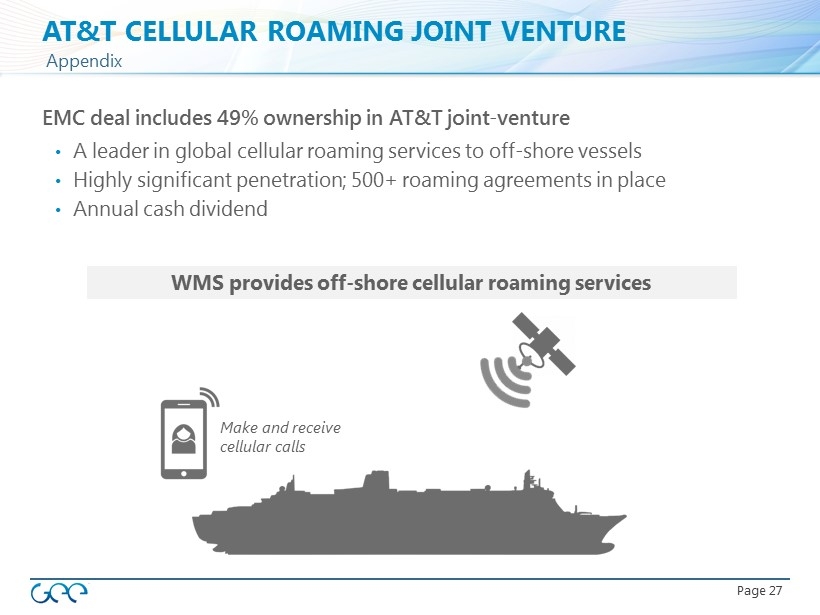
Page 27 AT&T CELLULAR ROAMING JOINT VENTURE EMC deal includes 49% ownership in AT&T joint - venture • A leader in global cellular roaming services to off - shore vessels • Highly significant penetration; 500+ roaming agreements in place • Annual cash dividend WMS provides off - shore cellular roaming services Make and receive cellular calls Appendix
Page 28 DEFINITION OF ADJUSTED EBITDA Appendix A Adjusted EBITDA To supplement our consolidated financial statements, which are prepared and presented in accordance with generally accepted accounting principles, or GAAP, we present Adjusted EBITDA, which is a non - GAAP financial measure, as a measure of our performance . The presentation of Adjusted EBITDA is not intended to be considered in isolation from, or as a substitute for, or superior to, net income (loss) or any other performance measures derived in accordance with GAAP or as an alternative to net cash provided by operating activities or any other measures of our cash flows or liquidity . Adjusted EBITDA is one of the primary measures used by our management and board of directors to understand and evaluate our financial performance and operating trends, including period to period comparisons, to prepare and approve our annual budget and to develop short and long term operational plans . Additionally, Adjusted EBITDA is one of the primary measures used by the compensation committee of our board of directors to establish the funding targets for our annual bonus pool for our employees and executives . We believe our presentation of Adjusted EBITDA is useful to investors both because it allows for greater transparency with respect to key metrics used by management in its financial and operational decision - making and our management frequently uses it in discussions with investors, commercial bankers, securities analysts and other users of our financial statements . We define Adjusted EBITDA as net income (loss) attributable to common stockholders before, when applicable, net income (loss) attributable to non - controlling interests, income tax expense (benefit), other (income) expense, depreciation and amortization, as further adjusted to eliminate the impact of, when applicable, stock - based compensation, acquisition and realignment costs, restructuring charges, foreign exchange gain (loss) on intercompany loans and any gains or losses on certain asset sales or dispositions . Other income (expense), acquisition and realignment costs and restructuring charges include such items, when applicable, as (a) non - cash GAAP purchase accounting adjustments for certain deferred revenue and costs, (b) legal, accounting and other professional fees directly attributable to acquisition activity, (c) employee severance payments and third party professional fees directly attributable to acquisition or corporate realignment activities, (d) certain non - recurring expenses associated with our expansion into China that did not generate associated revenue in 2014 , (e) legal settlements or reserves for legal settlements in the period that pertain to historical matters that existed at acquired companies prior to their purchase date, (f) non - cash impairment charge of a portion of certain receivables directly attributable to a customer undergoing economic hardships from trade sanctions imposed by the European Union and the United States on Russia in 2014 , (g) changes in the fair value of our derivative financial instruments, (h) interest expense associated with our debt and ( i ) any restructuring charges in the period pursuant to our integration plan announced on September 23 , 2014 . Management does not consider these costs to be indicative of our core operating results . EMC Adjusted EBITDA EMC Adjusted EBITDA is defined as the consolidated net income (loss) of EMC plus ( i ) total interest expense, (ii) amortization of financing fees, (iii) provision (benefit) for taxes based on income, profits or capital gains, (iv) depreciation and amortization, (v) unusual or non - recurring charges, expenses or losses, (vi) non - cash charges, expenses or losses including any non - cash expense related to the accretion of preferred stock or vesting of warrants, (vii) retention and severance expenses, (viii) any restructuring costs, integration costs, transition costs, or costs incurred in non - recurring strategic initiatives, (ix) other accruals and amortization thereof, (x) proceeds of business interruption insurance, (xi) any non - cash increase in expenses resulting from the revaluation of inventory or due to purchase accounting, (xi) letter of credit fees, (xii) the amount of management fees or sponsor reimbursement expenses, (xiii) any equity funded employee plan costs, (xiv) any net loss from discontinued operations, (xv) EMC’s proportional share of Wireless Maritime Services’ EBITDA for the same period and (xvi) any non - cash loss related to foreign currency translation that were not included in consolidated net income . Pro Forma Adjusted EBITDA Pro Forma 2016 Adjusted EBITDA represents our projected 2016 full year Adjusted EBITDA plus projected full year 2016 EMC Adjusted EBITDA, assuming the acquisition occurred on January 1 , 2016 , and excluding any projected annual run - rate cost synergies . Projections With respect to projected 2016 Adjusted EBITDA, EMC Adjusted EBITDA and Pro Forma Adjusted EBITDA we are unable to prepare a quantitative reconciliation without unreasonable effort, and we are unable to address the probable significance of the unavailable information .
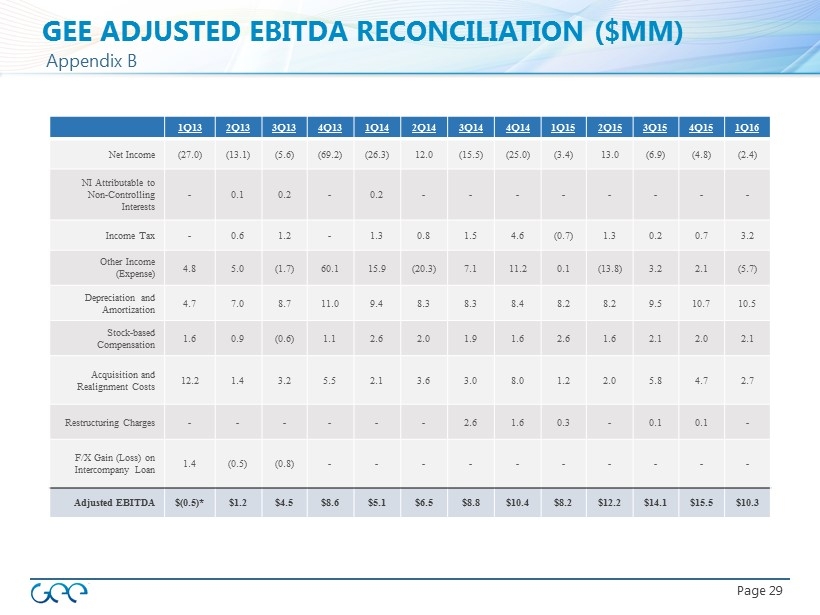
Page 29 GEE ADJUSTED EBITDA RECONCILIATION ($MM) Appendix B 1Q13 2Q13 3Q13 4Q13 1Q14 2Q14 3Q14 4Q14 1Q15 2Q15 3Q15 4Q15 1Q16 Net Income (27.0) (13.1) (5.6) (69.2) (26.3) 12.0 (15.5) (25.0) (3.4) 13.0 (6.9) (4.8) (2.4) NI Attributable to Non - Controlling Interests - 0.1 0.2 - 0.2 - - - - - - - - Income Tax - 0.6 1.2 - 1.3 0.8 1.5 4.6 (0.7) 1.3 0.2 0.7 3.2 Other Income (Expense) 4.8 5.0 (1.7) 60.1 15.9 (20.3) 7.1 11.2 0.1 (13.8) 3.2 2.1 (5.7) Depreciation and Amortization 4.7 7.0 8.7 11.0 9.4 8.3 8.3 8.4 8.2 8.2 9.5 10.7 10.5 Stock - based Compensation 1.6 0.9 (0.6) 1.1 2.6 2.0 1.9 1.6 2.6 1.6 2.1 2.0 2.1 Acquisition and Realignment Costs 12.2 1.4 3.2 5.5 2.1 3.6 3.0 8.0 1.2 2.0 5.8 4.7 2.7 Restructuring Charges - - - - - - 2.6 1.6 0.3 - 0.1 0.1 - F/X Gain (Loss) on Intercompany Loan 1.4 (0.5) (0.8) - - - - - - - - - - Adjusted EBITDA $(0.5)* $1.2 $4.5 $8.6 $5.1 $6.5 $8.8 $10.4 $8.2 $12.2 $14.1 $15.5 $10.3